
Latest blog post
Advanced Service Monitoring with Anuta ATOM
Service Monitoring in ATOM collects a wealth of metrics and delivers intuitive reports to monitor the service health, efficiency, capacity, and performance.
 Skip to content
 Learn how Anuta Networks instills Service & Operational agility into your networks with Anuta ATOM & ATOM Cloud – Your Next-generation Network Automation & Assurance Solutions
Learn how Anuta Networks instills Service & Operational agility into your networks with Anuta ATOM & ATOM Cloud – Your Next-generation Network Automation & Assurance Solutions
Learn how Anuta Networks instills Service & Operational agility into your networks with Anuta ATOM & ATOM Cloud – Your Next-generation Network Automation & Assurance Solutions
Learn how Anuta Networks instills Service & Operational agility into your networks with Anuta ATOM & ATOM Cloud – Your Next-generation Network Automation & Assurance Solutions
For organizations, gaining profound insights into their business processes is essential for making informed, data-driven decisions that drive process optimization. ATOM offers customized and automated reports for every workflow for enhanced network infrastructure management. These reports deliver a holistic network health overview, facilitate compliance checks and capacity planning, and provide insights through performance trend analysis. Additionally, ATOM’s dashboards are fully configurable, accommodating diverse elements within the system for a tailored experience.


Gain insights into workflow durations based on different process variables. Group variables to identify areas impacting processes significantly.

Monitor process instance variations over time to adjust resources accordingly. Create custom reports for analyzing process instances and their characteristics.

Focus optimization efforts on specific tasks by analyzing minimum, maximum, median, and average task durations on flow nodes.

Concentrate on specific steps in complex processes, analyzing durations to develop performance-enhancing strategies.

Delve into DMN decision tables outside your processes. Examine evaluations, input/output variables, and rule matches for optimization insights.
Explore trends in activity frequencies through a Stacked Bar Chart, categorized by daily, weekly, or monthly intervals, providing valuable insights into task patterns over time.

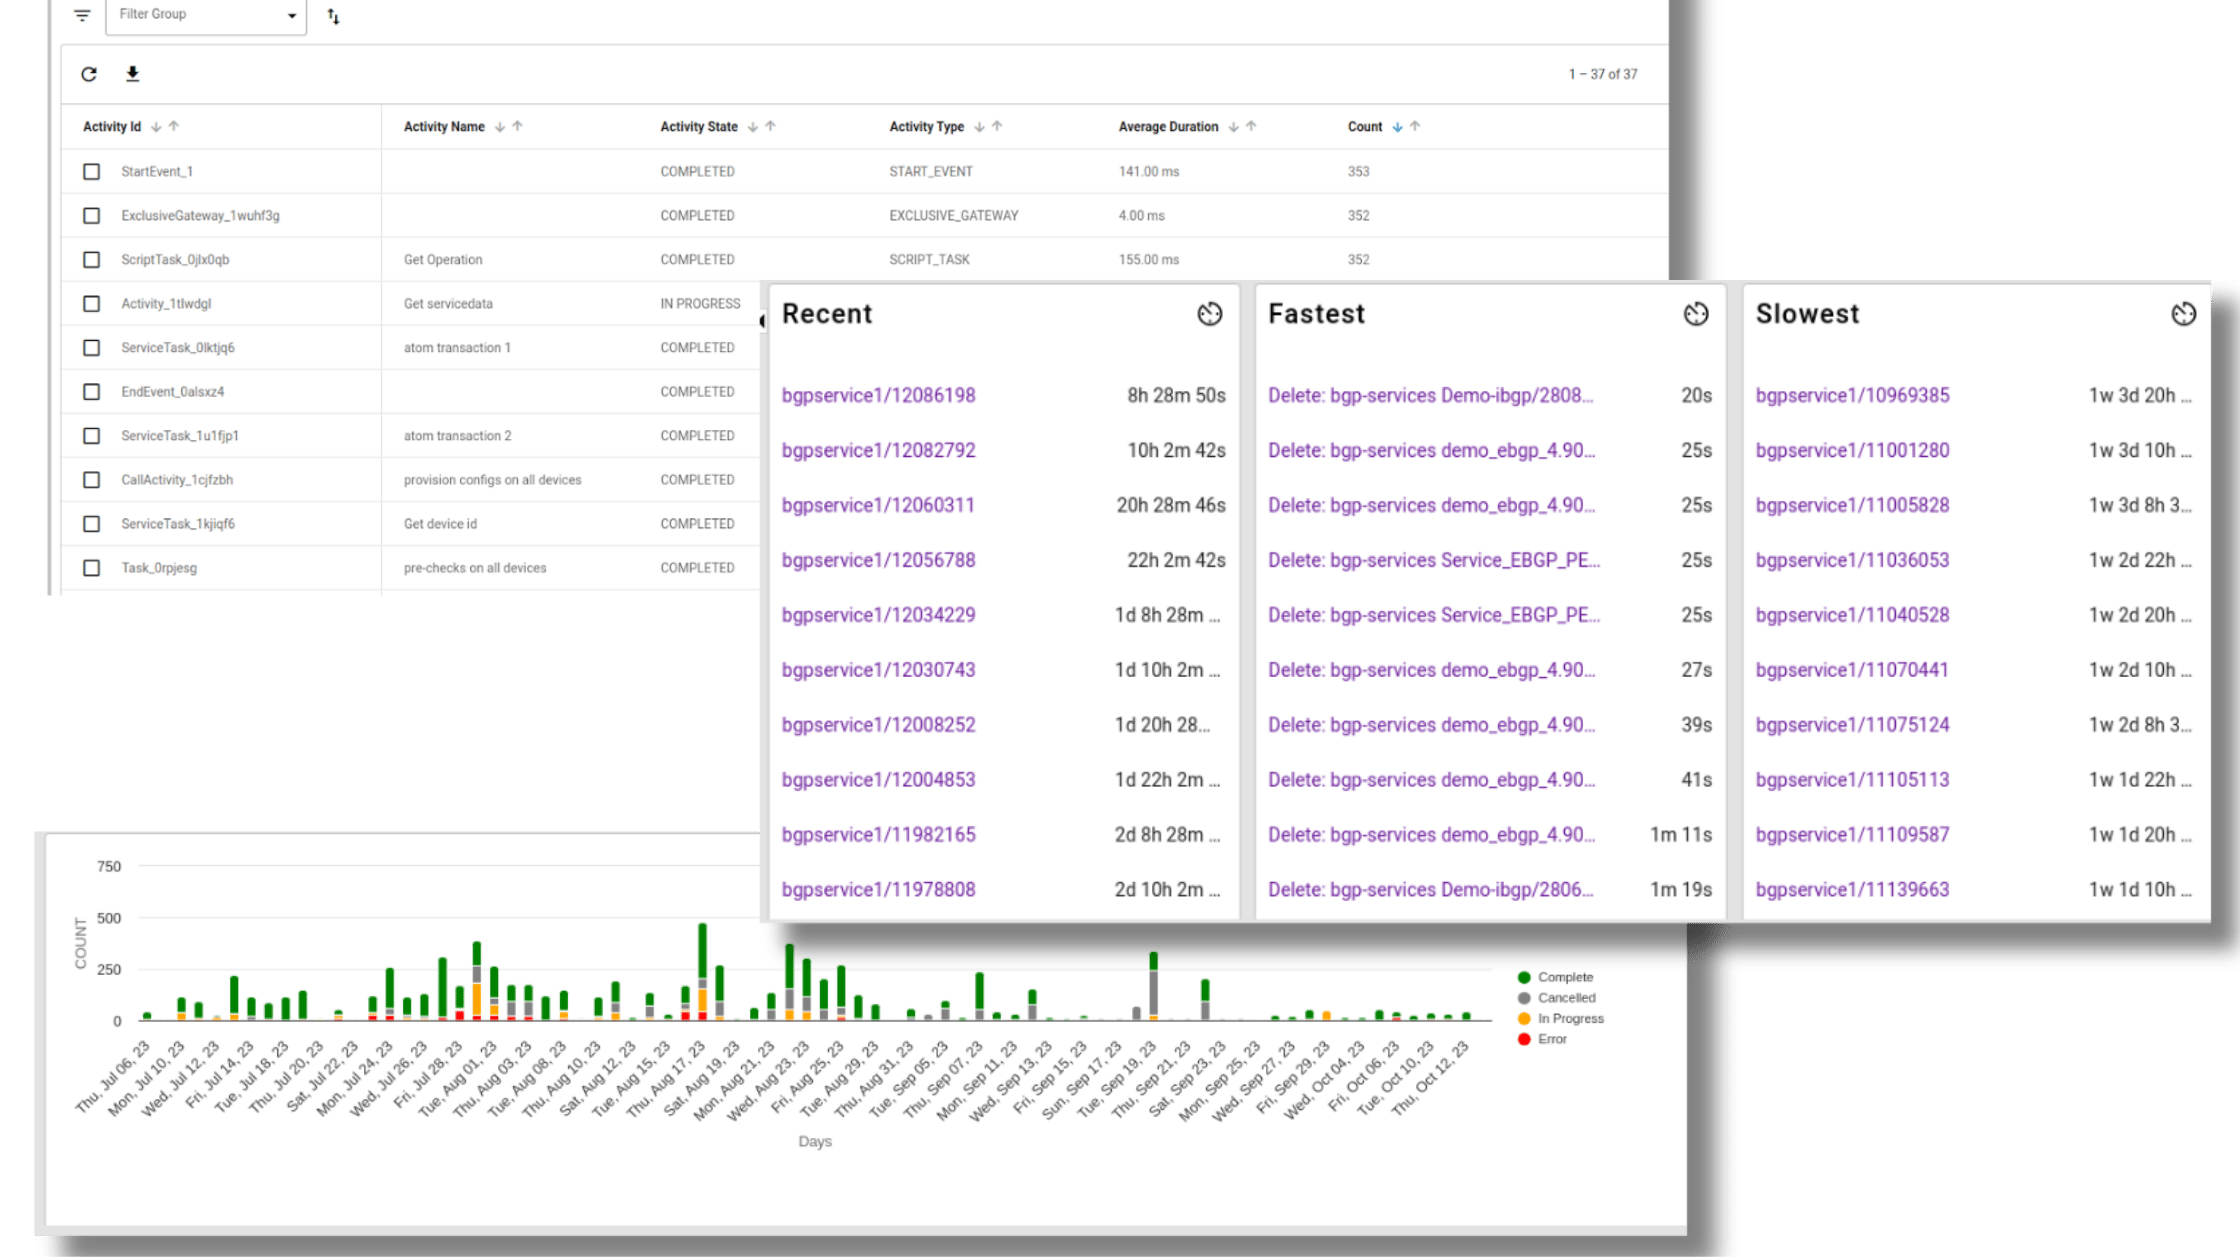
View a histogram that displays the duration of recent, fastest, and slowest instances in your chosen time unit, providing a visual representation of workflow performance over time.

Keep tabs on the status of workflows, whether they are actively in progress, canceled, have encountered errors, or have been completed.

Monitor the compliance of your workflows with defined Service Level Agreements (SLAs), offering a clear understanding of which workflows meet these commitments.

Explore trends in SLA Compliance or business status data, displayed in a Stacked Bar Chart format and grouped by daily, weekly, or monthly intervals, providing valuable insights into workflow performance trends over time.

Keep a comprehensive watch on the status of user tasks, encompassing unclaimed, assigned, completed, and canceled states.

Analyze activity performance with histograms showcasing both average duration and execution frequency, enabling you to identify both the quickest and most frequent actions within your processes.
ATOM
Anuta Networks International LLC
1525 McCarthy Blvd #1020,
Milpitas, CA 95035 USA
Phone: +1 408.458.7955
Email: info@anutanetworks.com
Anuta Networks Private Limited No.134/1 & 134/2, 1st Floor, Brigade Tech Park – Block B, Pattandur Agrahara Village, K R Puram Hobli, Whitefield Road, Whitefield Bangalore KARNATAKA – 560066 INDIA
Phone: +91 7338133108