
Latest blog post
Advanced Service Monitoring with Anuta ATOM
Service Monitoring in ATOM collects a wealth of metrics and delivers intuitive reports to monitor the service health, efficiency, capacity, and performance.
 Skip to content
 Learn how Anuta Networks instills Service & Operational agility into your networks with Anuta ATOM & ATOM Cloud – Your Next-generation Network Automation & Assurance Solutions
Learn how Anuta Networks instills Service & Operational agility into your networks with Anuta ATOM & ATOM Cloud – Your Next-generation Network Automation & Assurance Solutions
Learn how Anuta Networks instills Service & Operational agility into your networks with Anuta ATOM & ATOM Cloud – Your Next-generation Network Automation & Assurance Solutions
Learn how Anuta Networks instills Service & Operational agility into your networks with Anuta ATOM & ATOM Cloud – Your Next-generation Network Automation & Assurance Solutions
A dashboard should provide a user-friendly and intuitive interface for efficient visualization and analysis of process data, allowing users to view their network fully. Recognizing this necessity, ATOM offers pre-configured dashboards and the flexibility to customize them. Users can effortlessly create personalized dashboards by dragging and dropping widgets onto a blank canvas, setting it apart as a highly adaptable dashboard system.
Dashboards are configurable for many items within ATOM, including devices, workflows, compliance, assurance, alerts, external integrations, and servers. Users can create and pin reports to their chosen dashboard, which can be added or removed with a single click.
Dashlets, which include grid views, charts, graphs, and other supported types, can be easily rearranged within the dashboard to prioritize critical information. When a dashlet becomes unnecessary, it can be effortlessly removed to suit the requirement. Users can pin similar dashlets to a dashboard to curate relevant data for informed decision-making.
For instance, the Software Compliance Dashboard can display compliant and non-compliant graphs based on device count, device family group, or vendor group, and it can be further customized by adding more relevant dashlets.

Use target values to proactively identify and address areas requiring attention for optimal user experiences

Continuously track process performance, gather data from various sources, and use consolidated dashboards to optimize for better returns

Leverage the expressive report builder, detailed filters, BPMN heatmaps, and analysis tools to uncover actionable insights and improvement opportunities.

Establish and share KPIs to enable process owners to explore and enhance performance metrics.

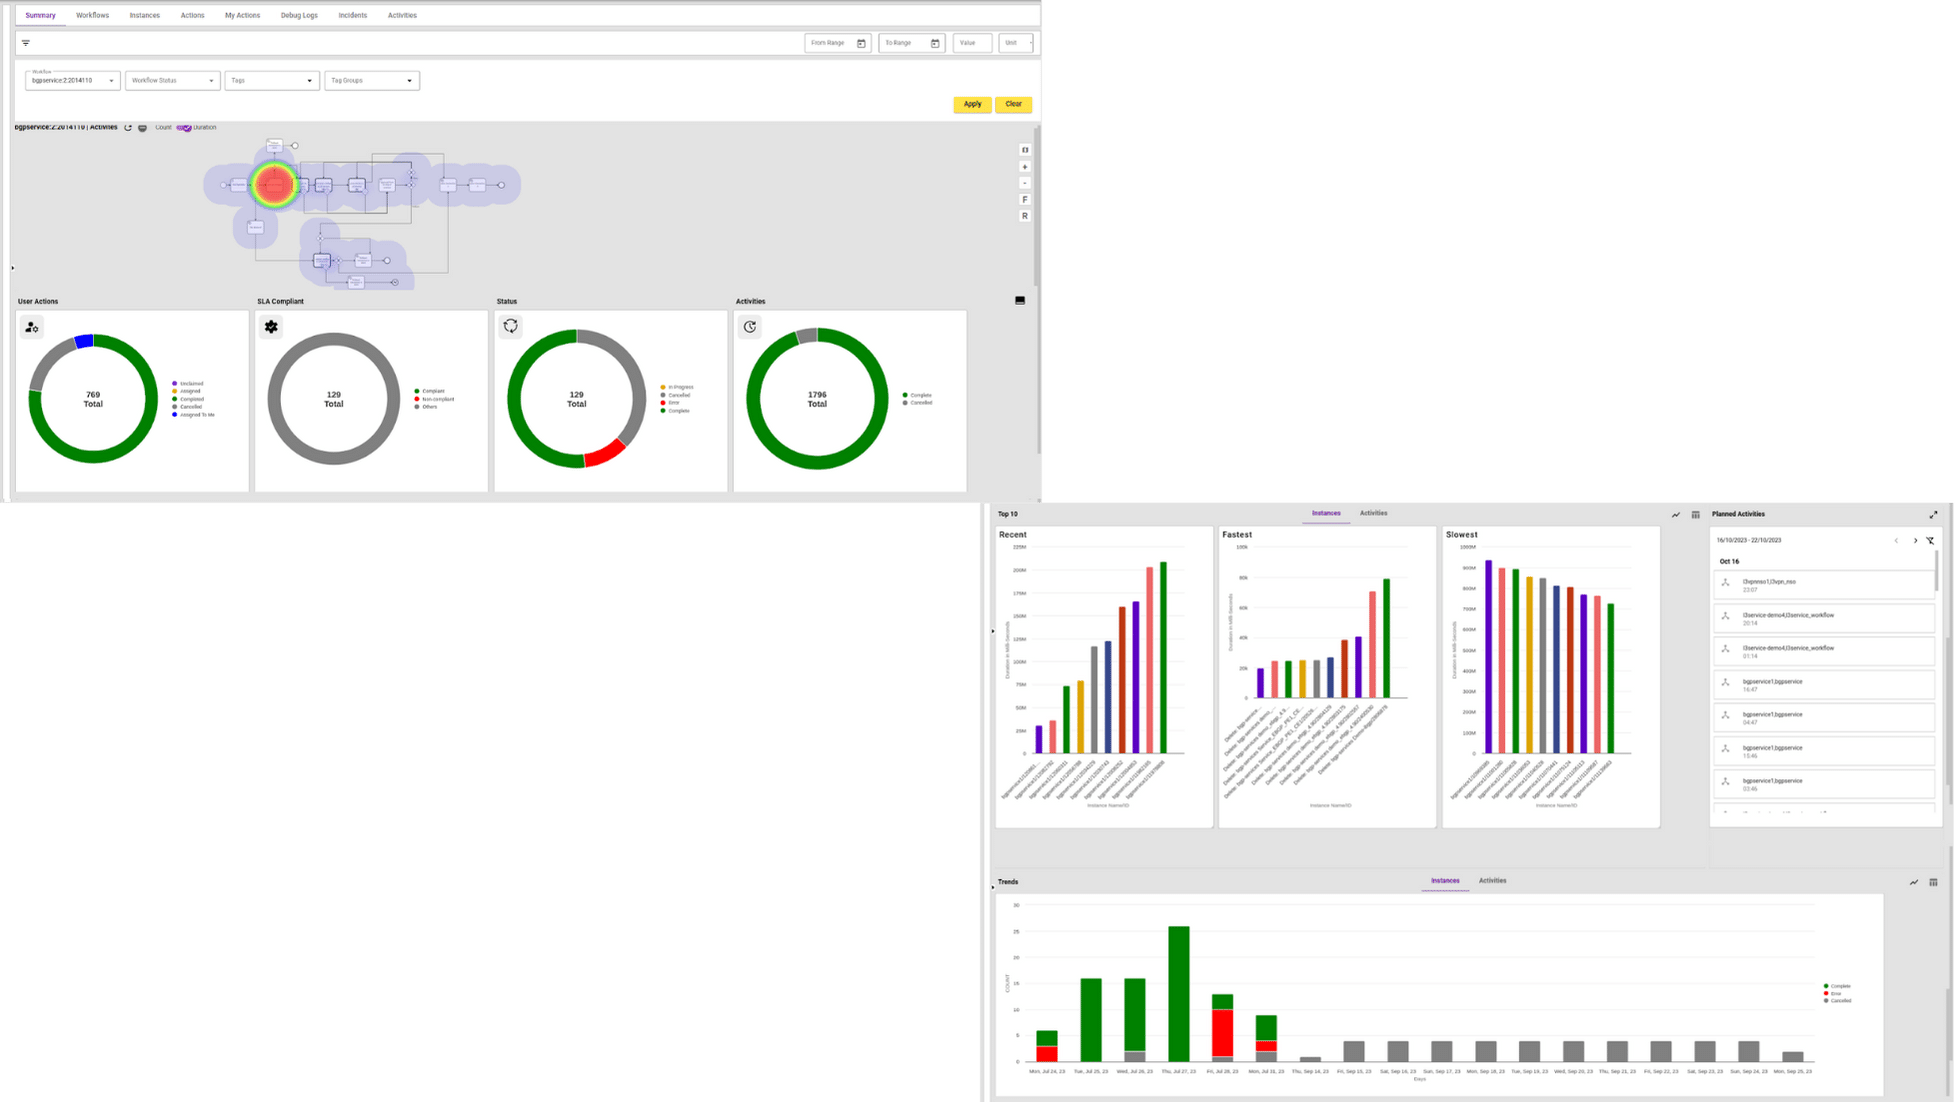
Keep a real-time pulse on your workflows – from ongoing tasks to completed projects

Efficiently manage user tasks, monitoring their progression from assignment to completion

Stay in control of all activities – those in progress, completed, or canceled

Ensure your Service Level Agreements (SLAs) are consistently met and compliance maintained

Uncover valuable insights by analyzing trends in recent, fastest, and slowest instances and activities
ATOM
Anuta Networks International LLC
1525 McCarthy Blvd #1020,
Milpitas, CA 95035 USA
Phone: +1 408.458.7955
Email: info@anutanetworks.com
Anuta Networks Private Limited No.134/1 & 134/2, 1st Floor, Brigade Tech Park – Block B, Pattandur Agrahara Village, K R Puram Hobli, Whitefield Road, Whitefield Bangalore KARNATAKA – 560066 INDIA
Phone: +91 7338133108