 Skip to content

Network automation is key to accelerating the provisioning of services for any IT organization. Once any service is provisioned, monitoring health is even more critical to ensure that the provisioned service is continuing to function within design, performance, and uptime parameters. This is critical since network operators must monitor the health, operating efficiency, traffic-handling capacity, and performance metrics of managed devices and configured services throughout their lifecycles. Real-time information from devices and services also helps operators identify, analyze and remediate performance issues.
The effectiveness of a service monitoring solution depends on the wealth of the information collected and the intuitive nature of the reporting. This blog will share my insights related to the breadth and depth of service monitoring capabilities in ATOM.
Within ATOM, service monitoring reports are available under Resource Manager > Inventory > CSD Report. Here you will find the Dashboard and Instances pages where any NetOps team can view and monitor services and devices managed by ATOM.
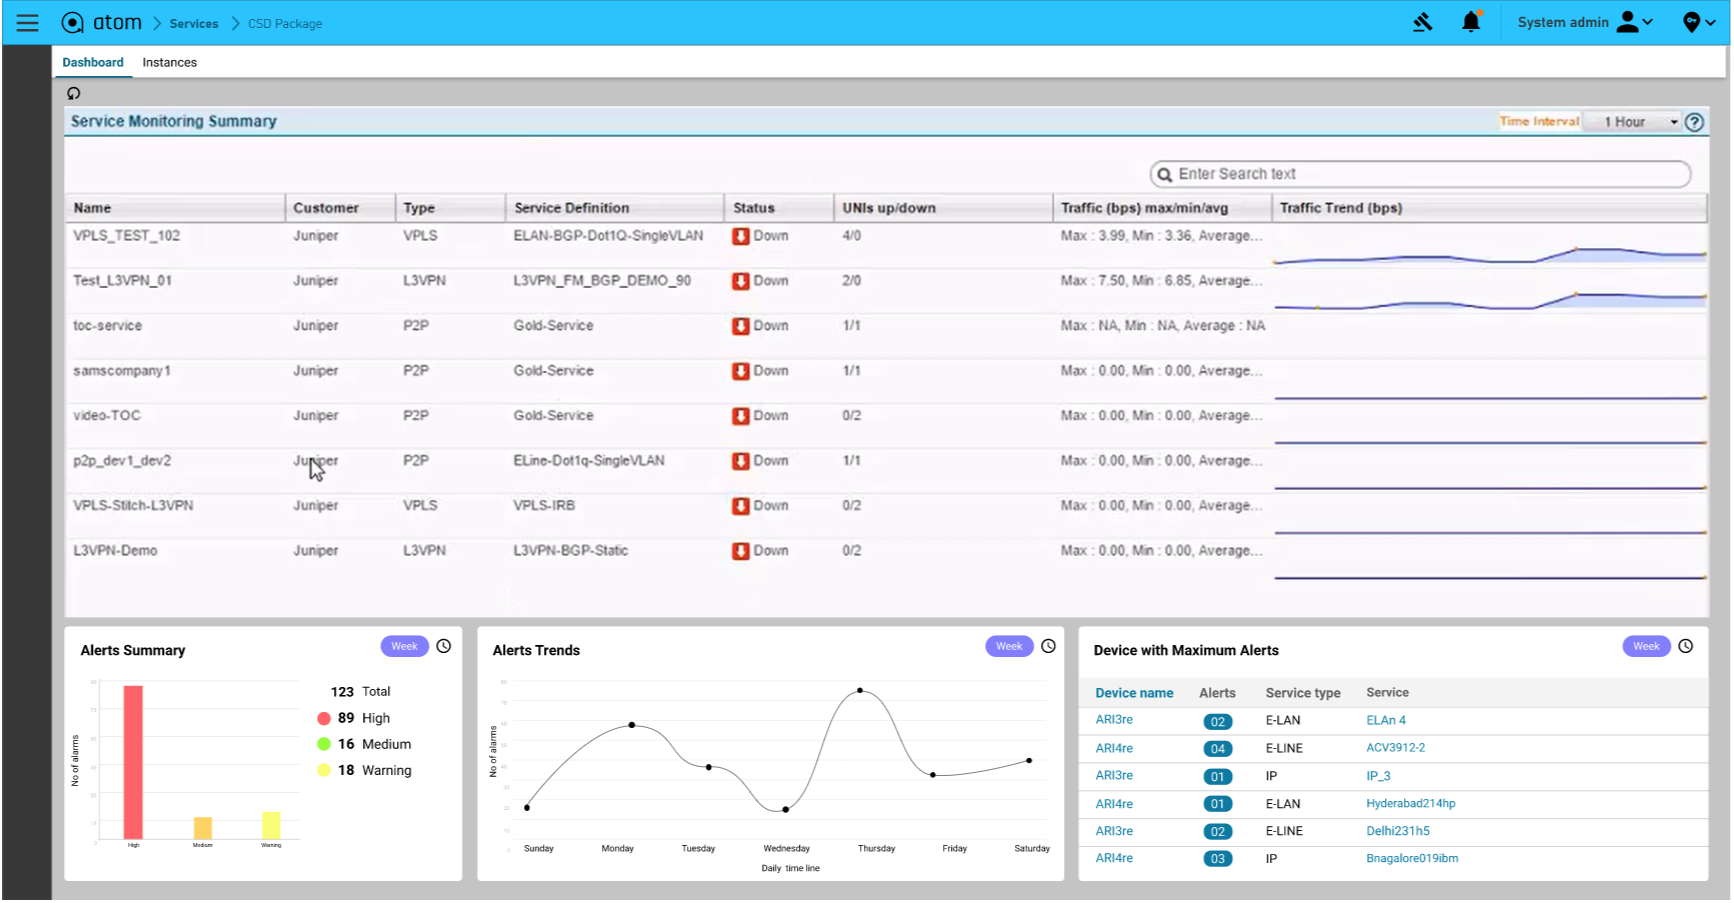
The Dashboard page displays a consolidated tabular view of all service instances and pertinent details, including the customer, type of service, service definition, traffic rate, and the traffic trend over time.
One can also find three other widgets (Alerts Summary, Alerts Trends, and Device with Maximum Alerts). There is a summary of alerts associated with these services within the widgets, which can provide an overall health and performance status of devices and services in any given network, enabling quick issue identification.
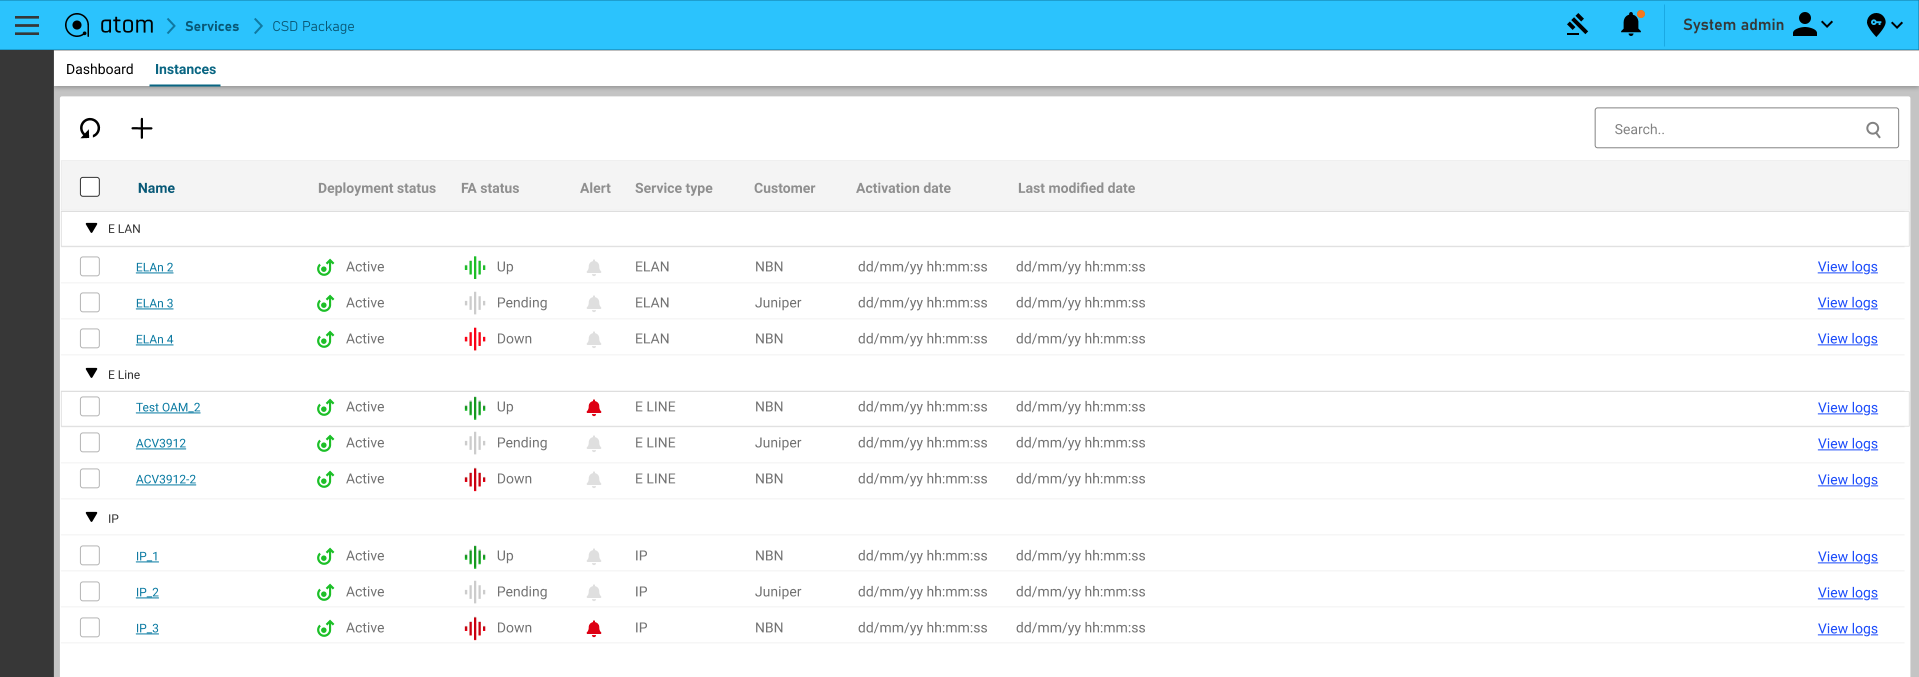
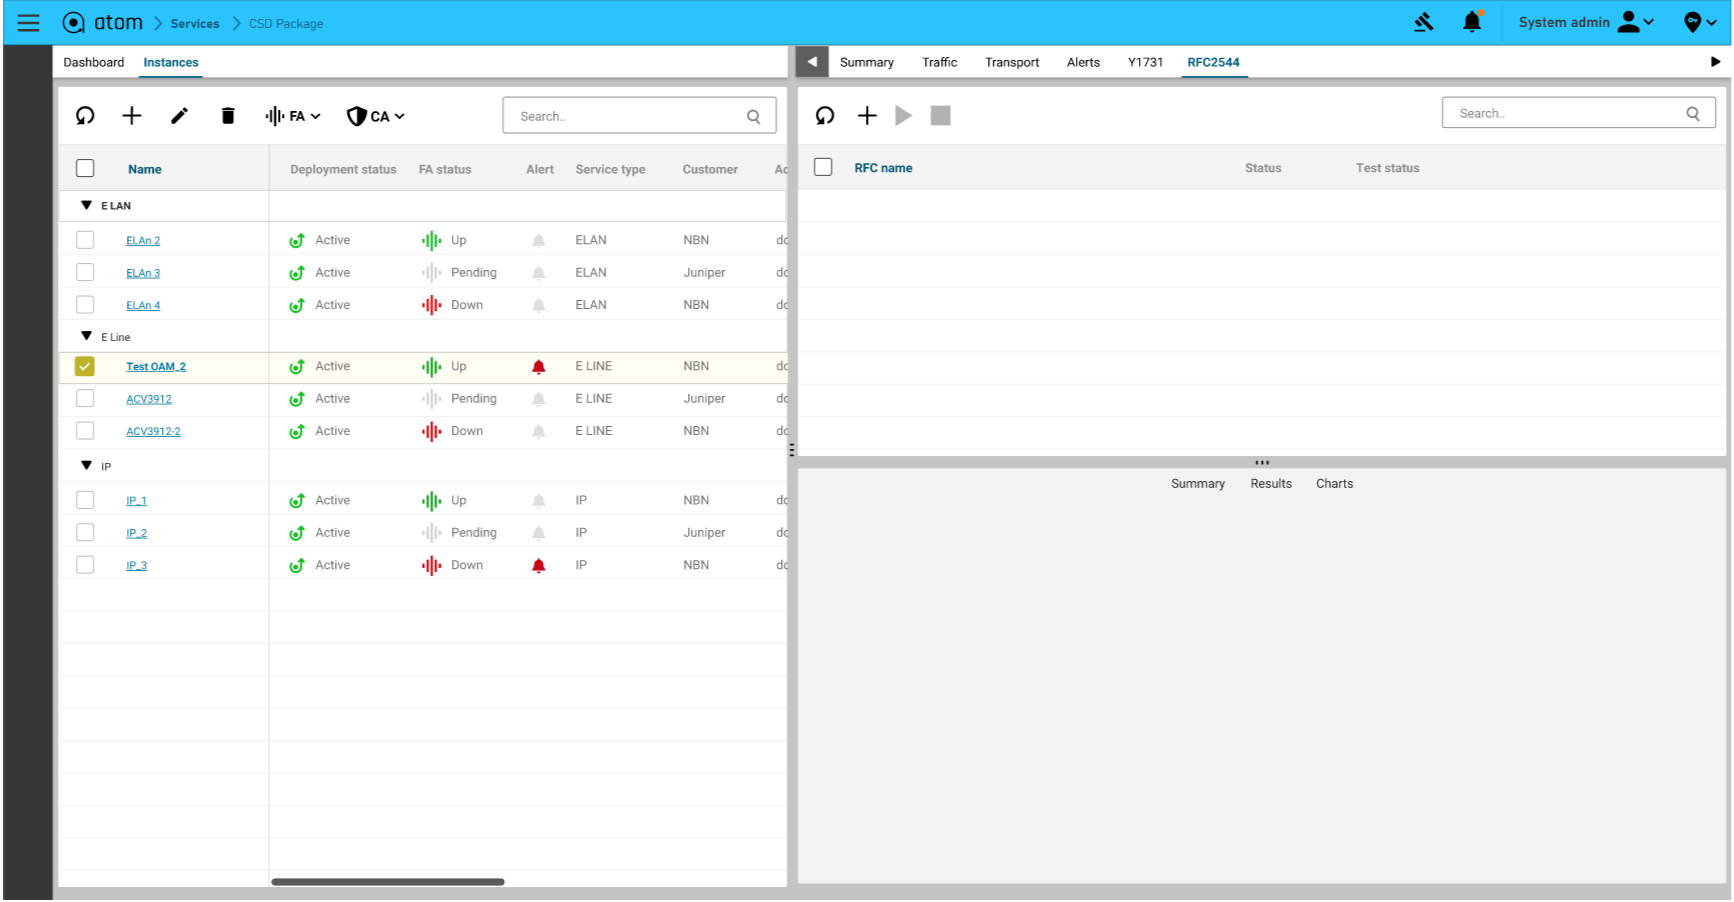
The Instances page displays the service view categorized by Service-Type (ELAN, ELINE, and IP). On this page, one has the option to create, delete and modify the service.
One can also perform a Functional Audit (FA) or a Configuration Audit (CA) on any service. FA runs operational commands on the device to verify that the service is up and running. CA verifies whether the configuration pushed to the device during deployment is currently on the device. Anuta Networks recommends that NetOps validates the service configuration and functional integrity of the service.
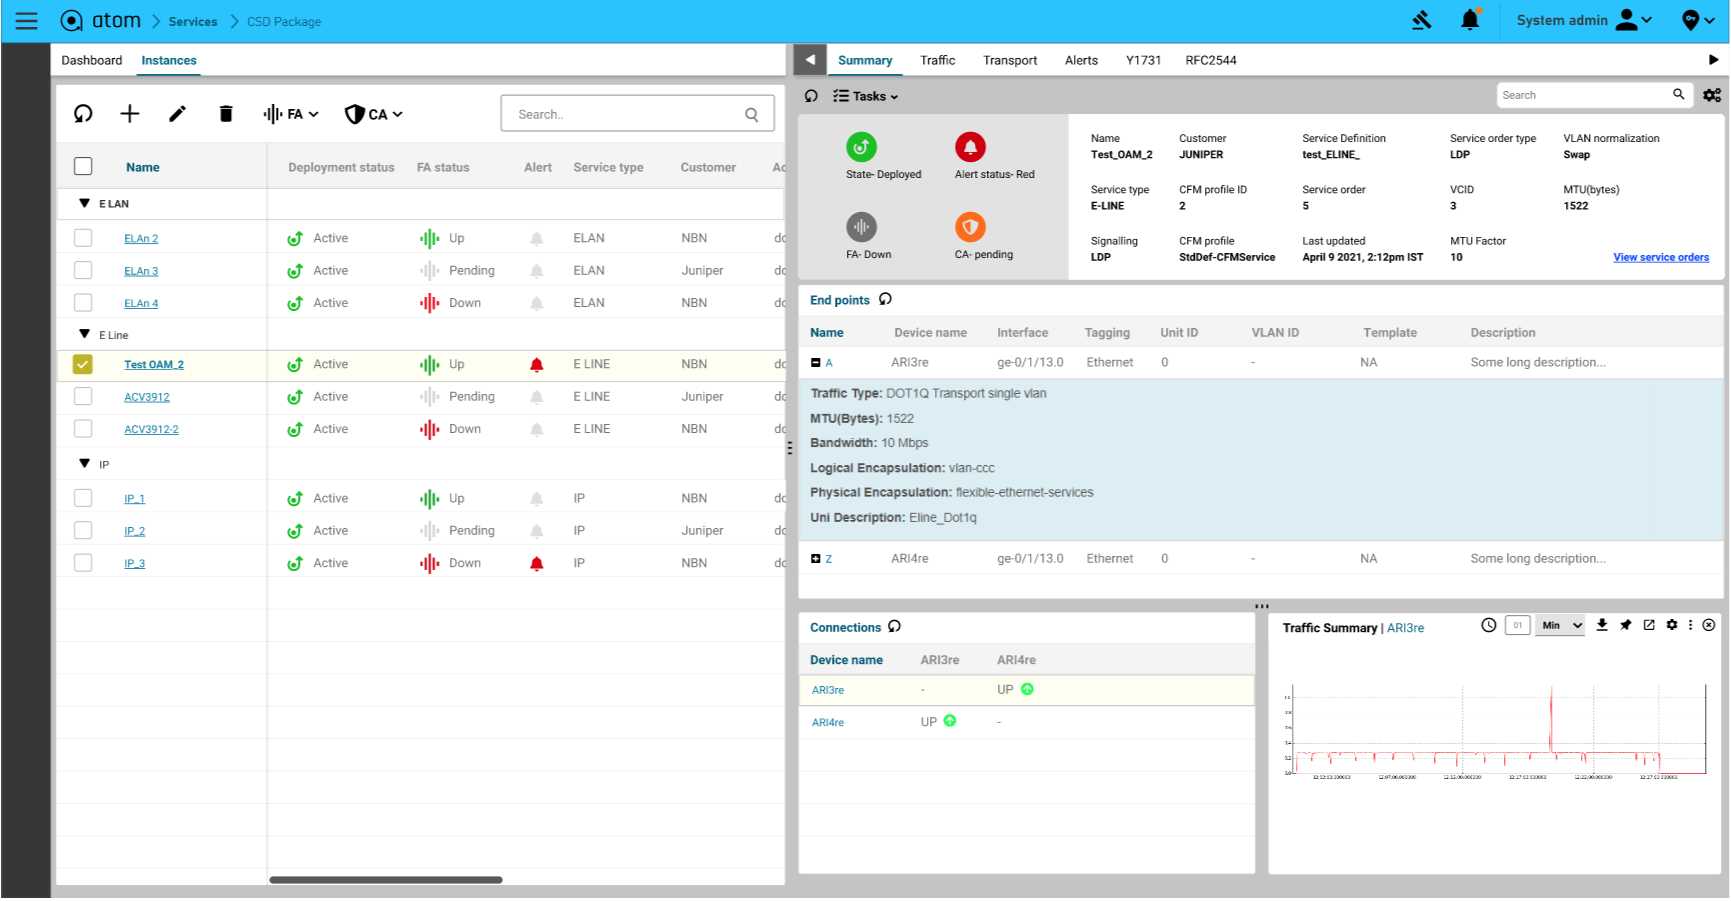
One can also monitor the detailed service view after selecting a specific service.
The following tabs are displayed when you click on the service:
Summary – This tab displays the consolidated and cumulative status of a service, such as ELINE, ELAN, and L3VPN. The Connections widget shows the connection status of the link (up or down) between peer source and destination devices. The status of the link is also displayed for ELINE and ELAN services. The Traffic Summary widget displays the total egress (Packets out) of traffic passing through all of the UNI or CE interfaces that are a part of the cumulative services. It is shown for point-to-point (ELINE), Layer 3 VPN (L3VPN), and virtual private LAN (ELAN) services.
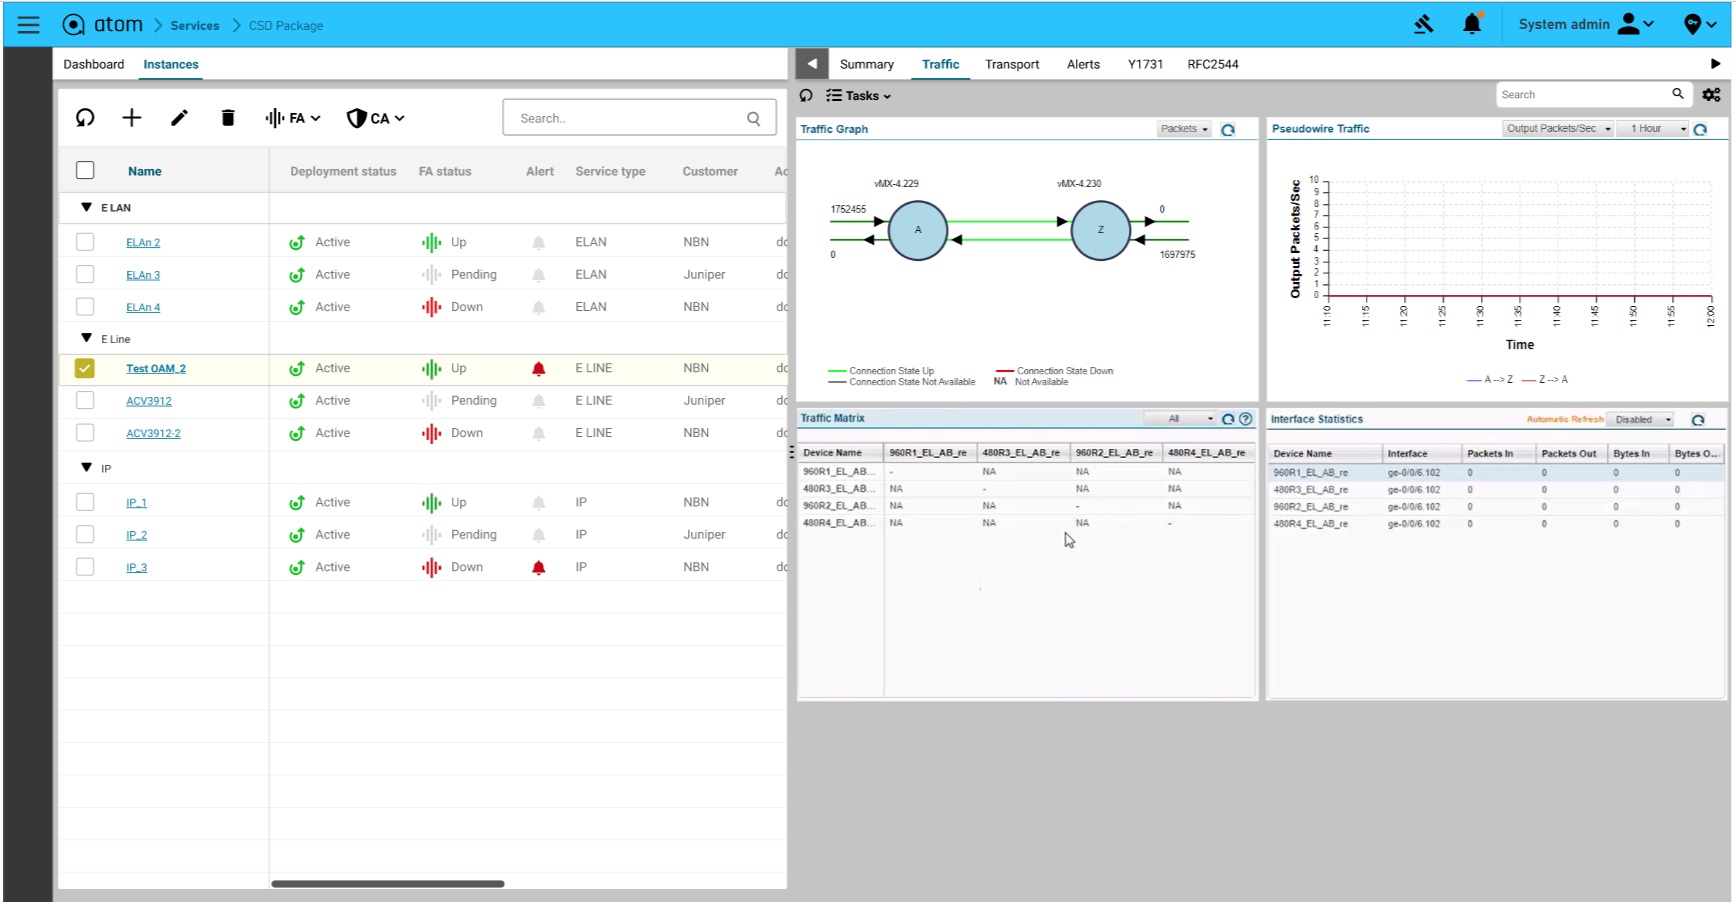
Traffic – This tab displays the end-to-end traffic matrix between peer devices. One can view metrics for input packets, input bytes, output packets, and output bytes. The Traffic Graph widget displays the number of packets transmitted between peer devices. Secondly, the Pseudo wire Traffic widget displays a line chart of the number of output packets or output bytes over time. Finally, the Interface Statistics widget displays traffic data on all user-to-network interfaces (UNI) or site interfaces that are part of the service. The data is available only if queues are enabled on the interface and retrieved in real-time from the device without being cached (polling at periodic intervals and displaying a snapshot in time).
The Traffic Matrix widget displays the number of packets transmitted between peer devices. A table is displayed with the row representing the source device and columns denoting the devices or network elements in the path up to the destination device.
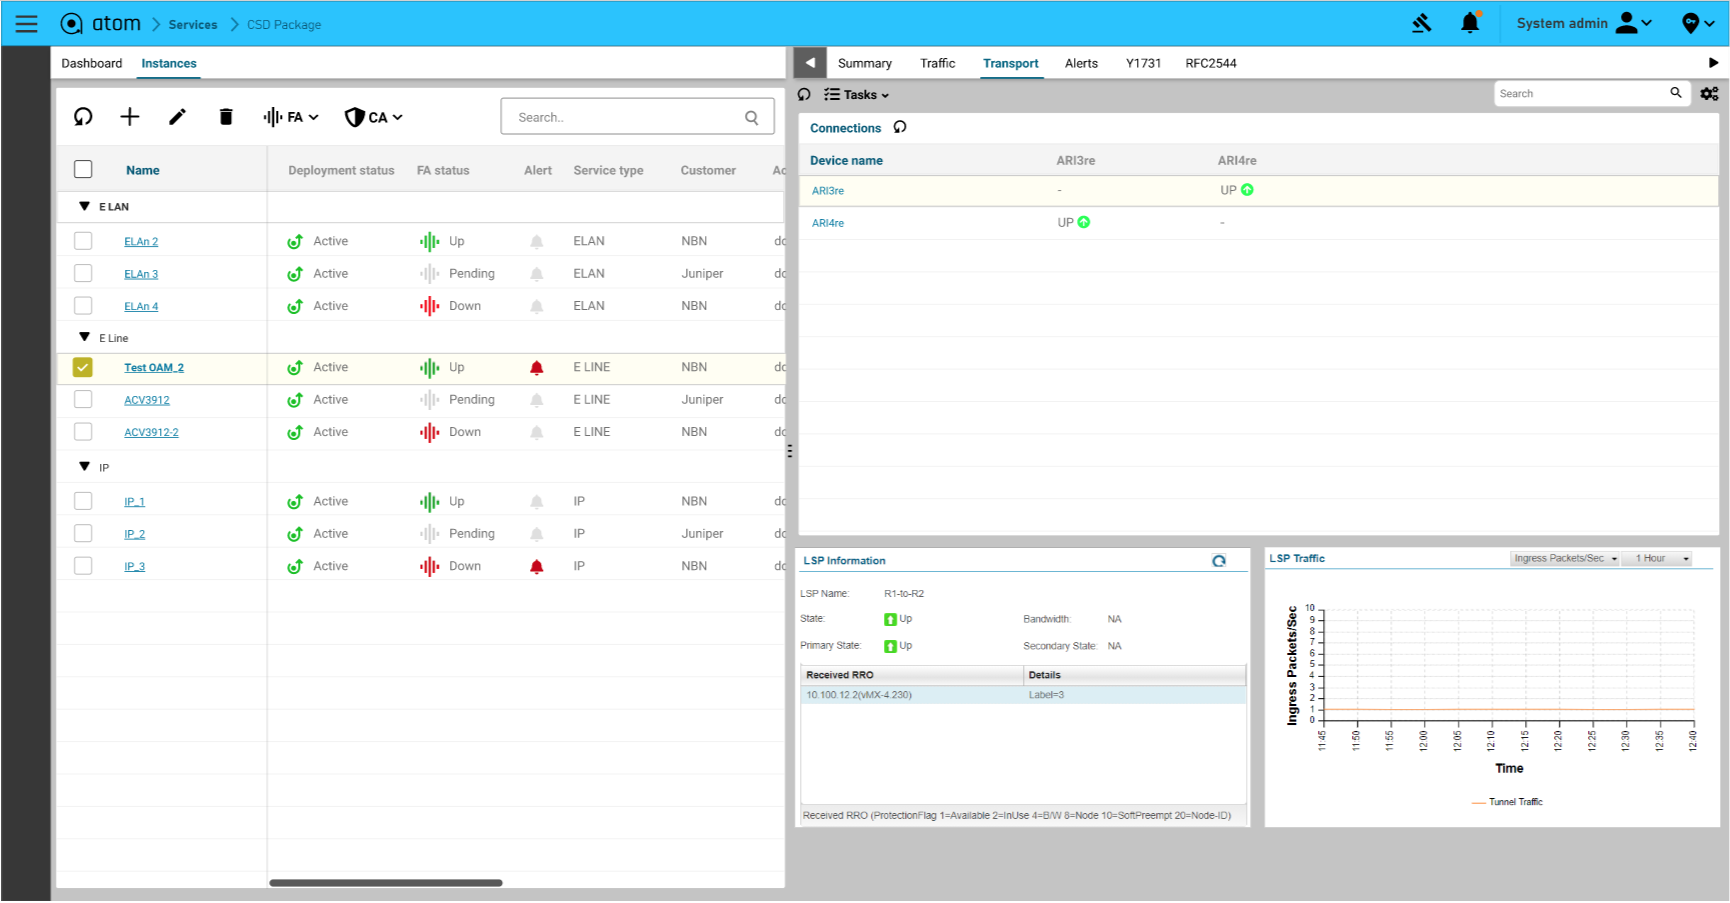
Transport – This tab displays the transport or packet statistics over time between the selected source and destination devices segregated on the endpoint LSP. The source device is the row selected in the Connections widget on the Transport tab. For a destination address that contains LSP names, the corresponding LSP details, such as the name, state, and bandwidth of the LSP, are displayed in the LSP Information widget on the Transport tab. The LSP Traffic widget displays a line chart with the bytes per second (bps) or rate on the y-axis and time on the x-axis to denote the LSP bandwidth utilization in bps.
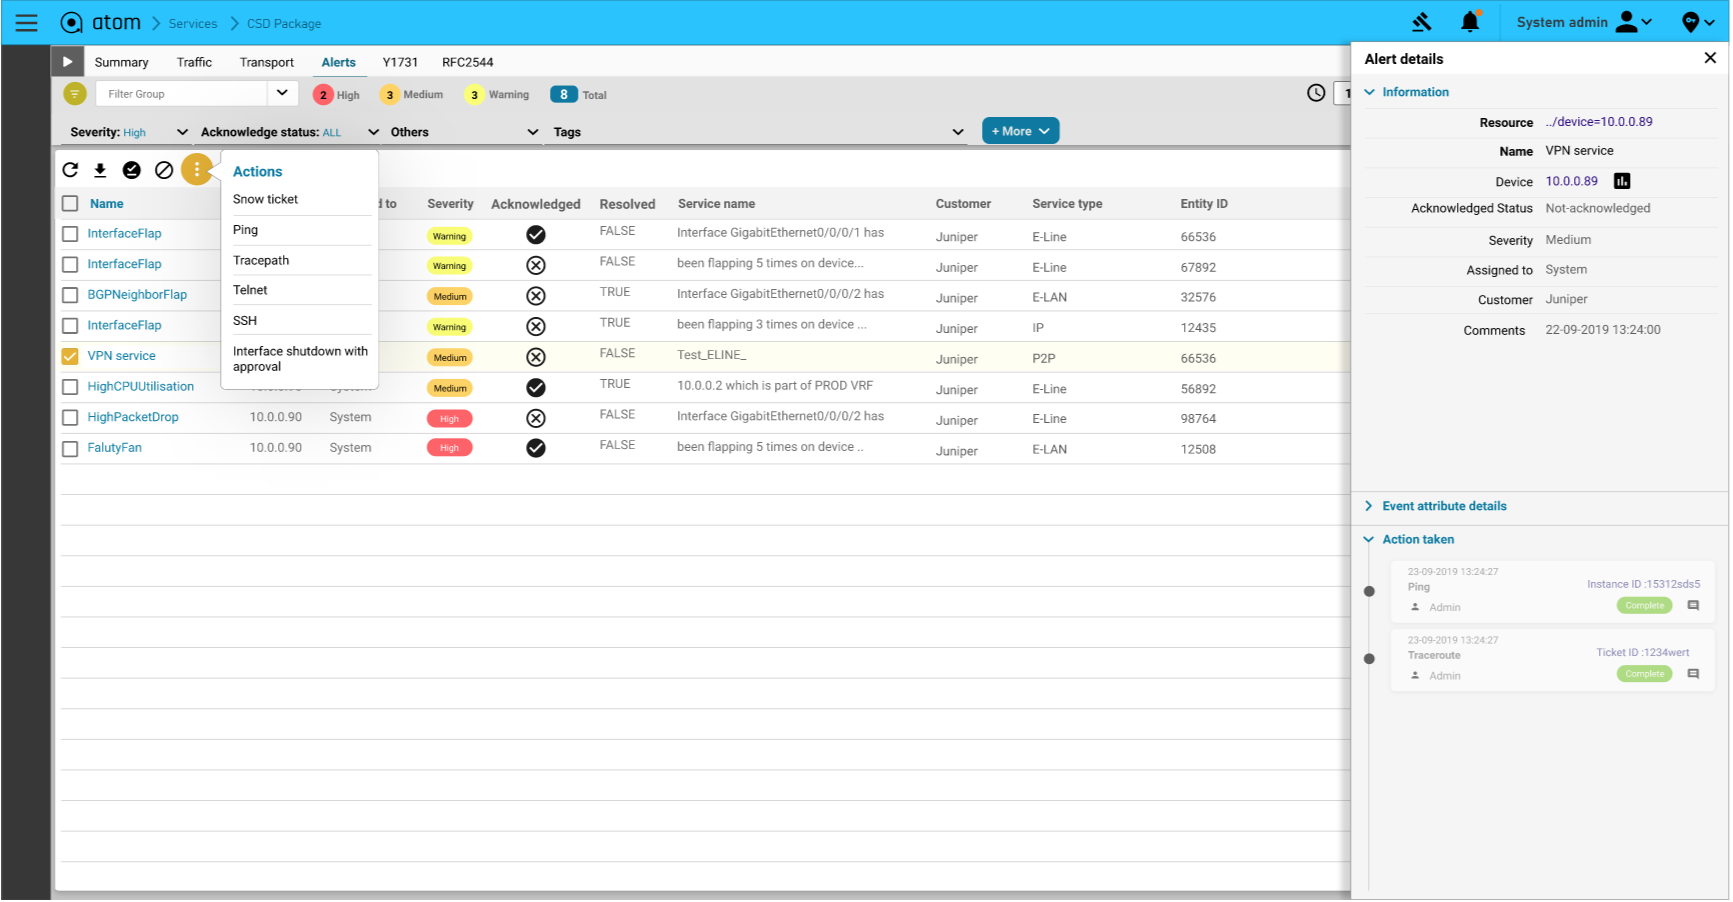
Alerts – This tab displays the alerts on devices where the service is running. One can also view the alert’s severity in different colors with acknowledged status and resolution status. The action button in this tab also provides a feature to open a ServiceNow ticket for active alerts, checks the reachability using ping, traces the path, performs an SSH/Telnet to the device, and executes remedial actions. This feature is beneficial to troubleshoot and quickly fix an issue in a production network.
Y1731 – This tab displays frame delay, frame loss, frame delay variation, and service availability. These measurements are achieved by triggering a one-way delay, two-way delay, or loss.
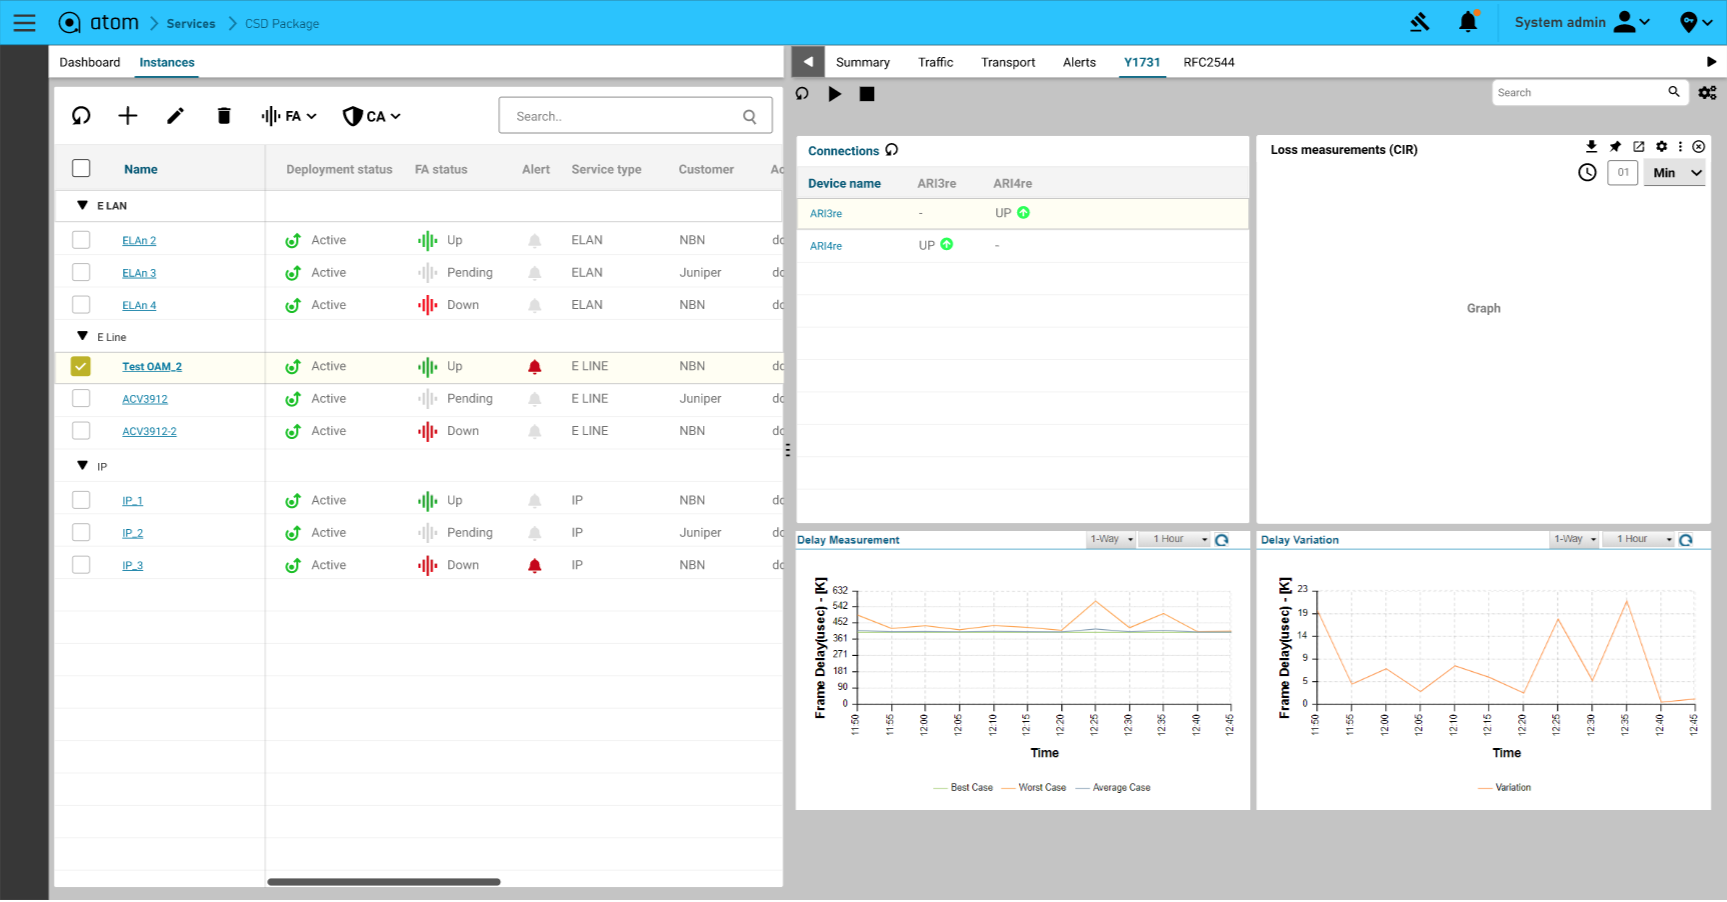
The Y1731 performance measurement helps generate periodic service-level agreement conformance reports from the deployed network by studying traffic patterns in the network over a period of time. In proactive mode, SLA measurements are triggered by an iterative application.
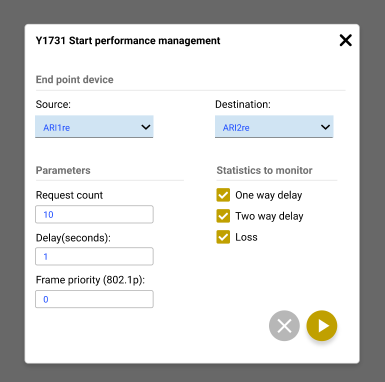
An iterator is designed to periodically transmit SLA measurement packets in the form of ITU-Y.1731-compliant frames for two-way delay measurement or loss measurement for each of the connections registered to it. Iterators ensure that measurement cycles do not coincide for the same connection to avoid a CPU overload. The iterator profiles are configured on remote MEP for measurement of Ethernet frame delay (ETH-DM), Ethernet frame loss (ETH-LM), and statistical frame loss (SFL).
RFC2544 – This tab displays the results of Throughput, Latency, Frame Loss Rate, Back-to-Back Frames, and other similar tests to describe the performance characteristics of interconnecting network devices. One can create a test defined in RFC2544 and run the test on the device using the play button. RFC 2544 tests are performed by transmitting test packets from ATOM that function as the generator or the initiator. These packets are sent to a device that serves as the reflector, receiving and returning the packets to ATOM.
ATOM’s flexible architecture allows organizations to start small and grow big. The ability to scale and distribute individual components enables administrators to plan their automation and monitoring requirements quickly and precisely. Service monitoring with the performance monitoring feature discussed in this blog can be controlled and fine-tuned to specific business needs.
Complex and ever-evolving network needs require a highly scalable and customizable network automation and monitoring solution. Emerging technologies such as metro ethernet, 5G, IoT, Wi-Fi 6, and mobile edge computing only increase the complexity of these networks.
Enterprises demand solutions that can support rising business demands and provide a unified, comprehensive, and intuitive experience for IT staff. The Anuta Networks ATOM platform, given its microservices-based architecture, delivers the required scale and flexibility to meet any organization’s growing needs.


