
Latest blog post
Advanced Service Monitoring with Anuta ATOM
Service Monitoring in ATOM collects a wealth of metrics and delivers intuitive reports to monitor the service health, efficiency, capacity, and performance.
 Skip to content
 Learn how Anuta Networks instills Service & Operational agility into your networks with Anuta ATOM & ATOM Cloud – Your Next-generation Network Automation & Assurance Solutions
Learn how Anuta Networks instills Service & Operational agility into your networks with Anuta ATOM & ATOM Cloud – Your Next-generation Network Automation & Assurance Solutions
Learn how Anuta Networks instills Service & Operational agility into your networks with Anuta ATOM & ATOM Cloud – Your Next-generation Network Automation & Assurance Solutions
Learn how Anuta Networks instills Service & Operational agility into your networks with Anuta ATOM & ATOM Cloud – Your Next-generation Network Automation & Assurance Solutions
ATOM leverages data-rich insights to enhance automated business processes across multiple stages. It begins with benchmarking, defining KPIs, and creating dashboards to empower process owners. The subsequent monitoring phase uses predefined metrics for issue identification, while the analysis phase employs a versatile report builder, comprehensive filters, and specialized analysis tools for improvement insights. In the evaluation phase, the consistent performance of processes is assessed, with data aggregation into unified dashboards, enabling optimization efforts in areas with the highest potential return on investment. This systematic approach drives continuous process enhancement and user experience improvements.

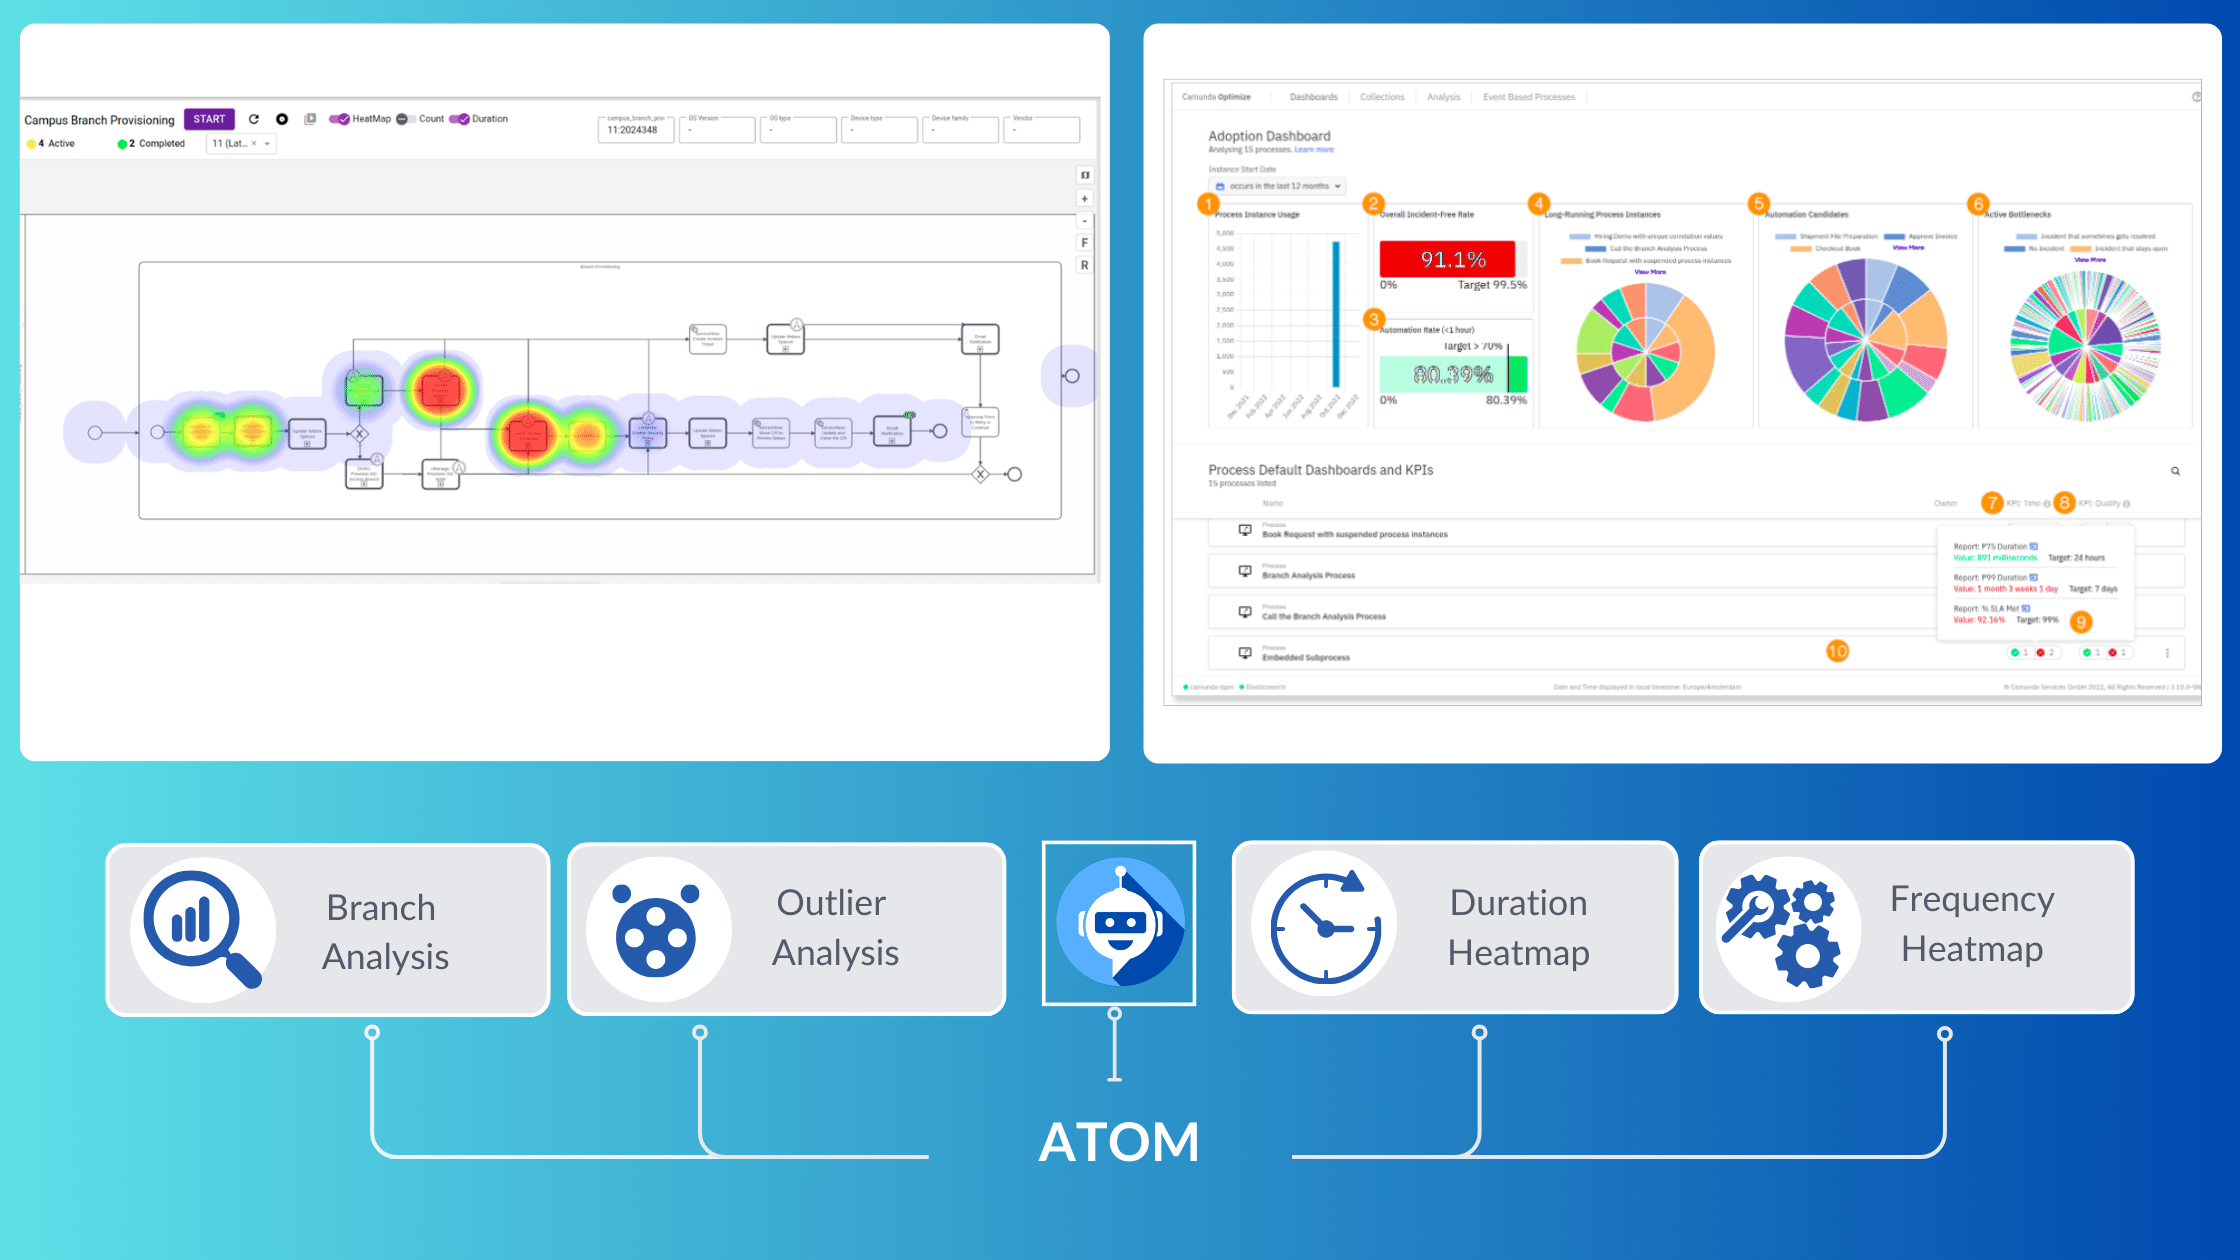

Visualize where your workflows allocate the most time, identifying areas for potential optimization.

ATOM capture and track module serial numbers, providing accurate and up-to-date records for efficient inventory management and device tracking.

Spotlight the most frequent tasks, shedding light on common activities within your processes.

Identify the most frequently traveled pathways within your processes, uncovering patterns for improvement.

Measure the time intervals between specific activities, pinpointing areas for time optimization.

ATOM offers an outlier analysis tool for identifying process instances with exceptional completion time variations. Users can access a heatmap for flow nodes, explore duration disparities, and analyze significant variable values for process optimization.

ATOM provides versatile decision reports to gain insights into decision definitions. Users can create raw data reports, evaluate decision frequency, and analyze decision elements with options for various visualizations and grouping parameters.

ATOM offers branch analysis to determine the path tokens took within a process, particularly when multiple end events exist. This feature provides statistical insights into token splitting at specific gateways and the number of tokens from each branch reaching an end event.

Examine activity duration through a histogram, spotlighting the quickest and slowest actions within your chosen time frame. This assists in identifying potential bottlenecks and performance issues.
Access a histogram, number card, or pie chart to visualize the frequency of activity execution, aiding in troubleshooting and offering insights into task patterns.

Explore activity frequency trends using a Stacked Bar Chart, categorized by daily, weekly, or monthly intervals. This visual representation provides valuable insights into task patterns over time, facilitating effective troubleshooting.
ATOM
Anuta Networks International LLC
1525 McCarthy Blvd #1020,
Milpitas, CA 95035 USA
Phone: +1 408.458.7955
Email: info@anutanetworks.com
Anuta Networks Private Limited No.134/1 & 134/2, 1st Floor, Brigade Tech Park – Block B, Pattandur Agrahara Village, K R Puram Hobli, Whitefield Road, Whitefield Bangalore KARNATAKA – 560066 INDIA
Phone: +91 7338133108