
Worldwide network operation teams are facing intense demands from both internal constituents and application owners for a flexible, secure and predictable infrastructure. Further complicating matters, operators are burdened with legacy infrastructure, broken processes, limited visibility and shrinking budgets.
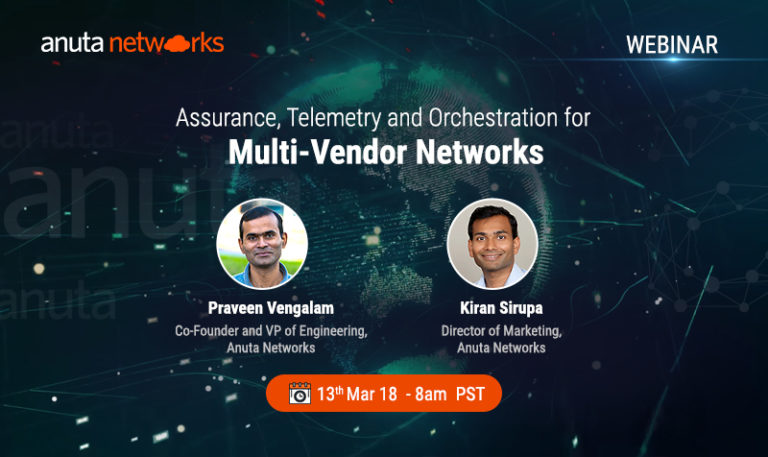
Anuta Networks announced the general availability of ATOM, a powerful Assurance, Telemetry, and Orchestration platform for Multi-Vendor Networks. In this webinar, Praveen Vengalam and Kiran Sirupa will walk through the key elements of ATOM.
- How are the new trends such as 5G, IOT, and Multi-Cloud going to impact Network operations?
- What are Anuta networks approaches to solving complex multi-vendor network orchestration and assurance challenges?
- Anuta ATOM product overview and customer use-cases
Kiran: Welcome to the Anuta Networks Webinar. I am your host Kiran Sirupa, Director of Marketing.I am supported by our VP of Engineering Praveen Vengalam,Praveen can you introduce to the audience?
Kiran: 00:00 Welcome to the Anuta Networks Webinar. I am your host Kiran Sirupa, Director of Marketing. I am supported by our VP of Engineering Praveen Vengalam, Praveen can you introduce to the audience?
Praveen: 00:08 Hi, everyone I am Praveen Vengalam VP of Engineering, Anuta Networks.
Kiran: We are witnessing a rapid change in technology trends like 5G, IOT, Multi-cloud that’s going to put tremendous pressure on the networking. You will have a lot more devices generating a lot more data and you need to take immediate actions whether to keep up with the business demands as well as to protect from all the security threats that are out there. And all of this requires a radical shift in the way of doing networking, we can no longer think of networking as a siloed department in a big IT infrastructure. Networking has to catch up with the various develop movement that’s happening in the industry.
If you look at the business challenges business requires agility and self-service, but the network deployments are getting complex day by day. You have multi-vendor equipment and the networking spans across multiple domains and that the scale is continuously increasing mainly because of the IOT and mobile devices and at the same time business has to cater to existing infrastructure, whether it’s brownfield or greenfield deployments with a shift towards a public cloud and to make it more challenging, the future is going to be multi-cloud. Now, all of this complexity requires a next level of thinking on top of all of this infrastructure, you have a variety of technical challenges.
The data that you are dealing with is no longer unstructured data, there are some structured data as well and there is tons of streaming telemetry that’s coming from this infrastructure. This there is a demand for infinite scale on the network and the network has to heal itself you can no longer have humans doing their magic to implement all kinds of Band-Aids in the network and performance and security are going to be critical in a hyper-connected world, for all of these technical challenges you need the latest technologies.
Anuta’s ATOM platform is leveraging the latest technologies in microservices as well as orchestration and assurance and it provides a closed-loop automation with real-time telemetry and analytics so that you can provide an intent-driven network service delivery for a multi-domain network. Let’s look at what we mean by closed-loop automation through one example, here we are looking at a BGP neighbor flap scenario first, the collection engine which is part of the ATOM software collects telemetry data from the various routers it uses model-driven telemetry. So it can pinpoint exactly what it needs to the router and the router will send periodic telemetry data you no longer have to depend on polling mechanisms like SNMP and once you collect this streaming telemetry data the ATOM correlation engine will apply various conditions.
So depending upon the severity of the issue, some of the conditions could be simply raising an alarm or opening up a ticket for manual interventions. However, if the condition is a lot more serious and you see a lot more flat things happening, then you can have some automatic remediation’s based on a particular policy that you define. So in a closed-loop system, you are introducing automation, so that any difficult situations can be corrected automatically. Now, similar scenario can apply to a LAN traffic, in this scenario we have a WAN network and depending upon the stability of the WAN network you are taking corrective actions for example, you can read out a traffic by looking at the interface utilization as well as the redundancy protocols and based on some of your pre-configured rules. The atom platform can take corrective actions to ensure the customer SLAs. So this sort of closed-loop automation is very new to networking, this requires a change of thinking and you need to rely more on automation and yet you need to have full control and visibility into the infrastructure that’s the sort of challenges that ATOM is trying to solve using this new platform.
Kiran: 05:42 Praveen feel free to jump in if you would like to clarify on this particular use case.
Praveen: 05:56 Sure Kiran. I think we can take some of the things at the end. We are good for now.
Kiran: 05:58 So, here is a functional architecture of the ATOM platform how you can view it in your infrastructure everything in the blue box represents the ATOM platform. It can work with your existing infrastructure whether it’s physical or virtual which may be providing structured or unstructured data and it can be deployed in clouds such as AWS, Google Cloud or Azure and it can also orchestrate workloads that are in the public cloud and we use the native interfaces on these devices whether it’s CLI, SNMP, XML, API, or NETCONFs. We also interoperate with Open Config models as well as IETF YANG models and the ATOM platform uses micro services based architecture. So it can scale horizontally as per the demands.
It includes various components such as virtual appliance, lifecycle management, service orchestration, configurations CMDB as well as data normalization. ATOM includes a REST, API gateway that can be integrated with northbound portals such as OSS, BSS. ATOM also includes a self-service portal that is typically used during the development time. ATOM includes a lots of SDK So customers and partners can extend this platform and customize it for various workflows. It integrates with many third-party software including the NetFlow collectors, NMS systems path computation engines, SD-WAN Controllers and many others.
This is the software architecture of the ATOM platform it provides a presentation layer which is load balanced using the latest load balancing and it uses the Kafka distributed message buz and all the components in ATOM are deployed as micro services.
They are all deployed in Docker containers and can be deployed in public clouds such as AWS, Azure or Google Cloud and the entire micro-services are managed as part of a kubernetes cluster, ATOM includes the self-management, health management of the platform. It includes various KPI metrics That you can monitor for the health of the ATOM platform and as I said earlier it includes an SDK which simplifies most of the development work required to develop the service models and customizations. ATOM uses a time series database, so it can collect lots of event related telemetry data and it integrates with latest visualization technologies to provide the graphical functionality as well.
This is a summary of all the various functionalities in ATOM, when it comes to resource management it provides brownfield discovery, Day Zero Provisioning as well as Zero Touch Provisioning, ATOM also includes discovery functionality and it provides a single source of truth for your entire network configurations. When it comes to orchestration it uses the best-of-breed network service Orchestrator it includes the NFV MANO architecture and it can integrate with the virtual appliance lifecycle management.
ATOM includes telemetry using the model driven telemetry for all the latest platforms from Cisco Arista and Juniper and it uses Google protocol buffers to collect and store the telemetry data, you can have different varieties of sensors to collect granular information about the telemetry data on top of it ATOM has powerful analytics, you can use it to deliver query as well as time series information from your infrastructure. We are also working on integrations with machine learning partners to provide predictive analytics in a very short time.
ATOM combines the best of orchestration and assurance to provide closed loop automation here are some of the sample use cases when it comes to analytics you can you can query the single source of truth for various types of data whether it’s about the resource usage service availability as well as various anomalies in the network. similarly, you can use ATOM to implement some of the advanced closed loop automation use cases for example, as we discussed earlier whenever there is a BGP Neighbor flap, you can take corrective actions. Security threat management is another popular use case where you are defining various levels of normal behavior and using machine learning, it can detect abnormal behaviors and take corrective actions.
In NFV use case you can monitor the health of various virtual appliances whether it’s the utilization or CPU and you can instruct ATOM to take corrective actions such as scaling the VNFs automatically. Here is a quick snapshot of the atom user interface, it provides a one-stop shop for your entire infrastructure, it gives you the device health as well as service health including the compliance for various services, for operators it also includes approvals as well as any workflow related with widgets, this entire ATOM dashboard is completely customizable by the by the end customer.
So they can rearrange or add their own widgets, atom also includes the self-health management of the kubernetes cluster, you can use Grafana to visualize and build your own queries of the ATOM health status. One of the powerful features of ATOM is a powerful interface to express the business intent, in ATOM, it collects the various telemetry data from the entire infrastructure. Now, on top of it we provide a powerful query interface with which you can express the intent and we are enabling the operators and DevOps teams to build custom applications. So they can they can build their own reports create their own alert conditions as well as corrective actions this closed-loop automation improves the overall developer productivity as well as reliability of the system using ATOM you can enable predictive maintenance because the operators no longer have to learn how to do things they will only describe what the system should be doing.
ATOM includes lot of SDK support as well as libraries of queries that customers can use as well as customize for their deployments. Here is one screenshot of a simple domain-specific language query that you can write. Here it’s trying to query all the devices as well as specific VLANs that our provision on this device. This simple example can be extended further you can write all kinds of queries. you can say show me all the devices that have a specific VLAN name or show me all the devices that have interfaces in a shutdown stage like that, so you can you can express your intent using a powerful query language that makes it much easy compare to working with any YANG Models or writing Payton scripts.
And ATOM support more than 40 different vendors and it come to Orchestration and assurance using the Telemetry data. Here is the list as you can see all the leading vendors for layer two to layer seven including physical as well as virtual appliances are supported, even if a particular vendor is not supported our Anuta’s team can add support within couple of weeks. We will email this slides to you at a later point for your reference. ATOM are also integrating with many SDN controllers as well as a cloud portal for the upcoming SDN and NFV infrastructure.
Next we will go into some of the deployment of ATOM, here we talking about the available of the ATOM platform. ATOM can be deployed in a high available scenario so in this case even if you have multiple regions you can have differences instances of ATOM for each region. However this ATOM deployed in a high availability cluster, so even if a particular region is down the rest of the ATOM platform can take care of inter region equipment. So in this particular scenario even if the region one is down and the ATOM is not functional in region one, the ATOM platform in region two can take over the network devices that are in region one.
So this gives you high availability using distributed databases, here is the footprint requirements for ATOM as I said earlier; it scales horizontally and we have tested to 50,000 devices and this architecture can grow and scale horizontally up to 1 million devices the footprint is very minimal because it’s using Docker containers and it’s minimizing the number of instances needed for a particular footprint.
So we reach the end of the presentations, the summary of ATOM is that it’s a powerful platform that provides Orchestration and Assurance for leading vendors. It scales to 1 million devices and it can use the latest technologies in streaming telemetry to collect from various devices and using the powerful domain-specific language, it gives you the ability to query the data as well as build visualization reports and introduce closed loop automation. Since the platform is built using micro services it has a very minimal footprint and it can be deployed in public clouds including AWS, Azure and Google Cloud. That concludes our presentation part of this webinar. Now, let’s see if there are any questions. You can use the Q&A panel and ask your questions and Praveen, I will respond to them.
Here is one question, is there a trial version of ATOM available? yes we have a trial version however, it’s not available on the Internet please contact us or reply to my email when I send the slides and we will set up a trial account for you. Second question is what is the pricing philosophy for ATOM? ATOM is a platform, so there is a fixed fee for the platform functionality. However, there is a variable cost which is corresponding to the deployment complexity. So we have a category based pricing based on the number of devices as well as the type of the devices and the ATOM functionality scales along with your deployment. Here is one question is the telemetry exclusively supported via GRPC? do you have plans to support NetConf notifications? Praveen would you like to answer this question?
Praveen: Yeah I’ll take that one. At this time it is a GRPC and it is model driven telemetry that we are supporting and down the line we can take a look at other aspects of notification supports from the equipment providers.
Kiran: Next question is it necessary that ATOM has to be deployed as a Docker container? or can it be deployed as a virtual appliance?
Praveen: 22:47 So the ATOM platform in very small deployments can be deployed as a virtual machine and the footprint will all be provided to you as one installable, so you can install that for small deployments. However, for larger deployments we do expect this deployment to be worked upon it is because we leverage some of the given, this Kubernetes high availability and availability capabilities.
Kiran: 23:13 Here is one more question does ATOM support telemetry from 4G and 5G RAN elements both physical and virtual functions?
Praveen: 23:34 So we don’t have support for the RAN at this time, but we are working with a few customers in this area and once we support telemetry like GRPC, TCP or UDP we will have the capability from an infrastructure point of view, it will just mean that we will have to support few more vendors with the same infrastructure. So RAN is a part of our medium-term roadmap, we can discuss that more offline.
Kiran: 24:28 It looks like that’s the end of all the questions we have, if you have any pending questions that we can wait for a couple of minutes feel free to ask us. Okay, that’s the wrap. 24:58] thank you very much for attending this webinar, thank you Praveen for answering all the questions. We will email these slides to you as well as a recording of this webinar and please feel free to follow us up on any specific technical or business questions. Once again thank you for attending have a great day!