 Skip to content
 Predictive Analytics (AIOps) for Workflow Completion
As Anuta Networks ATOM executes hundreds of workflows, it also collects many metrics and generates valuable insights such as:
- The average duration for individual process definitions or use-cases,
- Average time spent on a specific task of a particular workflow,
- Identification of the longest-running task in a process instance,
- Time spent on user tasks,
- Analysis of instances executed during a specific period and subsequent creation of a trend chart.
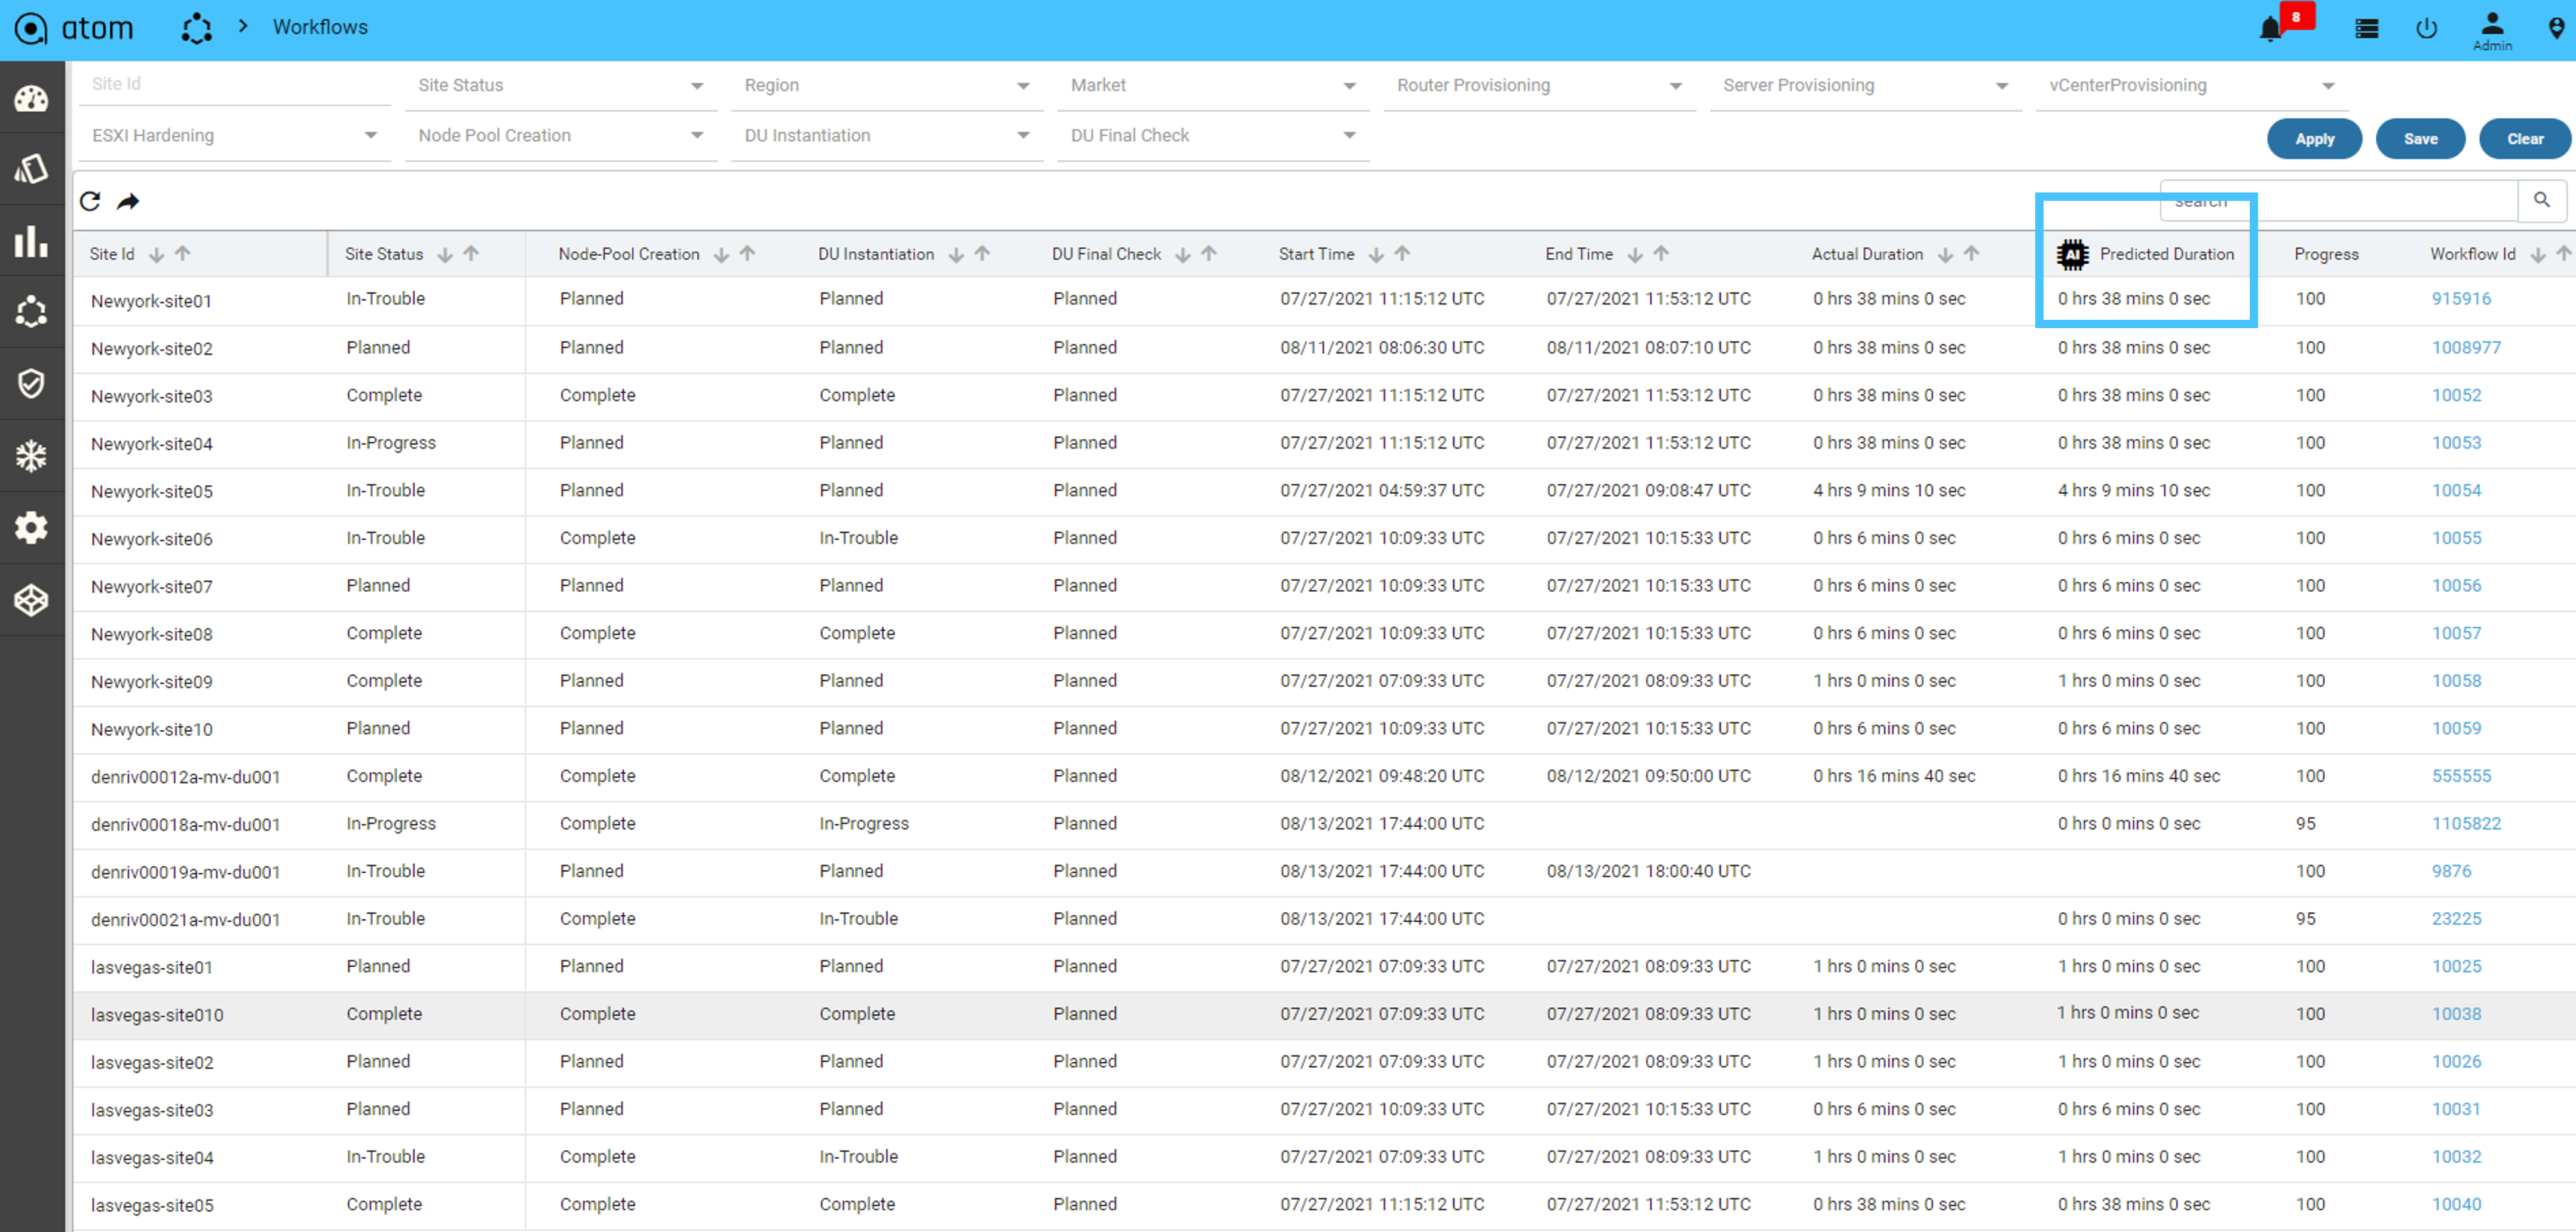
Furthermore, ATOM includes AI/ML capabilities that can predict the estimated time of a workflow completion based on the region, location, past data, and more.
One of Anuta Networks’ customers has deployed hundreds of 5G cell sites utilizing a real-time status tracker, similar to the Domino’s pizza tracker, to monitor the progress of ZTP workflows. It is now able to predict how long a cell site should take for onboarding. In case of any delay, the ZTP workflow automatically opens a ticket in JIRA for the operator to intervene.
Anomaly and Outlier Detection
Anuta Networks ATOM leverages anomaly detection and outlier detection to improve workflow executions. Let’s take a deeper look at these two close but different capabilities.
Anomaly Detection
Some of the most valuable monitoring metrics are also the most variable. Application throughput, web requests, user logins, CPU utilization, and memory utilization are all critical, top-level metrics that tend to have pronounced peaks and valleys based on the time of day or the day of the week. Consequently, these fluctuations make it very hard to set sensible thresholds for alerting or investigation.
By analyzing a metric’s historical behavior, anomaly detection distinguishes between normal and abnormal metric trends.
For example, a throughput metric peaks during business hours each weekday, when application usage is highest, drops to a local minimum at night, and falls to a prolonged lull on the weekend. Because that pattern repeats week after week, the anomaly detection algorithm can accurately forecast the metric’s value, peaks, and lulls. Plummeting throughput is a severe issue, but it’s often impossible to set threshold alerts to identify its occurrence.
Anomaly detection can address the challenge by separating the trend component from the seasonal component of a time series to track metrics that are trending steadily upward or downward.
Anuta Networks ATOM analyzes the historical trends for workflow execution times, detects anomalies, and provides the necessary context to the workflow developer for further investigation.
Outlier Detection
For many metrics, it is a nontrivial exercise to pre-define what constitutes “normal” versus “abnormal” values – especially for metrics whose baseline value fluctuates over time. Outlier detection can be used in these instances to trigger an alert when a workflow starts reporting errors at an abnormal rate. Network operators can also quickly identify whether delays are attributable to a slow region or team without having to choose a fixed threshold for what constitutes “anomalous” metrics.
Anuta Networks ATOM also runs a statistical analysis in real-time on all workflows to determine the baseline and assess whether any workflows deviate significantly from that baseline.
For example, when the same ATOM ZTP workflow is executed in multiple regions to onboard cell-site routers, as mentioned in the previous example, ATOM can detect the regions, cities, and locations where the onboarding process is particularly delayed. The issue may be due to a slow network, lack of computing resources, or other challenges. To address an issue, ATOM can identify either resource-heavy or time-consuming sub-workflows and make recommendations for further optimization.