 Skip to content

Introduction
The quest for efficiency, transparency, and data-driven decision-making has never been more critical. Nowadays, organizations rely heavily on automation to streamline their processes, reduce manual workloads, and ensure that network operations run seamlessly. However, the real challenge lies in automating tasks and understanding how well these processes perform. This is where Workflow Monitoring, Reporting, and Optimization become indispensable. They are the cornerstones of success, allowing network administrators to fine-tune their systems for optimal performance.
In this blog, we delve into the world of Anuta ATOM, a powerful tool designed to simplify and supercharge your workflow reporting and optimization efforts. As we explore the inner workings of ATOM and learn how it can transform your network administration experience, we’ll uncover the challenges faced by network administrators, understand the complexities of traditional reporting tools, and then discover how ATOM’s innovative no-code approach is revolutionizing the field. We’ll also explore ATOM’s features, advantages, and real-world applications, offering insights into how it can elevate your Network management to new heights.
Critical Elements of Workflow Reporting and Optimization
Workflow Reporting and Optimization involves a series of critical steps—benchmarking, monitoring, analyzing, and evaluating the performance of automation processes. Through this systematic approach, administrators can fine-tune and enhance the efficiency and decision-making capabilities of their networks.
- Benchmarking: Define Key Performance Indicators (KPIs) to gauge the most essential aspects of your processes. It involves creating and distributing dashboards to process owners, empowering them to investigate and identify areas for enhancement.
- Monitoring: Employ predefined metrics to underscore potential issues that demand attention to uphold top-notch user experiences.
- Analyze: Discover valuable information with the versatile report builder. Comprehensive filters, BPMN heatmaps, and specialized branch and outlier analysis tools empower you to pinpoint areas with potential for improvement.
- Evaluate: Assess the consistent performance of a process over an extended period. It’s possible to aggregate data from multiple processes into a unified dashboard for comprehensive evaluation.
- Focus: Acquire a holistic view of process status with a quick glance, enabling you to concentrate your optimization efforts on areas that offer the highest potential for return on investment.
Challenges in Implementation
Bringing workflow reports and optimization tools to life traditionally involves a demanding set of requirements, presenting network administrators with a series of hurdles:
- Time and Resource Constraints: Developing on-demand reporting solutions can be time-consuming and resource-intensive, diverting attention from core network administration tasks.
- Complexity: Traditional reporting tools often come with a steep learning curve, making it difficult for non-technical users to generate meaningful reports.
- Inflexibility: Custom-coded solutions may not adapt well to evolving network needs, leading to constant maintenance and updates.
- Cost: Building and maintaining in-house solutions can be expensive, with hidden costs associated with support and troubleshooting.
Imperative of Overcoming Challenges
The need to address the challenges above has become an absolute necessity as Network administrators perform a diverse range of tasks, all with the overarching goal of ensuring robust workflow reporting and optimization. As mentioned below, these tasks have evolved into a strategic imperative, as they underpin the foundation of a smoothly operating network.
- Monitoring Workflow Status: Consistently monitor the status of ongoing workflows, swiftly identify errors, and ensure the seamless operation of processes.
- User Task Management: Efficiently manage user tasks, from assignment to completion, to ensure no critical task gets lost in the workflow.
- Service Level Agreement (SLA) Compliance: Meet SLAs and can track compliance.
- Analyzing Workflow Trends: Understand trends, such as the fastest and slowest instances, for continuous improvement.
- Out-of-box Reporting: Demand out-of-box reports based on specific parameters when unique reporting requirements emerge,
Resolving the Unresolved- How ATOM Makes It Possible:
The ATOM platform offers an innovative solution to these challenges with its no-code approach to workflow reporting and optimization. It provides a range of inbuilt reports and customizable options that empower network administrators and end-users. Here’s how ATOM tackles the challenges:
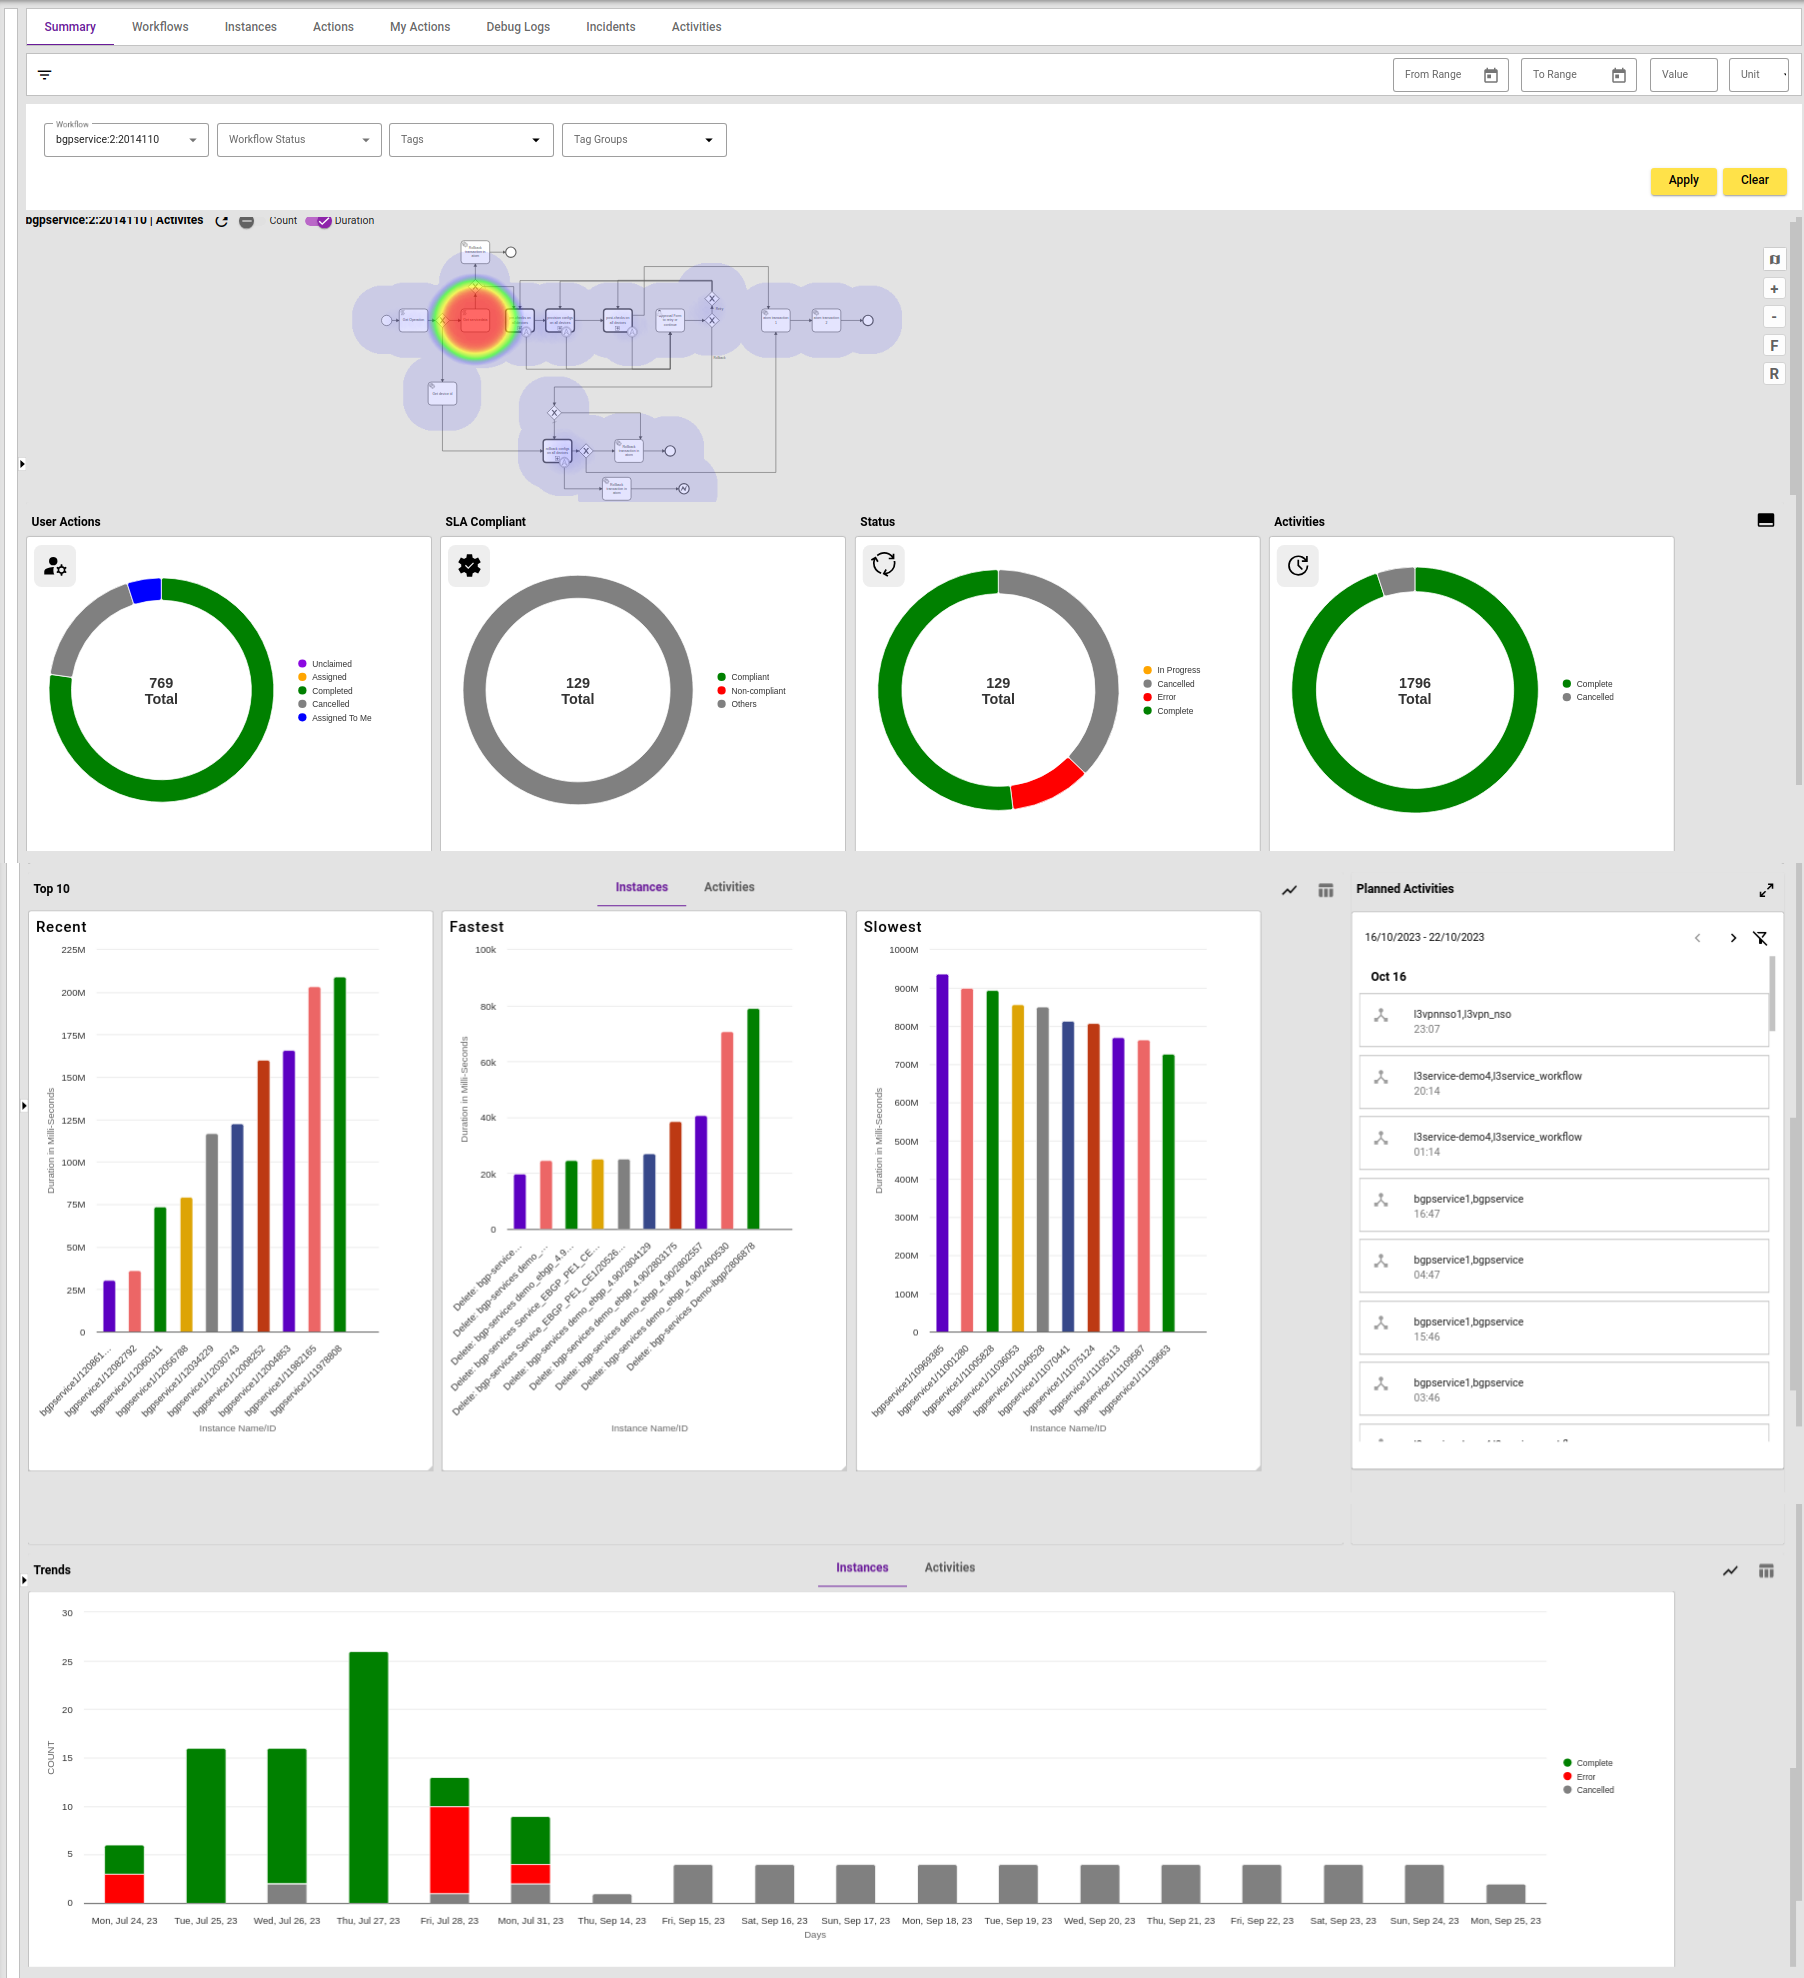
1. Inbuilt Reports:
- Workflow Status: Keep a real-time pulse on your workflows – from ongoing tasks to completed projects.
- State of User Tasks: Efficiently manage user tasks, monitoring their progression from assignment to completion.
- Activities Status: Stay in control of all activities – those in progress, completed, or canceled.
- SLA Status: Ensure your Service Level Agreements (SLAs) are consistently met and compliance maintained.
- Instances and Activities Trends: Uncover valuable insights by analyzing trends in recent, fastest, and slowest instances and activities.
All these reports offer the flexibility to be filtered by workflow type and tags or tag groups, allowing you to narrow your focus to specific aspects of your network.
2. Performance & Optimization Reports
- Duration HeatMap: Visualize where your workflows allocate the most time, identifying areas for potential optimization.
- Frequency HeatMap: Spotlight the most frequent tasks, shedding light on common activities within your processes.
- Status HeatMap: Gain quick insights by visualizing each activity’s pass and fail counts, enabling efficient problem detection.
- Branch Analysis: Identify the most frequently traveled pathways within your processes, uncovering patterns for improvement.
- Duration Analysis: Measure the time intervals between specific activities, pinpointing areas for time optimization.
Users can create many other reports to monitor workflow progress with a wide range of filters and options in each category:
3.Instances Reports:
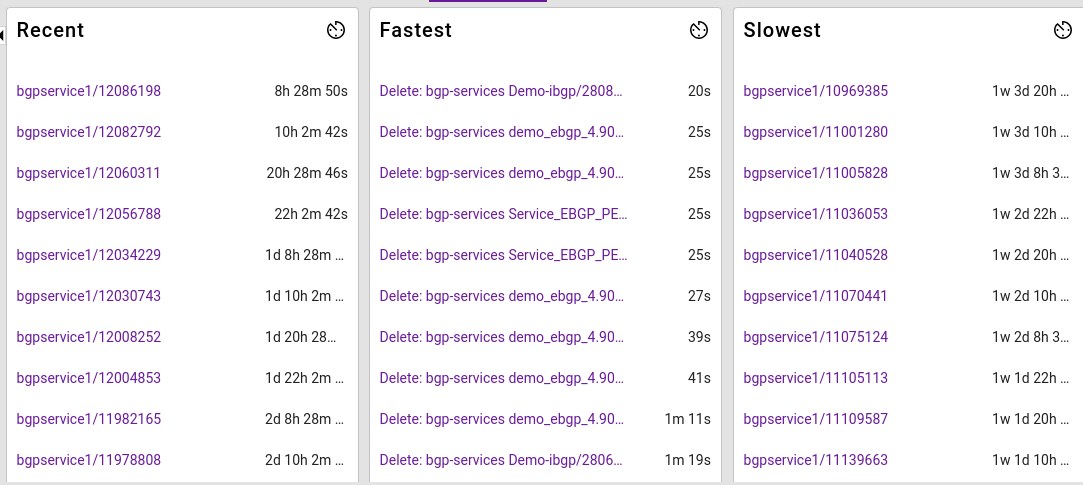
- Workflow Timeline: View a histogram that displays the duration of recent, fastest, and slowest instances in your chosen time unit, providing a visual representation of workflow performance over time.
- Business Status Summary: Keep tabs on the status of workflows, whether they are actively in progress, canceled, have encountered errors, or have been completed.
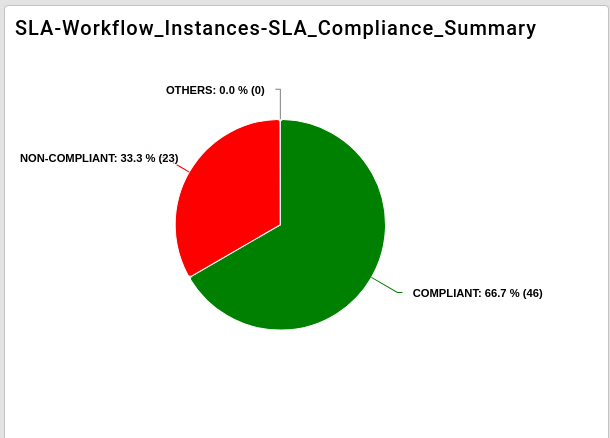
- SLA Compliance Summary: Monitor the compliance of your workflows with defined Service Level Agreements (SLAs), offering a clear understanding of which workflows meet these commitments.
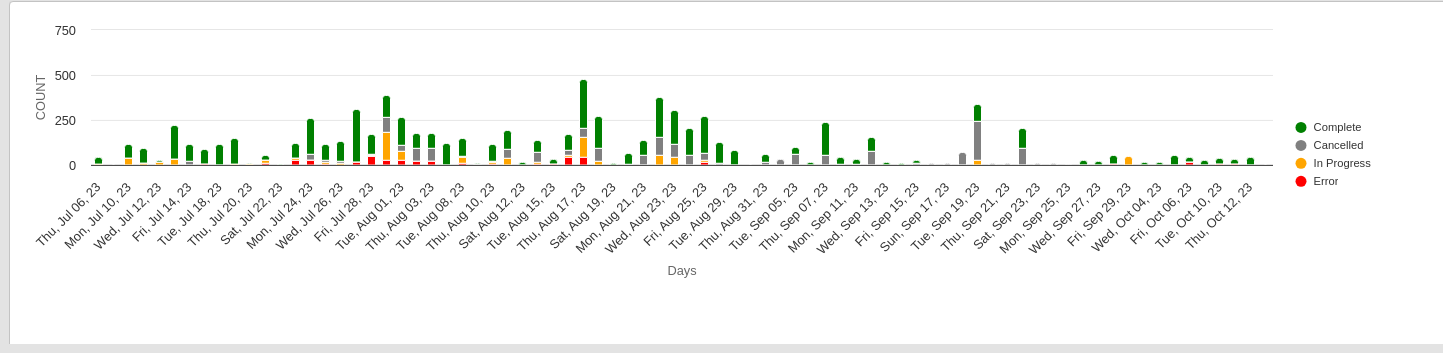
- Trend of Business Status Summary: Explore trends in business status data, displayed in a Stacked Bar Chart format and grouped by daily, weekly, or monthly intervals, providing valuable insights into workflow performance trends over time.
- Trend of SLA Compliance Summary: Track trends in SLA compliance data with a Stacked Bar Chart that organizes the information into daily, weekly, or monthly groupings, offering a comprehensive view of SLA adherence over time.
4.User Tasks Reports:
- User-Task Status Summary: Keep a comprehensive watch on the status of user tasks, encompassing unclaimed, assigned, completed, and canceled states.
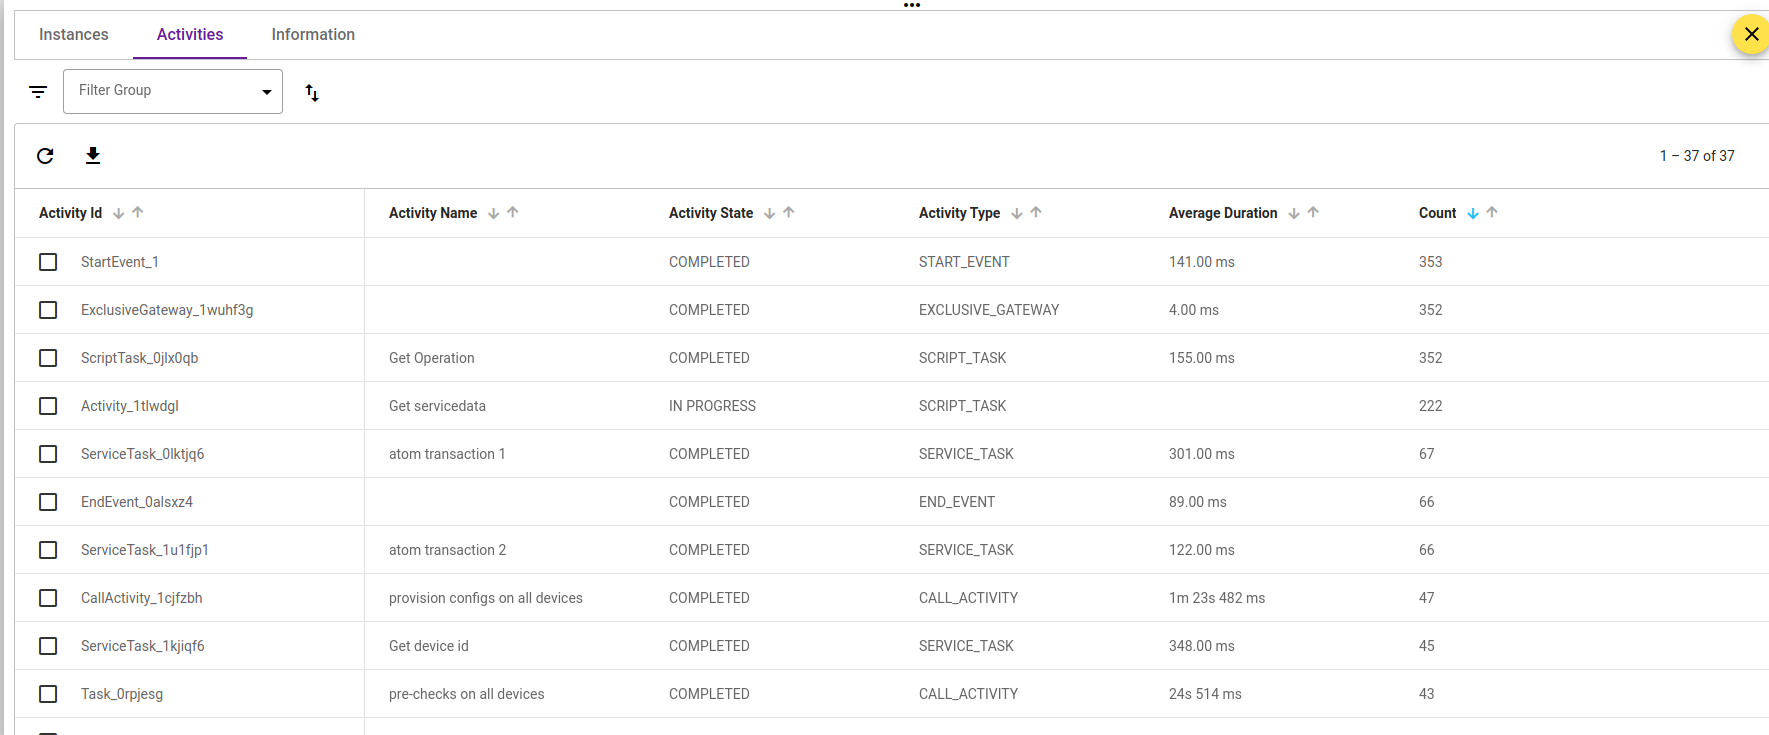
5. Activities Reports:
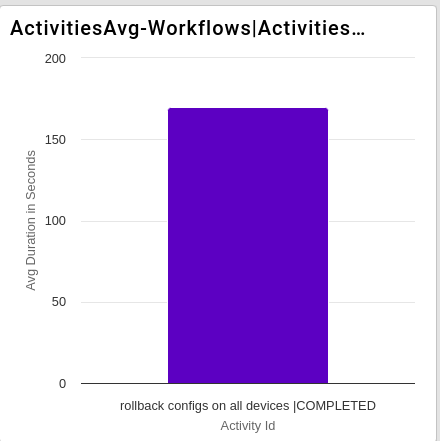
- Activity Average Duration: View a histogram displaying the speed of activities, highlighting the fastest and slowest actions based on the selected time unit.
- Activity Count Summary: Access a histogram, number card, or pie chart that illustrates the frequency of activity execution, offering a clear overview of task occurrence.
- Trend of Activity Count Summary: Explore trends in activity frequencies through a Stacked Bar Chart, categorized by daily, weekly, or monthly intervals, providing valuable insights into task patterns over time.
Customizable Filters for Tailored Reporting
The workflow reports provide a versatile range of filters that can be applied, including Workflow ID, StartedBefore, StartedAfter, FinishedAfter, FinishedBefore, Status, Variables, and various other options. These filters can be tailored to meet the specific requirements of each report, ensuring that you obtain precisely the information you need.
Transforming Network Administration with ATOM's Advanced Reporting and Optimization
ATOM’s reporting and optimization features offer a multitude of advantages, including:
- Tracking the number of process instances executed over time.
Every organization encounters cyclical patterns that can impact the efficiency of its processes. Grasping these fluctuations equips you with the insight to discern when to allocate additional resources or streamline your operations.
The Workflow Optimizer empowers you to efficiently produce reports that evaluate the number of process instances executed under a predefined set of customized criteria. This is visually represented through a Stacked Bar Chart, providing a concise summary of business statuses from instance reports segmented by daily, weekly, or monthly intervals.
2. Identifying frequently executed steps in a process.
Identifying bottlenecks within complex workflows is challenging due to numerous potential slowdown points. However, tools such as the Activity Grid or Count Report are instrumental in pinpointing these constraints. By analyzing the frequency of flow node executions, they unveil which process steps are the most frequently executed, facilitating targeted optimization.
3. Finding the slowest workflows to finish.
Process administrators seek insights into workflow durations influenced by various process factors. By leveraging the workflow timeline report, you can categorize process instance timeframes, distinguishing the slowest, fastest, or most recent instances for a comprehensive understanding.
4. Analyzing time spent on specific tasks.
Channeling your optimization efforts towards individual tasks or sets of tasks sharpens your ability to pinpoint areas for refinement. The ‘Duration Analysis Report’ allows you to assess key metrics, including the minimum, maximum, median, and average duration of a sequence of tasks within your workflow, shedding light on potential constraints. The Activities-Grid within the workflow view provides a detailed breakdown of these figures. Additionally, you can create a dashlet using ‘Activity Average Duration’ for streamlined monitoring and analysis.
5. Determining the duration of the longest process instance part.
It is sometimes beneficial to focus your optimization efforts on a specific phase within a complex, extensive process.
In addition to examining key duration metrics for end-to-end processes, including the minimum, maximum, median, and average durations, you can zoom in on a particular segment of the process. This approach offers a deeper insight into its performance and enables initiating strategies for improvement.
6. Monitoring User Task instances that take longer than usual.
Identifying specific tasks that deviate significantly from expected timeframes is essential for more efficient prioritization of actions aimed at process improvement. The duration heatmap for particular activities aids users in identifying these tasks. Additionally, Optimize goes a step further by enabling root-cause analysis, highlighting outliers for specific instances.
7. Is our team executing the process at the desired pace, or do they require more time than initially anticipated?
You can predefine SLA values along with a workflow or customize it in the instances tab to determine how many instances are compliant. You can also use the ‘SLA Status Summary report’ to get an idea of this aspect.
These features empower network administrators to make data-driven decisions, optimize processes, and enhance overall network performance.
Conclusion
ATOM’s workflow reporting and optimization revolutionizes how network administrators and users manage their networks. ATOM offers a powerful solution to common network challenges by providing inbuilt and customizable reports. Its user-friendly interface bridges the gap between technical and non-technical users, empowering them to make informed decisions and drive network efficiency. By adopting ATOM, network administrators can take their workflow management to the next level, improving processes and ultimately achieving their network goals.
Get in touch with us to book a live Demo!


