 Skip to content

Introduction
In our previous blog post, we explored how Anuta Networks’ ATOM, a vendor-agnostic platform, executed zero-touch provisioning (ZTP) with extensible workflows that enabled parallel cell-site provisioning at scale for a Fortune 500 company in the United States.
A 5G deployment leveraging O-RAN technology is a complex, multi-vendor implementation that requires robust automation mechanisms to detect, notify, and resolve errors. Let’s explore how ATOM’s cross-domain automation provides solutions to meet the unique requirements of the customer.
ATOM- enabling cross-domain automation for hybrid cloud
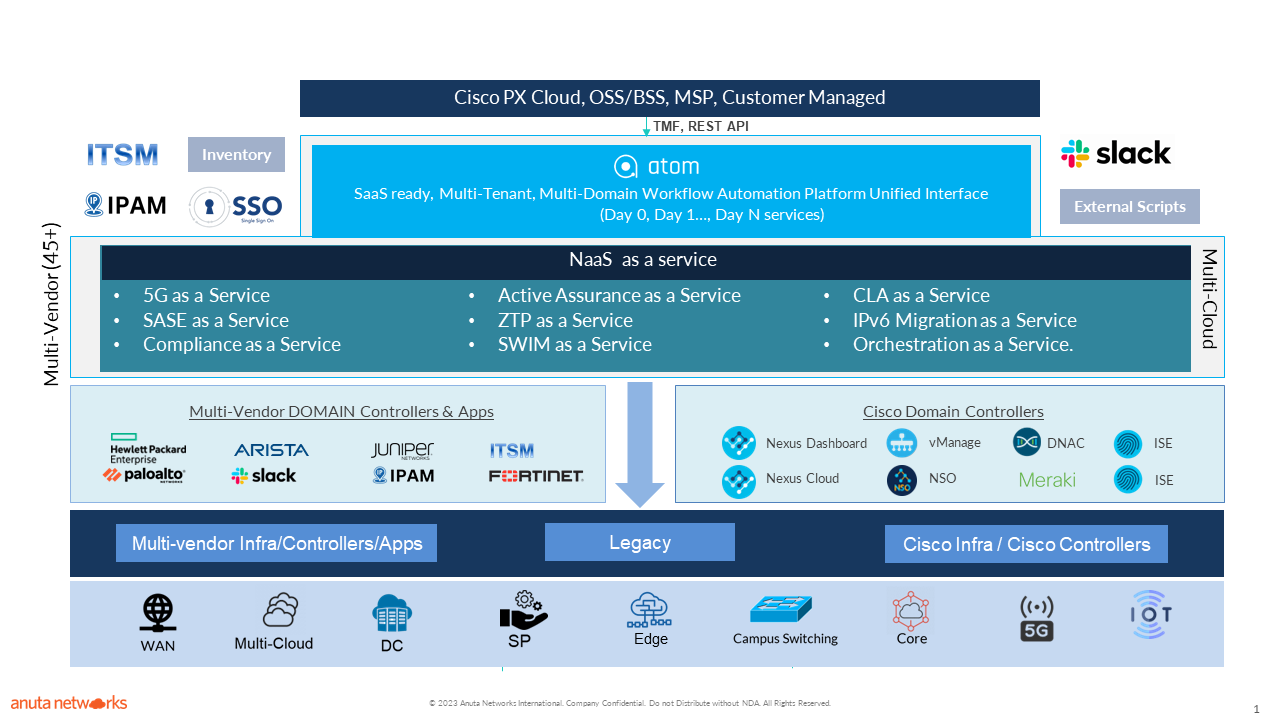
ATOM’s cross-domain automation solutions are not limited to 5G and ZTP but also encompass a variety of other services, such as Active Assurance, CLA, SASE, and Compliance, among others. ATOM delivers XaaS (anything-as-a-service) for MSPs (Managed Service Providers), MSSPs (Managed Security Service Providers), and large enterprises.
In this blog post, we will explore how ATOM plays a pivotal role in facilitating the overall integration process for this Tier-1 Telco customer, enabling them to understand their network performance and ensure the fastest rollout. We will highlight how ATOM’s alert generation, closed-loop automation, comprehensive KPI monitoring, and reporting reduced manual intervention to enhance customer experience.
ATOM- a single source of truth
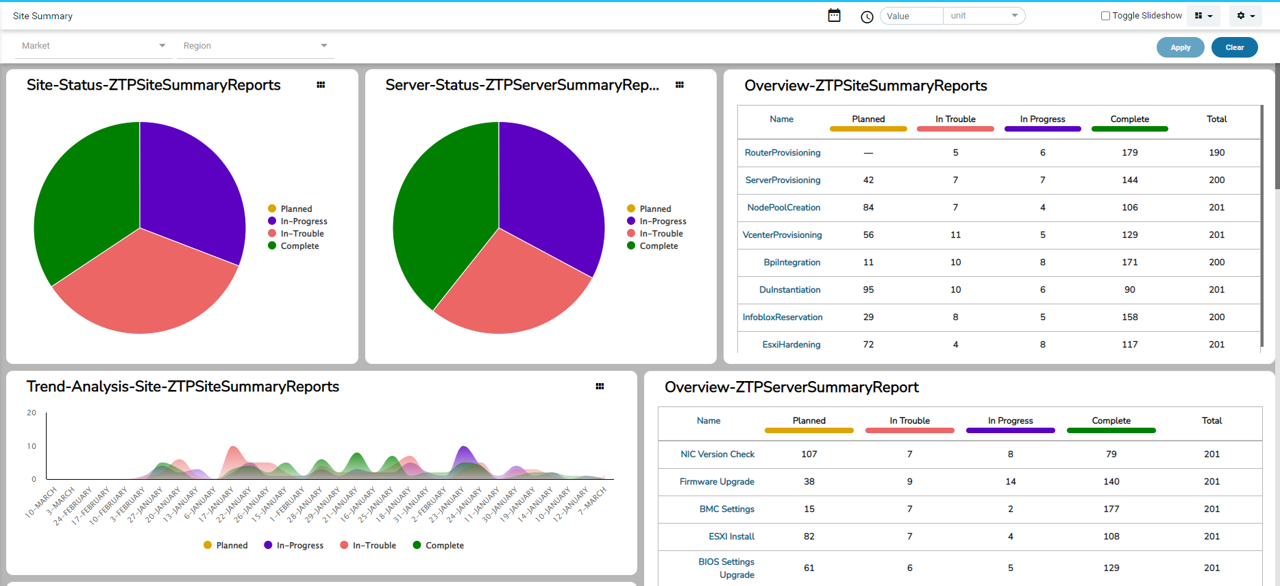
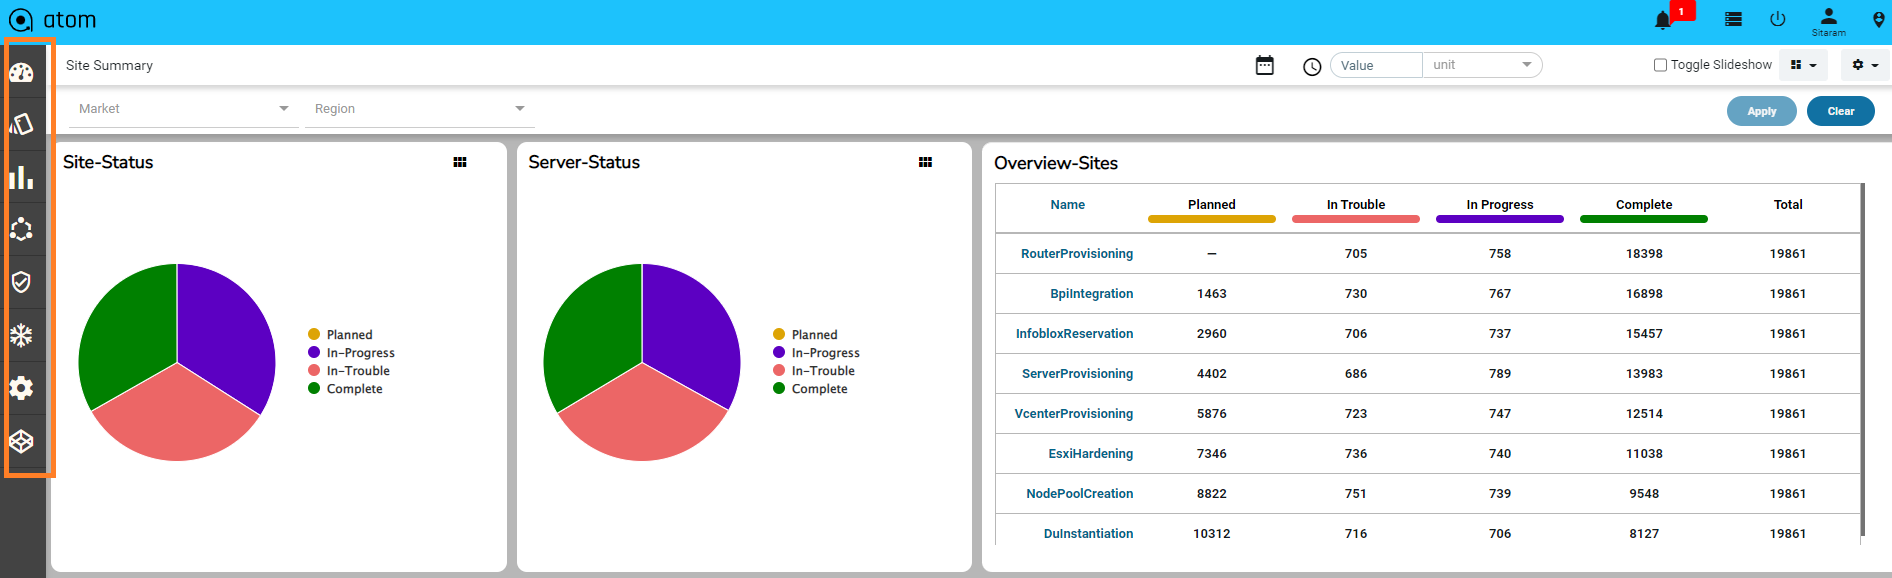
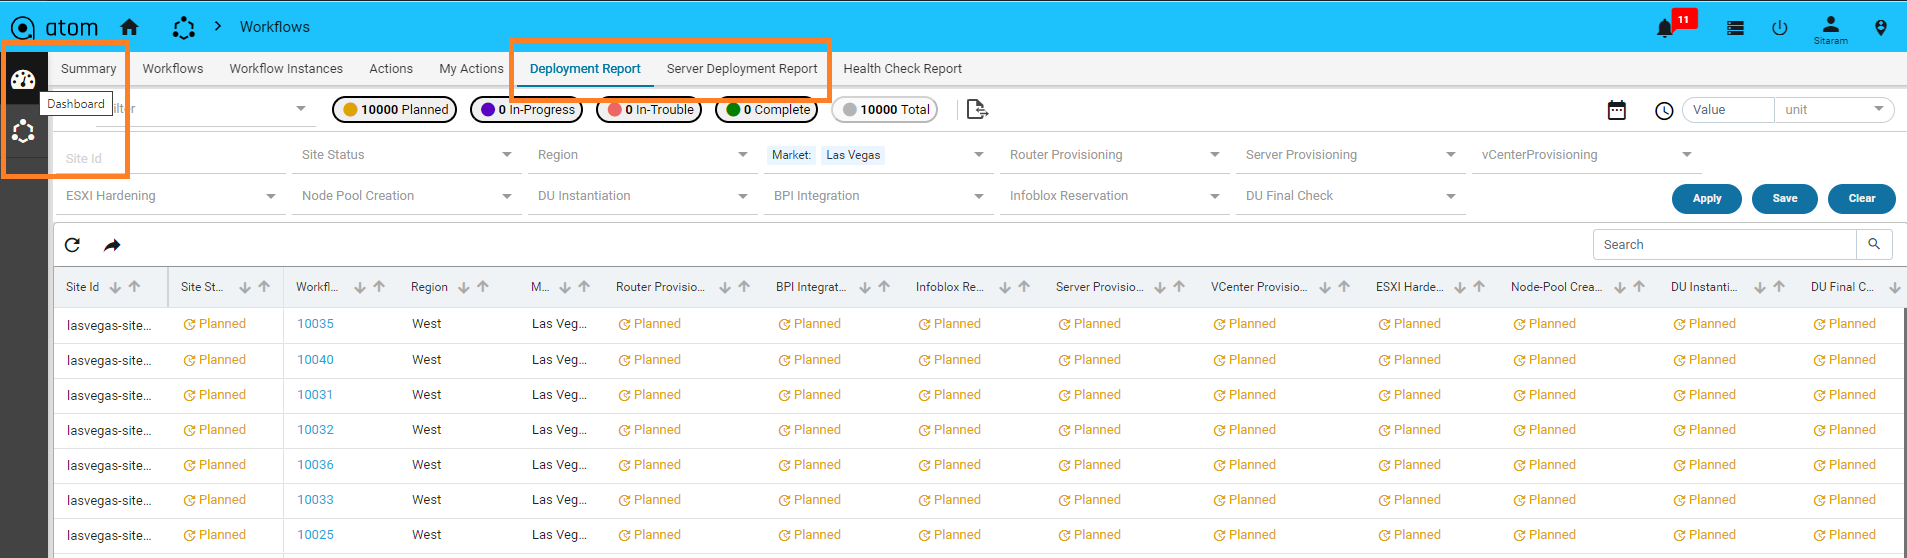
One of ATOM’s key features is its deployment reports and customizable dashboards that provide valuable insights for different user groups, such as market managers, network operators, and server administrators. These detailed reports offer real-time statistics for devices, platforms, regions, routing protocols, and interfaces, enabling quick issue identification and automated remediation.
Deployment Reports
ATOM provides two types of deployment reports – one for tracking the stages of cell-site provisioning and another for tracking different stages of bare metal server provisioning. Although bare metal servers are part of the overall cell-site provisioning process in this example, the complexity requires a separate report.
These deployment reports contain helpful information such as–
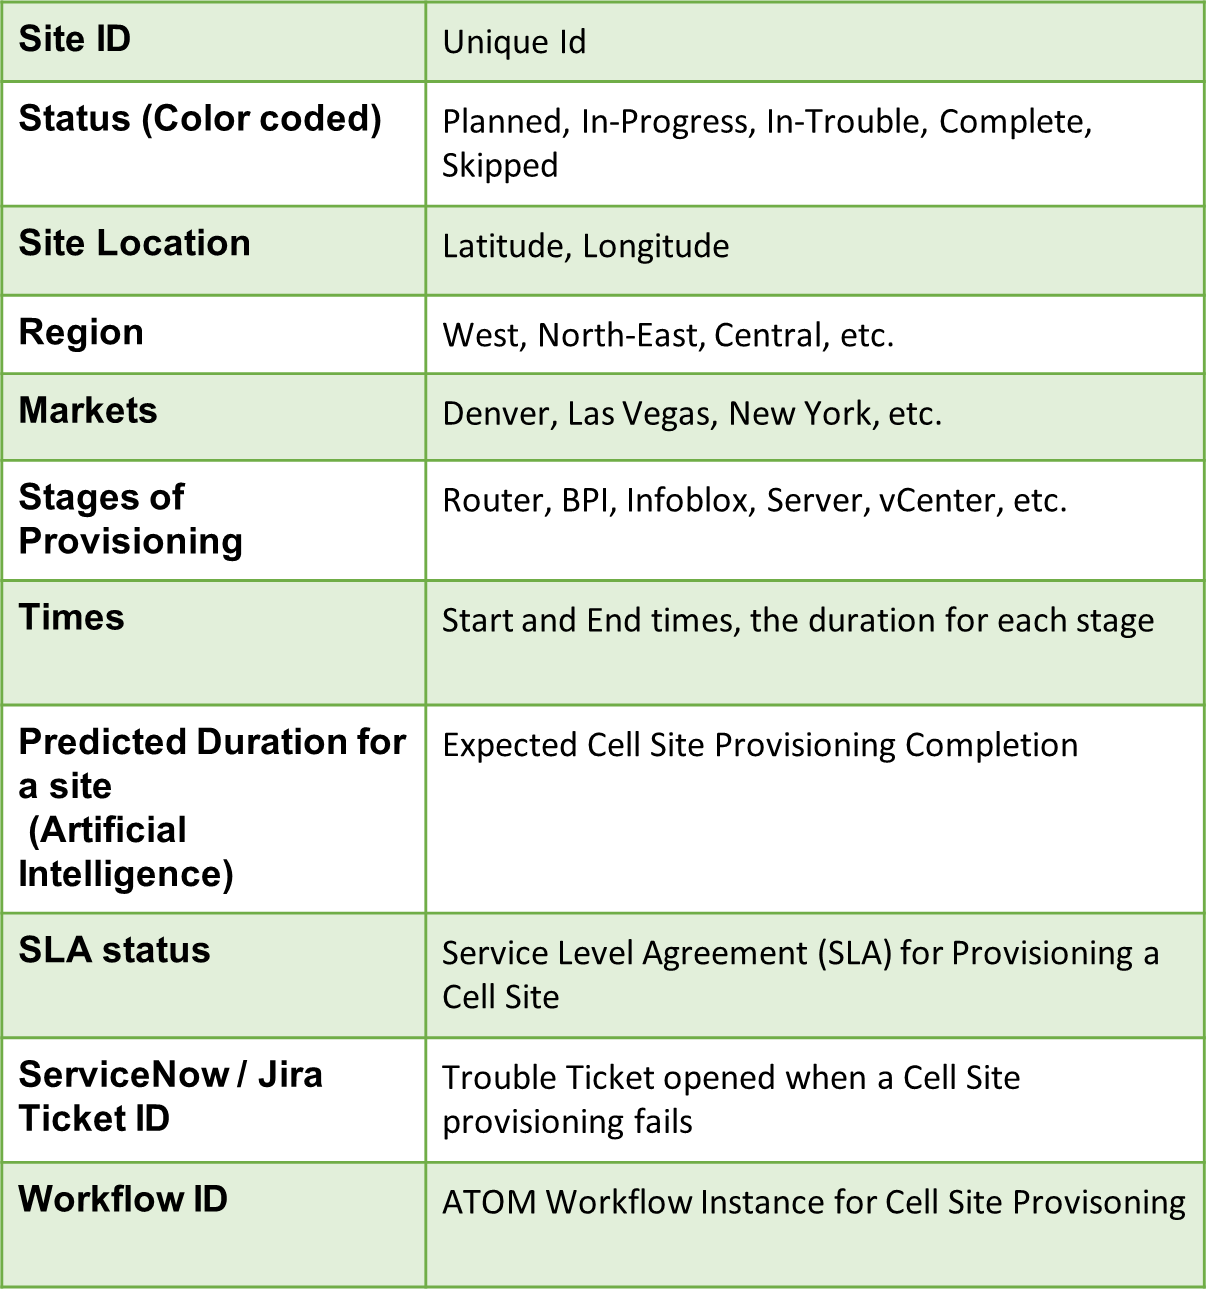
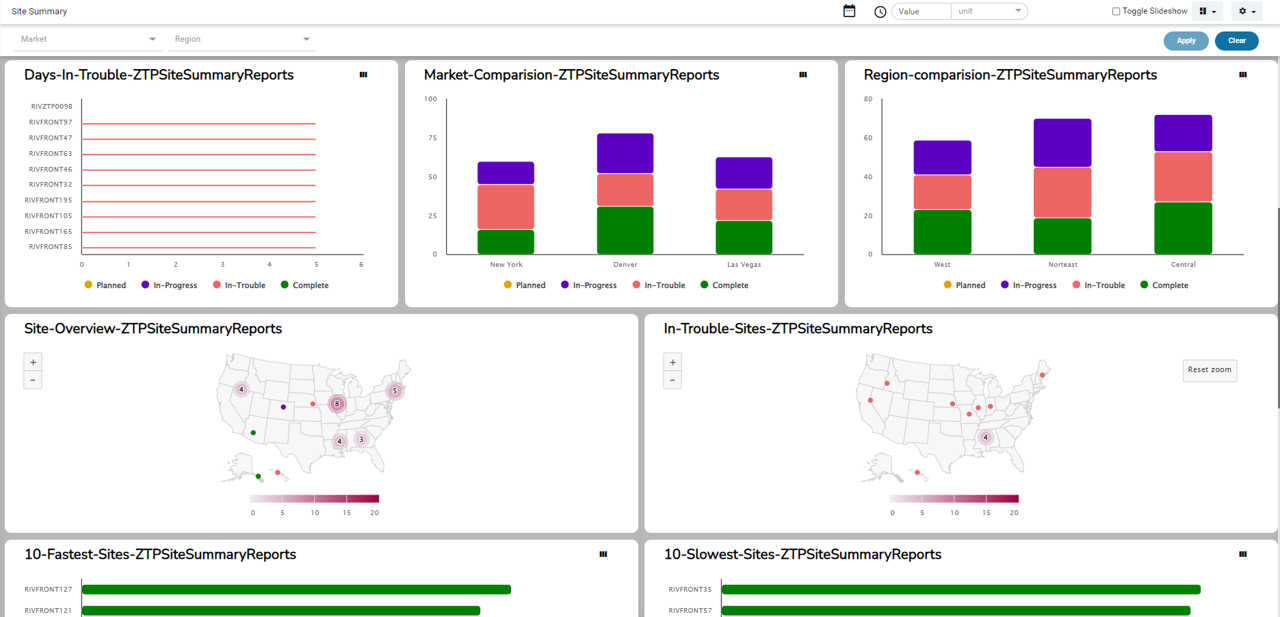
Users can subsequently create customized views of deployment reports by filtering them based on market, region, site status, stage status, SLA breaches, and time period. The various filtering options also facilitate the creation of context-specific reports, such as “in-trouble” sites in a specific market over the last week or sites where router provisioning was successful, but server provisioning failed. These reports cater to different user groups, such as market managers, network operators, and server administrators, as previously mentioned. The customized reports can also be saved and pinned to various dashboards for easy access in real-time and for download.
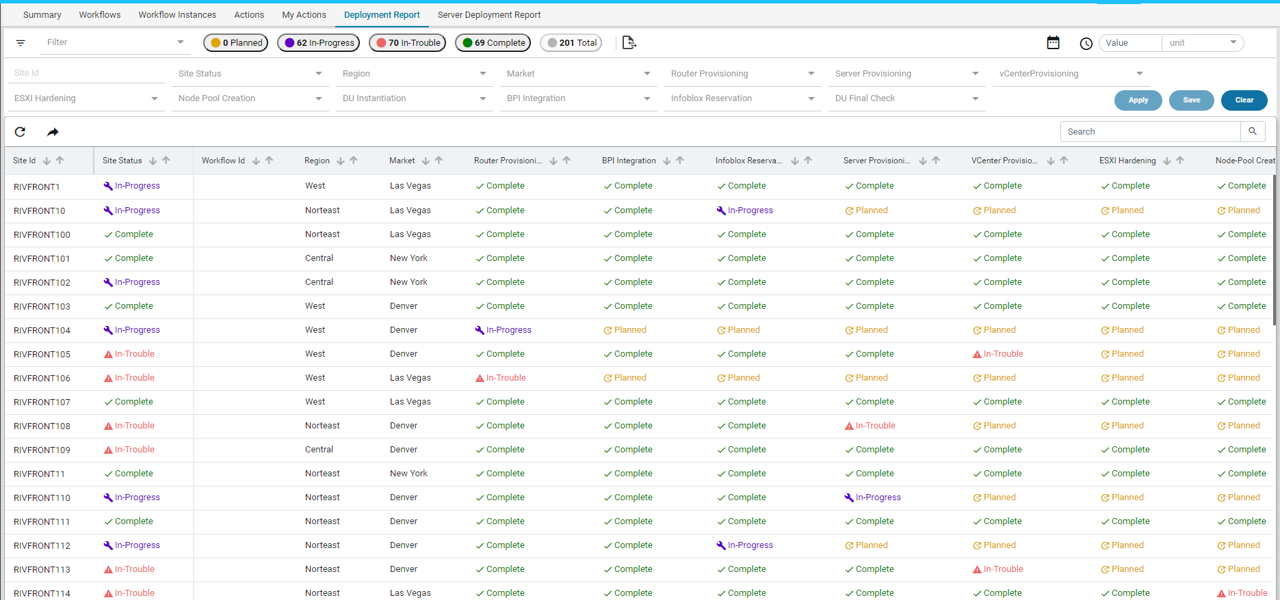
Example: Cell Site Deployment Report
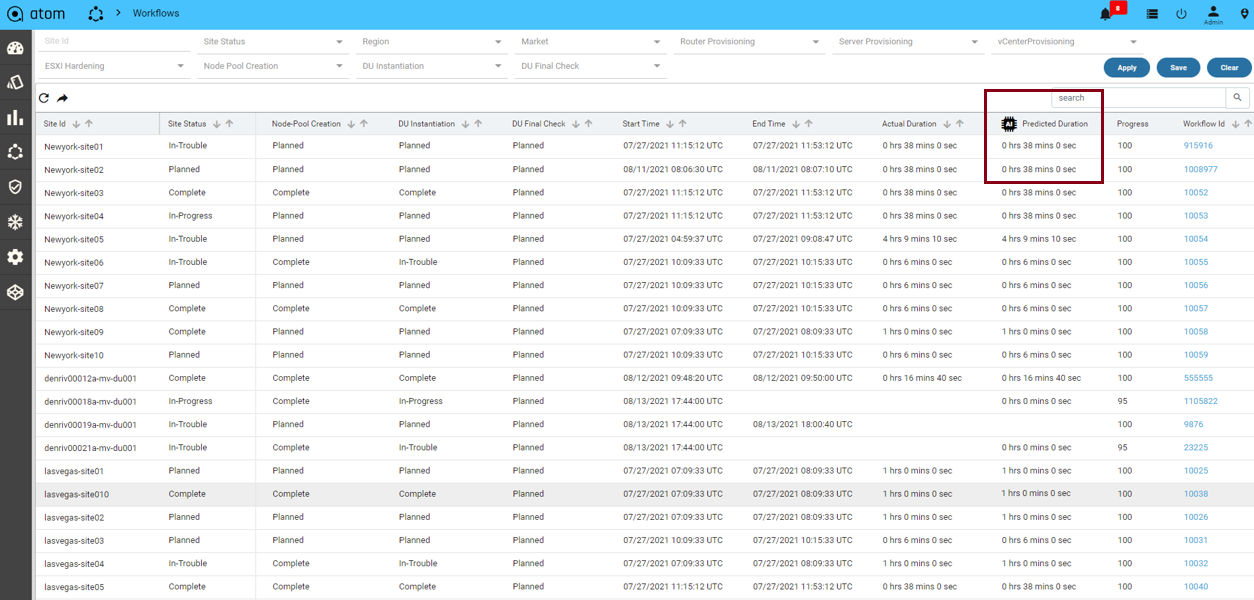
Example: Cell Site Deployment Report – AI – Predicted Duration
Dashboards
ATOM extensible dashboards represent the default landing pages for users. These dashboards contain helpful information to ease deployment and ongoing management and are customizable. The data can also be represented in various formats, such as:
- Bar graphs
- Line graphs
- Pie charts
- Number cards
- Trend graphs
- Top N tables
- Geo-Maps
Furthermore, information can be filtered by market, region, and time on a rolling basis and be projected on network operation center displays.
Example: (i) Dashboard
Example: (ii) Dashboard
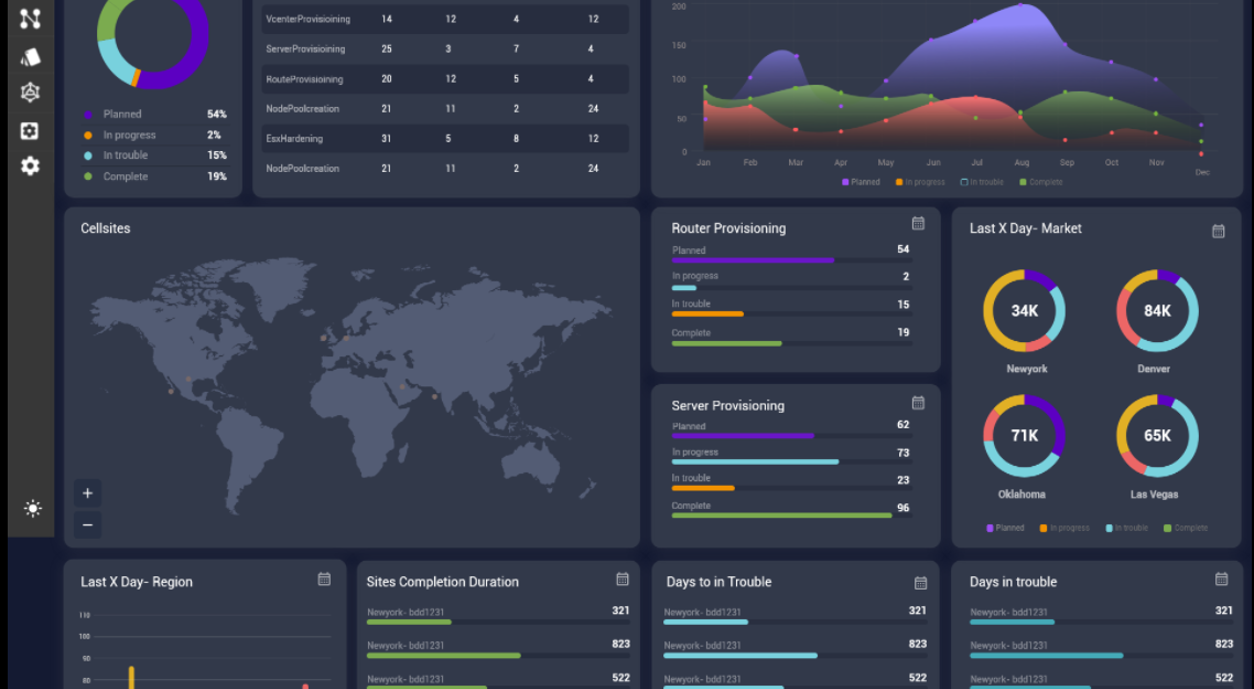
Example: Dashboard – Dark Theme
There are a number of significant insights that were gained in this deployment. Including-
- Number of sites that are in trouble and require operator intervention
- Sites that require a truck roll
- How long did it take for the operator to intervene when the site went down
- Rate of incoming trouble tickets vs. resolution of these tickets
- The market, region, stage, and vendor with a high failure rate vs. a high success rate
- Markets and regions where cell-site provisioning is the fastest vs. slowest
- Sites, markets, regions, and stages that missed SLAs
- Sites and stages that required repeated retries to resolve issues
- Comparison between different markets and regions
- Trends
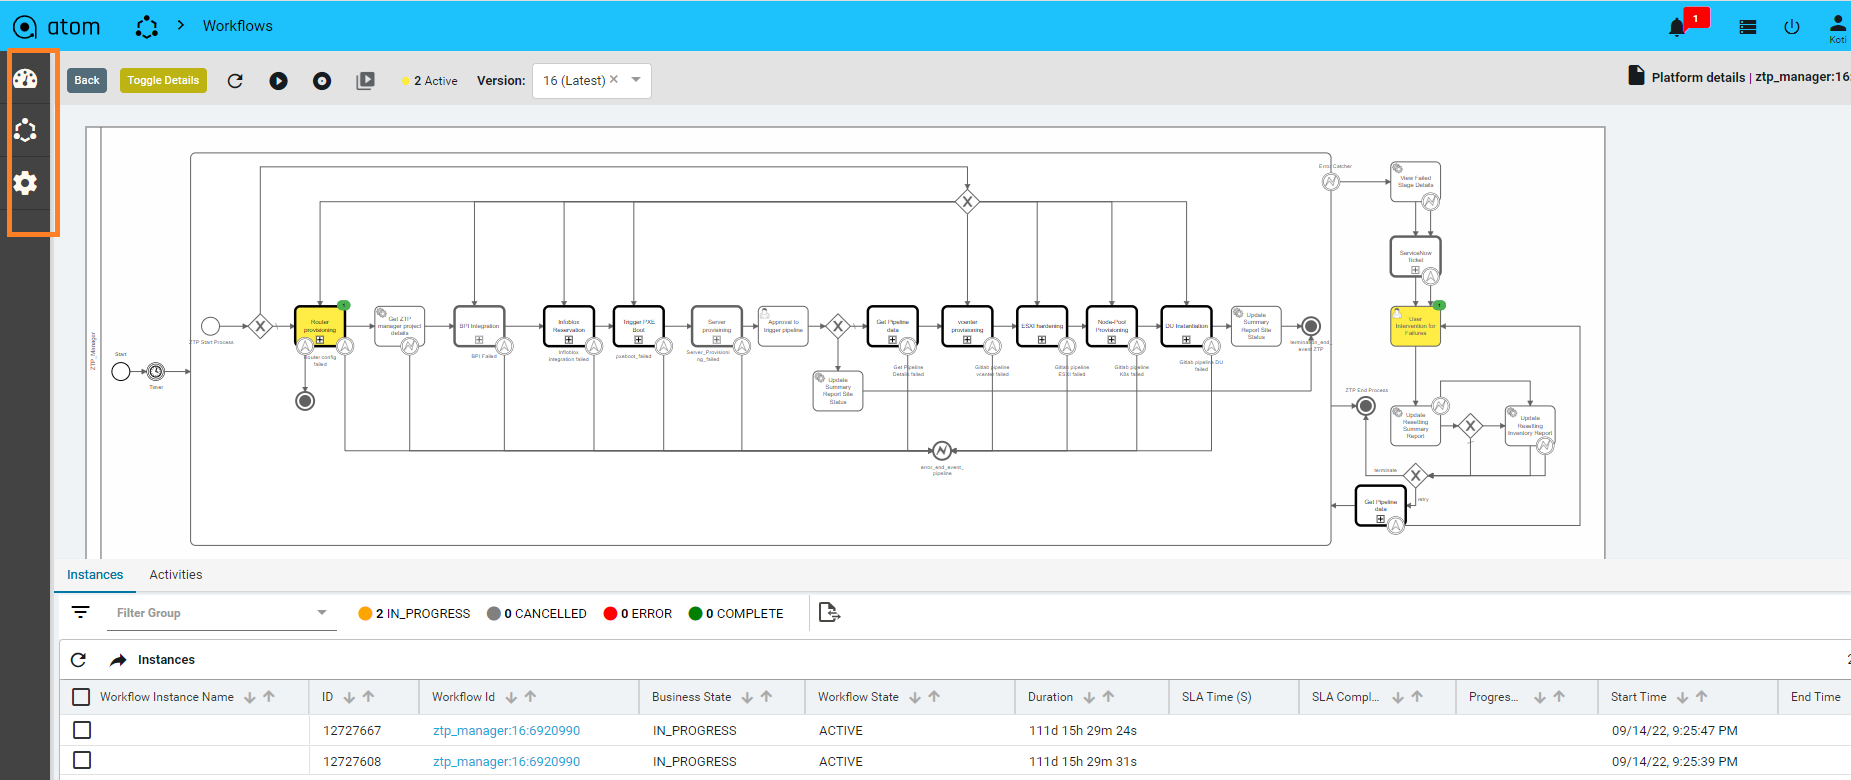
Handling errors through ATOM
When handling complex provisioning of a cell site that involves several external systems and integration points, an automation platform must have robust mechanisms to detect, notify and resolve failure scenarios.
Some of the common on-field challenges during cell-site provisioning include:
- Site / Device unreachable – both routers and servers
- Systems unreachable – Infoblox, GitLab, BPI, File Server, and more.
- Authentication errors or timeouts
- False positives – multiple router reboots that trigger cell-site provisioning workflows
- Incorrect or faulty device errors
- Incorrect or missing image versions on a file server
- Missing information in a system – Infoblox, BPI, etc.
- GitLab pipeline failures
- Timeouts due to devices/stages taking too long to provision
- Network latency and connectivity issues
- Empty / information missing in the notifications to ATOM ZTPO
- Device upgrade failures
- Device provisioning failures
ATOM ZTPO workflows have integrated checks designed to handle these errors with recovery options. Corresponding ServiceNow and Jira tickets can also be created or updated with all of the details of the failure, stage, Site-ID, and severity and assigned to teams that manage these stages. Additionally, a Slack notification is also sent to the teams.
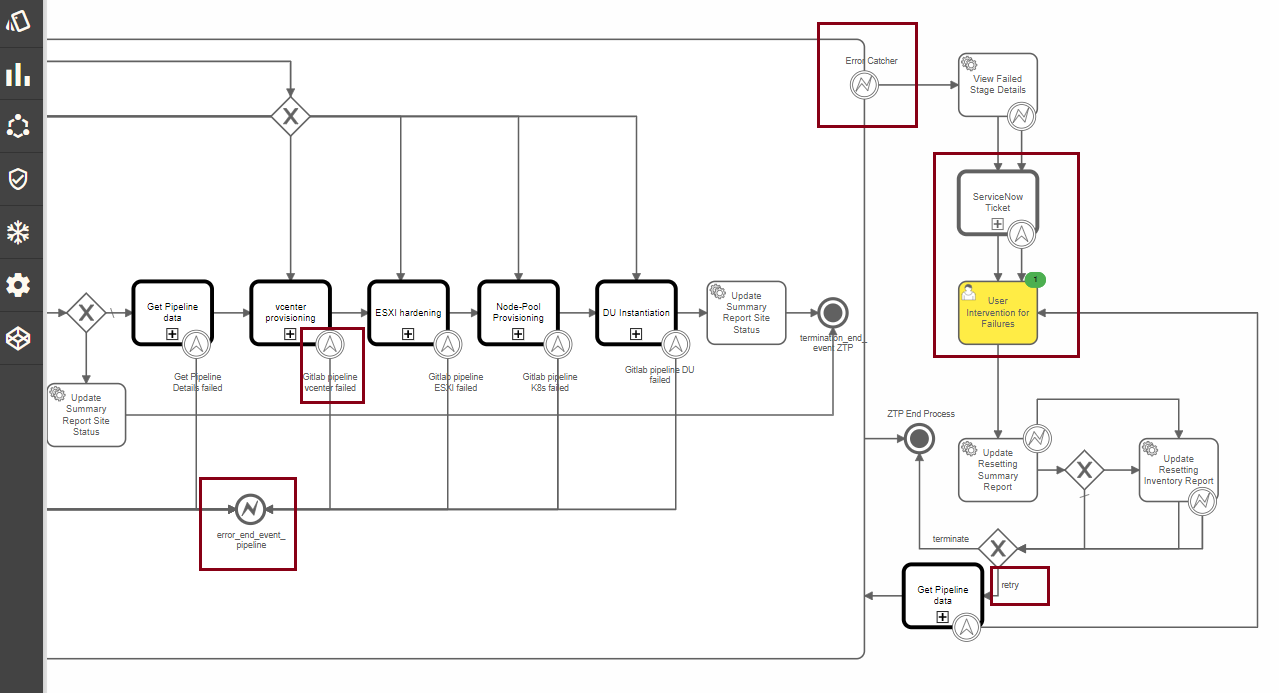
Workflow: Detect, Notify, and Resolve Errors
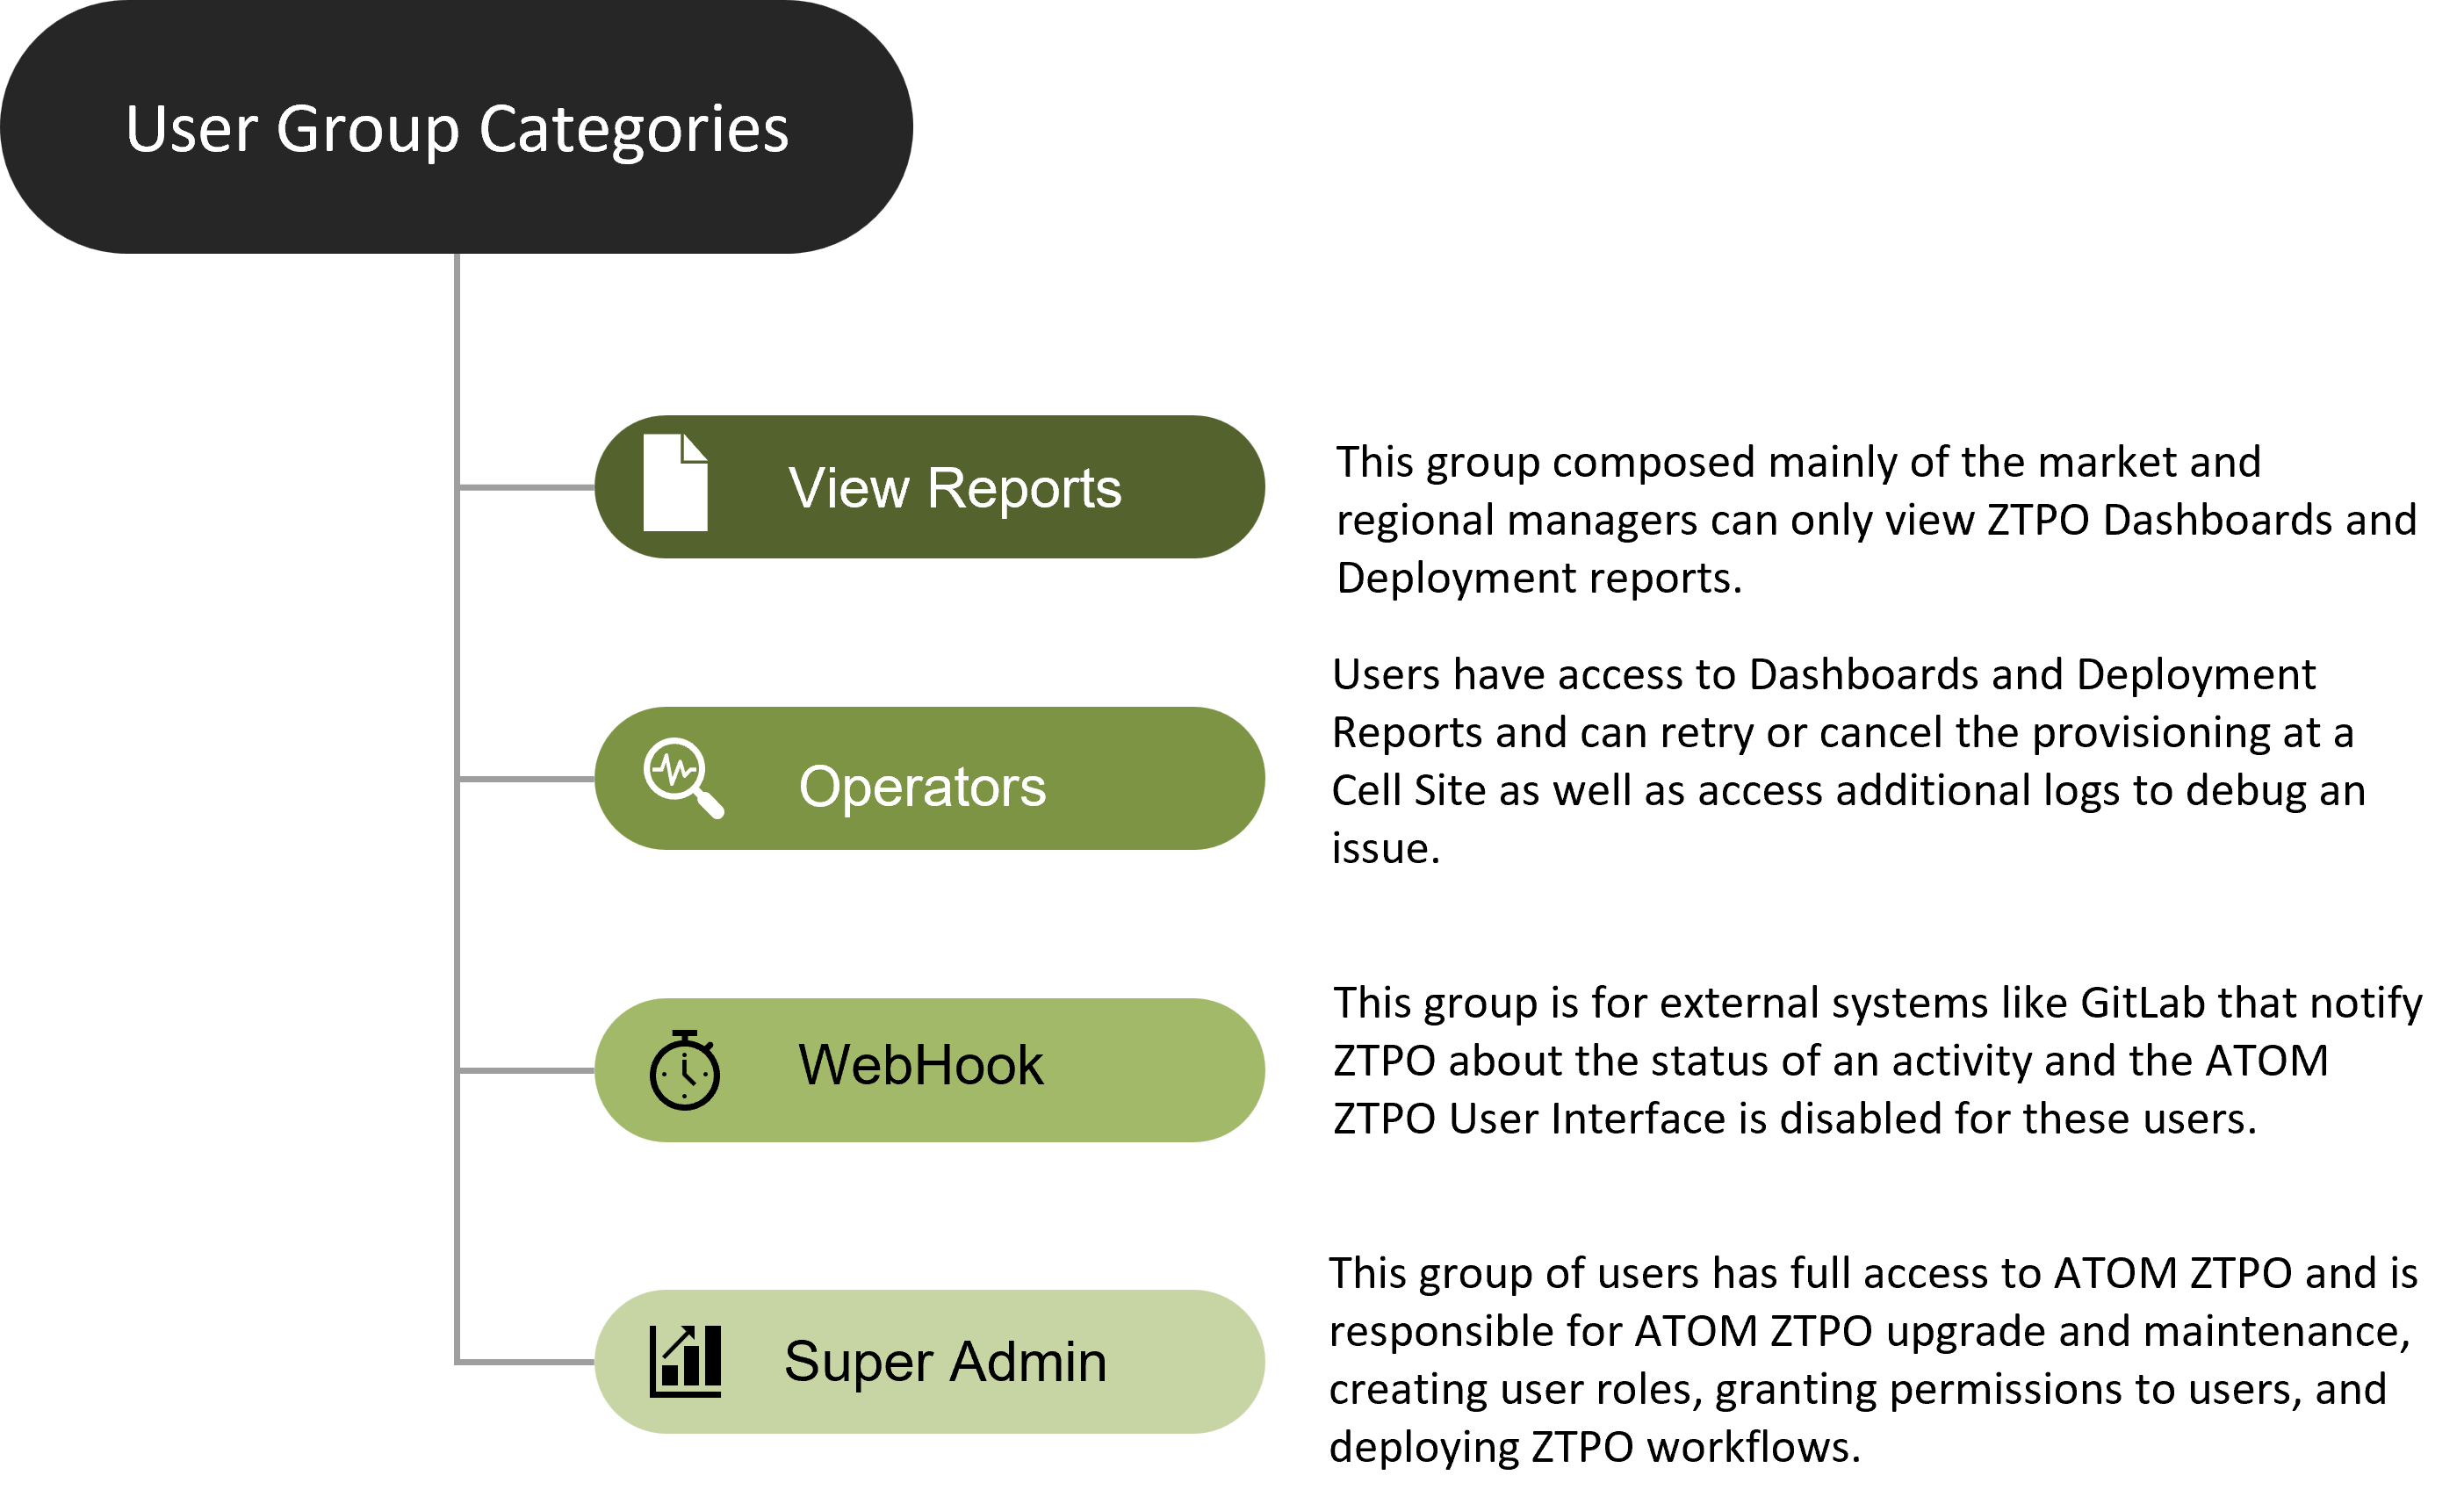
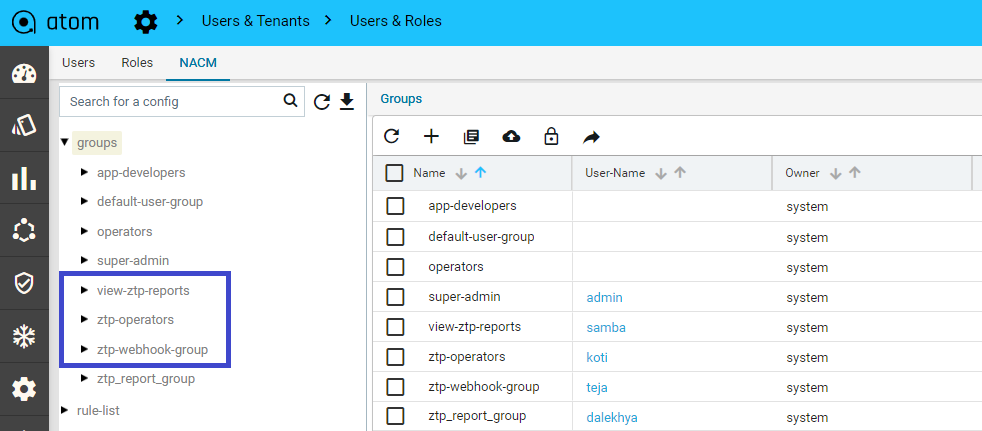
RBAC and UI View
Various functional user groups can access ATOM ZTPO to gain critical insights. Each group typically requires access to specific sections of the ZTPO. To address this need, ATOM supports Role Based Access Control (RBAC). User groups that grant permissions to specific resources and restrict the User Interface (UI) view in ATOM are consequently created.
Workflow: Detect, Notify, and Resolve Errors
User Groups: Super Admin, Operators, etc.
Admin User: Full Access to ATOM
Network Operator: Limited Access to ATOM – Dashboards & Reports, Workflows, Logs
Region / Market Managers: Access to Dashboards & Reports
Summary
In conclusion, ATOM proved an indispensable tool for this customer’s O-RAN journey deployments by facilitating parallel cell-site provisioning at scale. With its extensible dashboard and deployment reports, ATOM provided the necessary automation to cover 50,000 sites nationwide, encompassing over 200,000 network and server elements. As a result, this operator’s management process was drastically improved, going from 26 hours per device to a mere 2 hours via automation. The onboarding time also decreased significantly from 15 hours per device to approximately 70 minutes per device, resulting in tremendous operational cost savings. In addition, the team eliminated configuration and integration touchpoints, combined network and business operations, and developed customizable workflows, which helped reduce manual errors and increase productivity.
ATOM, as a cross-domain automation platform, extends beyond ZTP and O-RAN services to provide Network-as-a-Service (NaaS) and Anything-as-a-Service (XaaS). The solution accelerates time-to-market through swift deployment and testing of new services while also providing cost optimization through its pay-per-use model.
Additional Contributors: Manisha Dhan


