Skip to content
Getting Started with ATOM
Intended Audience
This document is intended for Network Administrators & Operators that are using ATOM to perform Network management, configuration management, services automation and MOPs.
References
- ATOM Deployment Guide – All aspects of ATOM Deployment including sizing and deployment process
- ATOM User Guide – Master [This Document]
- ATOM User Guide – Remote Agent Deployment Guide
- ATOM User Guide – Performance Management & Alerting
- ATOM User Guide – Network Configuration Compliance, Reporting & Remediation
- ATOM API Guide – Discusses all external interfaces and integration flows
- ATOM Platform Guide – Discusses Service model, Device model and Workflow development
ATOM Solution Overview
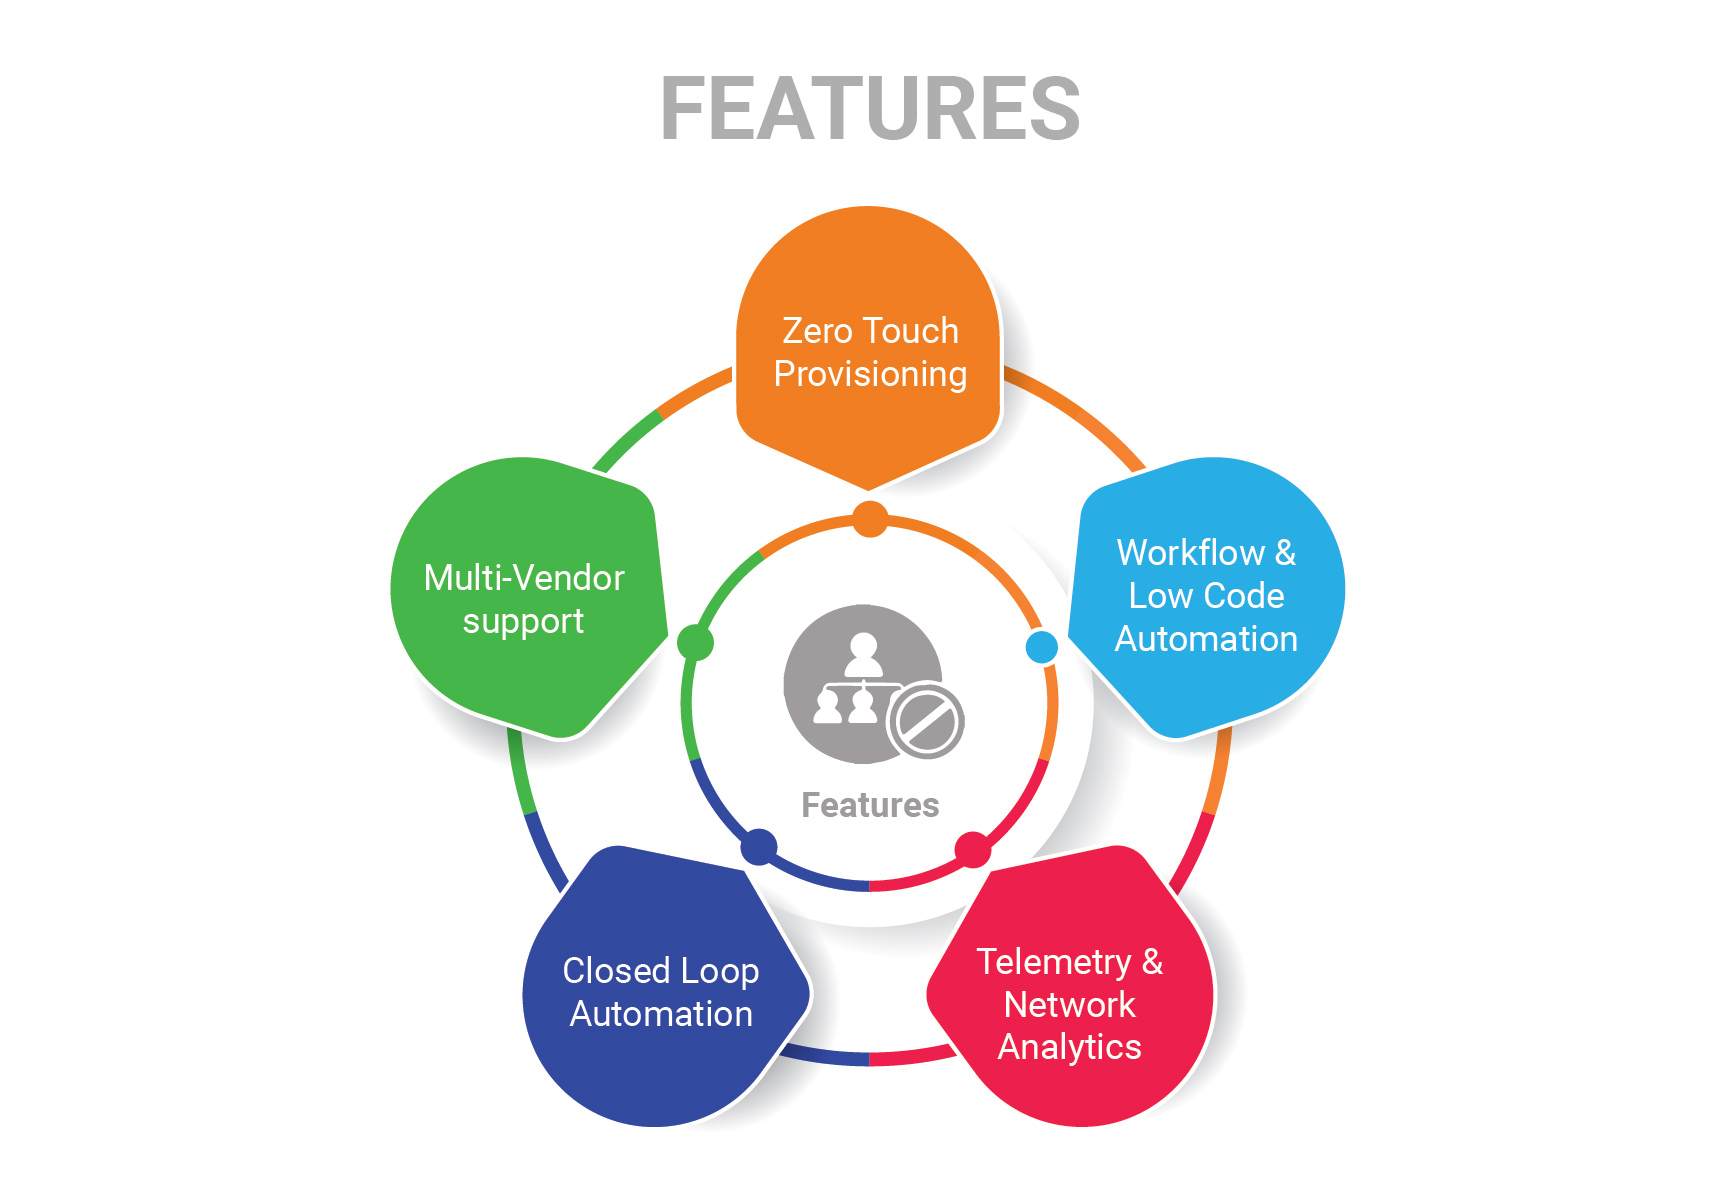
Following sections provide a brief overview of ATOM Features.
Configuration Management
ATOM provides Configuration management capabilities for a wide variety of devices. This includes configuration archival, scheduling, trigger driven configuration sync, configuration diff etc.,
Topology
ATOM provides topology discovery through CDP & LLDP. Topology can be displayed hierarchically using Resource Pools (Device Groups). Topology overlays Alarms and Performance information.
Collection & Reporting
ATOM supports collection of network operational and performance data through various protocols like SNMP, SNMP Trap, Syslog & Telemetry. Such information can be visualized in ATOM as reports or can be rendered on Grafana as Charts. Admin guide discusses Report customization in further detail.
Network Automation
ATOM provides Model driven Network automation for stateful services. Stateful services involve a Service model (YANG) and some business logic. Service model development is covered in ATOM Platform guide. Admin guide discusses how to deploy & operate a service.
Workflow & Low Code Automation
ATOM provides an intuitive graphical designer to design, deploy and execute simple or complicated network operations and procedures. It allows the administrator to configure pre-checks, post-checks and approval flow. Workflow creation flows will be covered in the ATOM Platform Guide. Admin guide discusses how to deploy & operate.
Telemetry & Network Analytics
In today’s economy, data is the new oil. Anuta’s ATOM helps organizations collect a massive amount of network data from thousands of devices and generate detailed in-depth insights that will help them deliver innovative applications and solutions to their customers. ATOM can collect network data from a variety of sources including model-driven telemetry, SNMP and Syslog. The diverse data format of each source is normalized to provide a single consistent view to the administrator. Grafana is packaged as part of ATOM to view historical data, observe patterns and predict future trends. Organizations can integrate their Big Data and AI platform with ATOM to generate business insights from the network element configuration and operational state.
Procedure to Create Native Telemetry Collection
- Create a new Telemetry Collection
- Provide the name of collection
- Choose Junos as platform
- Select the transport as UDP which we will auto select the encoding as compact GPB with Dial Out Mode
- To configure resource filtering on device, select the filtering tab and choose the sensor name in dropdown & add regex pattern to configure
- Select ALL option, if we have same resource filter across sensors
- Once telemetry collection is provisioned, users can’t edit the entry.
- Subscription is not required in this case.
Closed Loop Automation
Anuta ATOM allows administrators to define a baseline behavior of their network and remediation actions to be initiated on any violation of this behavior. ATOM collects a large amount of network data from multi-vendor infrastructure using Google Protobufs and stores in a time series database. ATOM correlation engine constantly monitors and compares the collected data with the baseline behavior to detect any deviations. On any violation, the pre-defined remediation action is triggered thereby always maintaining network consistency.
The solution simplifies troubleshooting by providing the context of the entire network. Customers can define KPI metrics and corrective actions to automate SLA compliance.
Multi-Vendor support
Anuta ATOM has the most comprehensive vendor support. It supports thousands of devices spanning across 45+ vendors and automates all the use-cases including Data Center Automation, InterCloud, Micro-Segmentation, Security as a Service, LBaaS, Campus/Access, Branch/WAN, IP/MPLS Edge, Virtual CPE, and NFV.
odel (YANG)
Multi Tenancy
ATOM supports Multi-Tenancy across organizations and Sub-Tenancy within an Organization.
- Multi-Tenancy – Supported on ATOM On-Premises & ATOM Silo/Dedicated Deployment on ATOM Cloud.
- Tenants (Coke, Pepsi etc.,) are completely isolated from each other.
- Sub-Tenancy – Supported on All ATOM Deployments – On-Premises, ATOM Cloud Silo/Dedicated and also ATOM Cloud Shared.
- Data sharing across sub-tenants (Coke.east, Coke.west, Coke.it etc.,) is controlled by Tenant Admin.
- By Default Data at a higher Level Tenant is Visible to the Sub-Tenants.
- By Default, Data under a sub-tenant is visible to the Tenant
- By Default, Data under a sub-tenant is not visible to other Sub-tenant
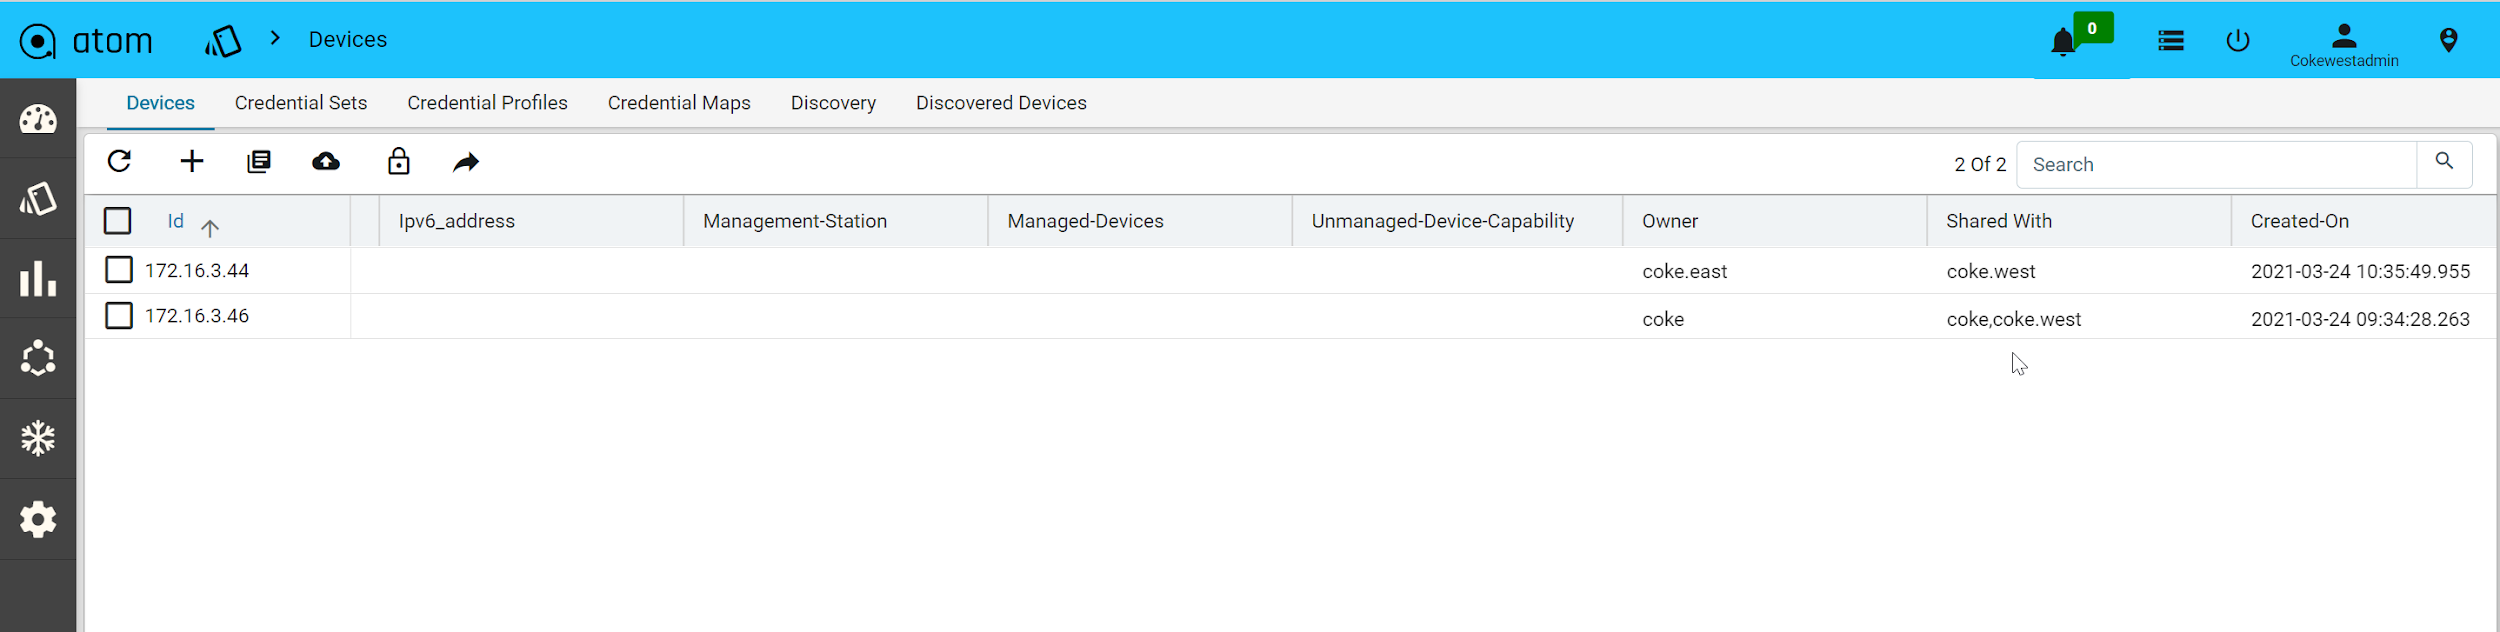
- Example – Coke.east owns a resource (credential set or device etc.) and wants to share with sub tenants (Coke.west but not with Coke.it). In this case, ATOM Multi Tenancy Infrastructure provides a facility to share a resource with particular sub-tenants. Upon sharing the resources as required, each individual ATOM User interface will provide information on Resource sharing as shown below. This behaviour will be the same across all the resources in ATOM and will not be discussed specifically across features in the user guide.
Sample View of Resource being shared from Coke.east to Coke.west
Multi-Tenancy including Sharing, Wild Card usage to share across multiple Sub-tenants, Users within a Sub-Tenant and more details are discussed in ATOM Multi Tenancy & Sub-Tenancy
Viewing the Dashboard
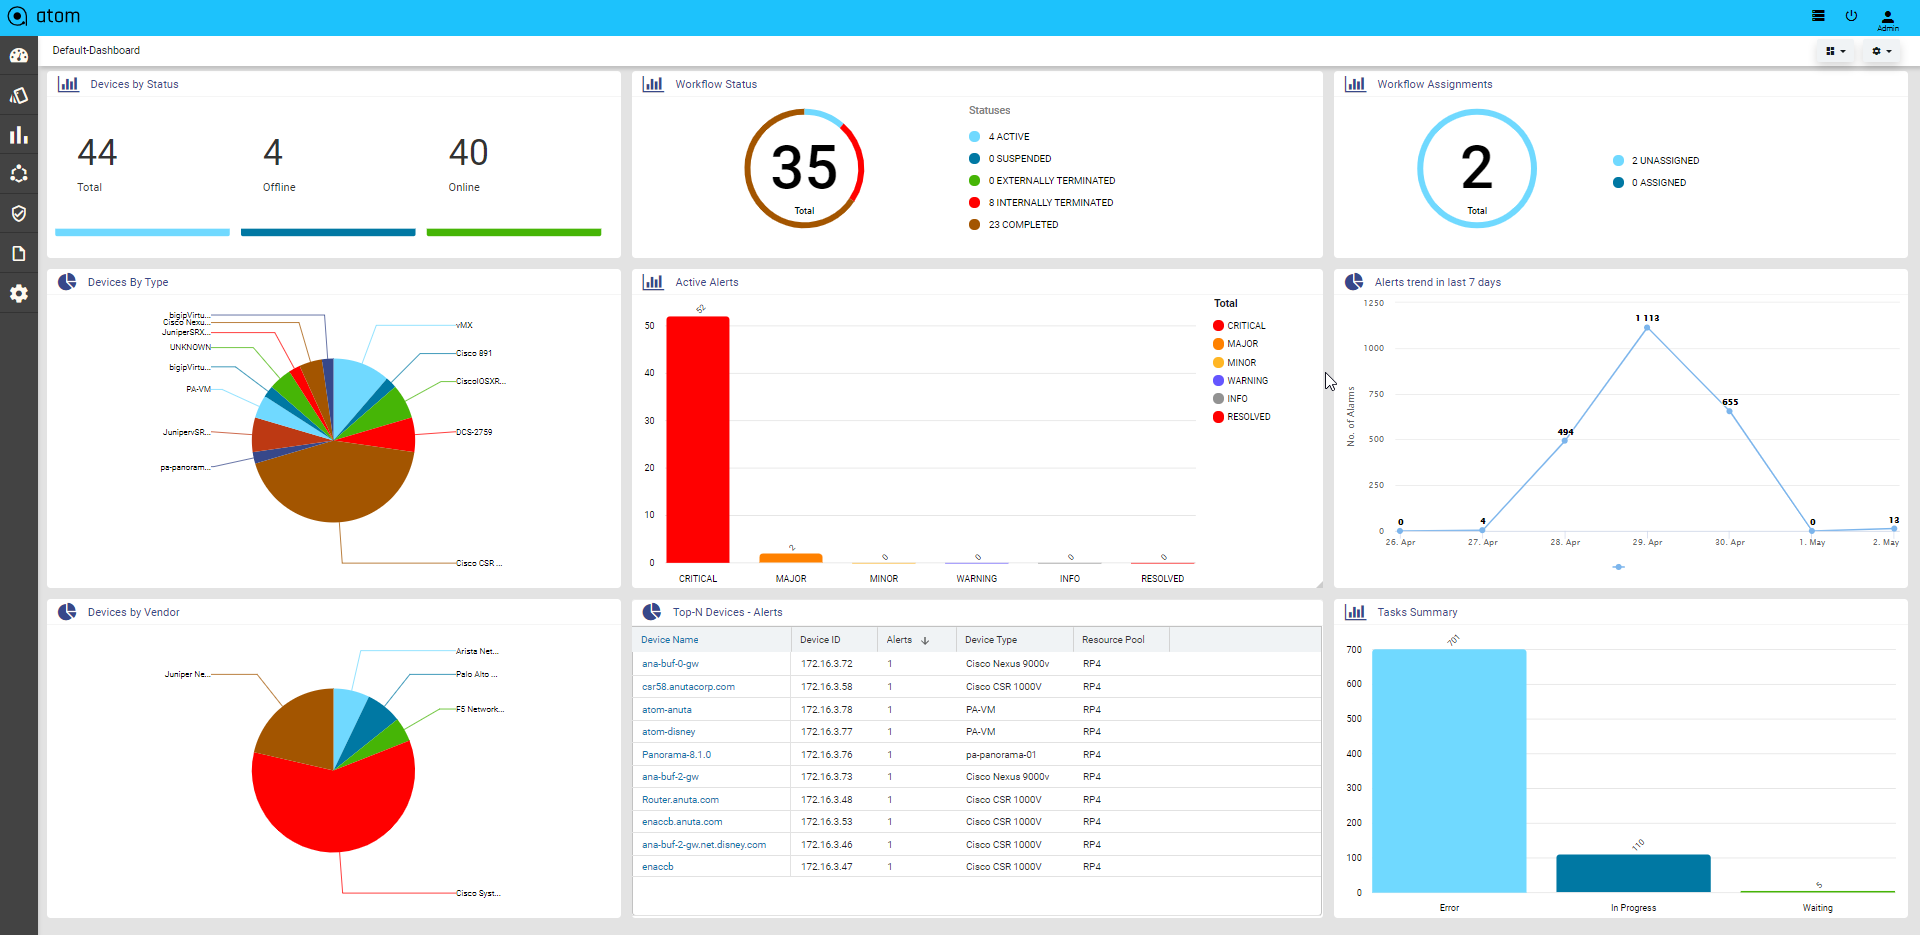
Dashboard provides a simple, integrated, comprehensive view of the data associated with the resources managed by ATOM. Information about the devices, services, service approvals are available “at‐a‐glance” for the administrator.
Starting from the 7.x release, Dashboard, the landing page of ATOM, is organized into dashlets. A dashlet is an individual component that can be added to or removed from a dashboard. Each dashlet is a reusable unit of functionality, providing a summary of the feature or the function supported by ATOM and is rendered as a result of the custom queries written in DSL.
You can customize the look of the Dashboard, by adding the dashlets of your choice, and dragging and dropping (the extreme right corner of the dashlet) to the desired location on the dashboard.
Each dashlet contains the summary or the overview of the feature or the functionality supported by ATOM.
For example, the dashlet “Device” displays the summary of devices managed by ATOM.
Some of the statistics that can be of interest in this dashlet could be as follows:
- Total number of devices
- Number of online devices
- Number of offline devices
These statistics can be gathered by ATOM and displayed in the corresponding dashlet depending on the DSL query written for each of them. You can save the layout containing the dashlets of your choice and set in a particular order.
Resource Management
ATOM Resource management involves device credential management, device onboarding through discovery or manual import, configuration archival, topology discovery & visualization, resource pools (device grouping), IP Address Management etc.,
Following table provides a quick summary of the activities that can be Resource Management activities.
| If you want to.. | Navigate to … |
| Credential Sets, Credential Maps and Devices | Resource Manager > Devices |
| Device Discovery | Resource Manager > Devices > Discovery |
| Visualize Topology | Resource Manager > Network > Topology |
| Create & Visualize Logical & Hierarchical Network Device Groups/Resource Pools | Resource Manager > Network > Resource Pools |
| Create physical locations | Resource Manager > Locations |
Device Management
Device Management involves onboarding of devices and working with Device inventory, Configuration, Monitoring & Alerts. Devices can be added Manually, through an API or Automated Discovery using CDP/LLDP.
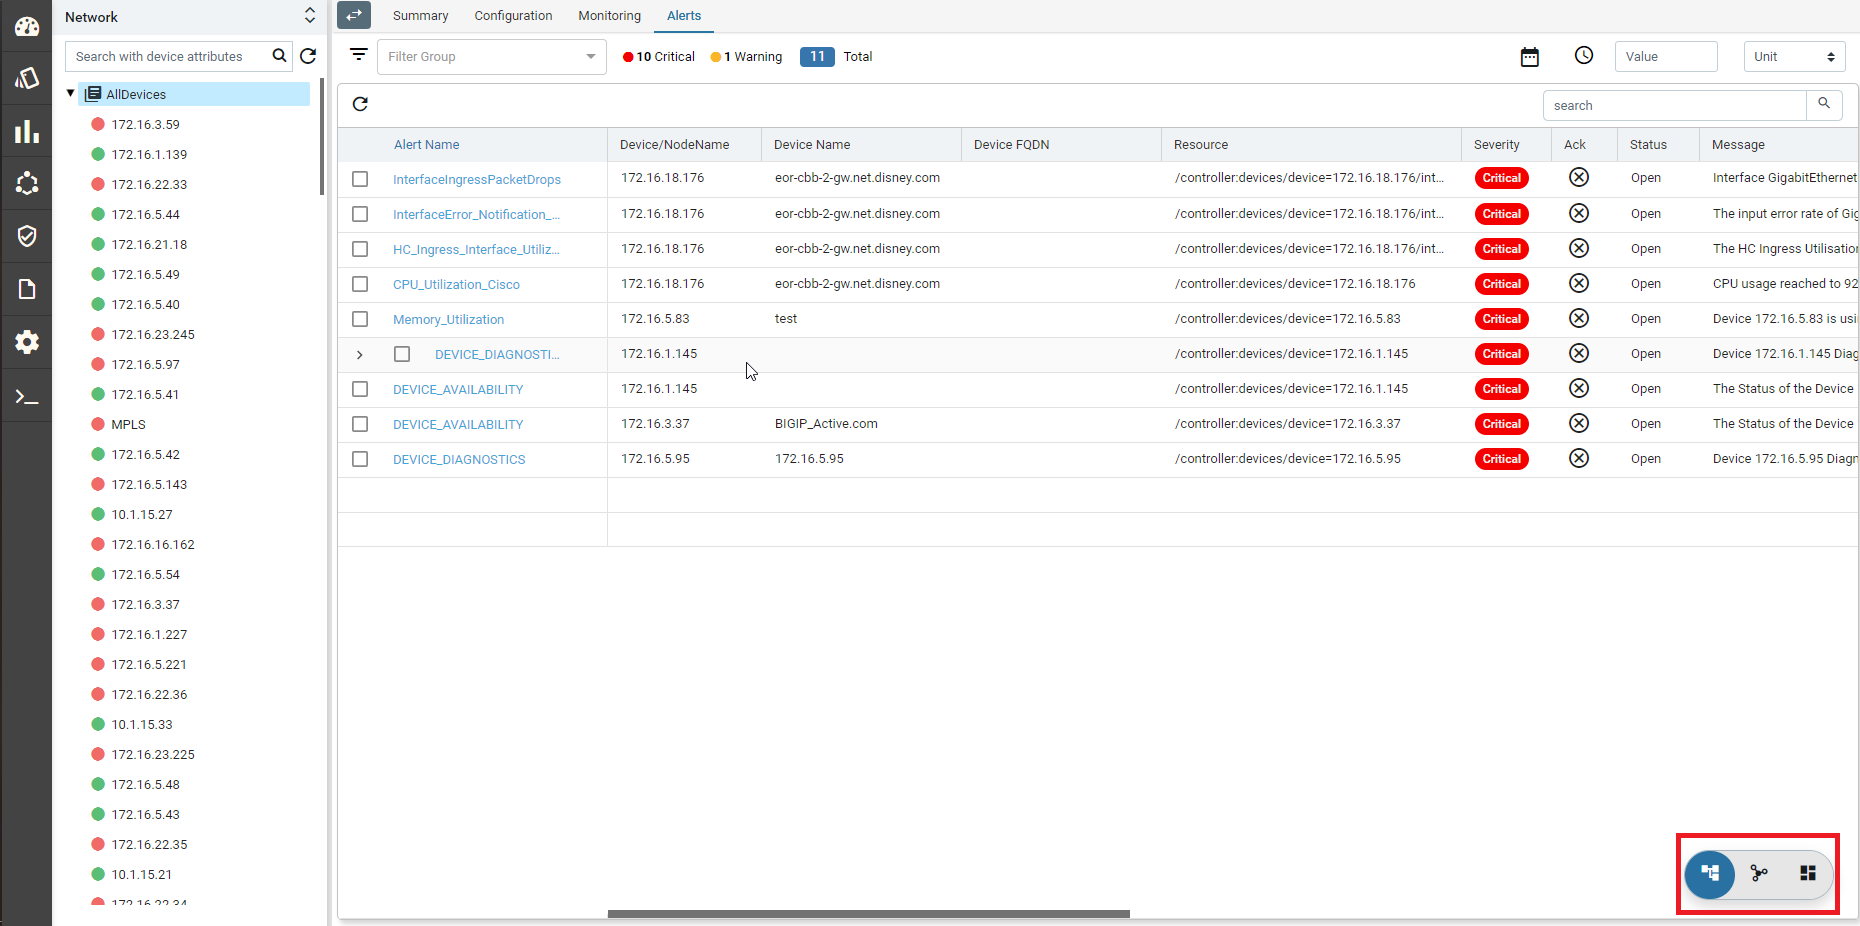
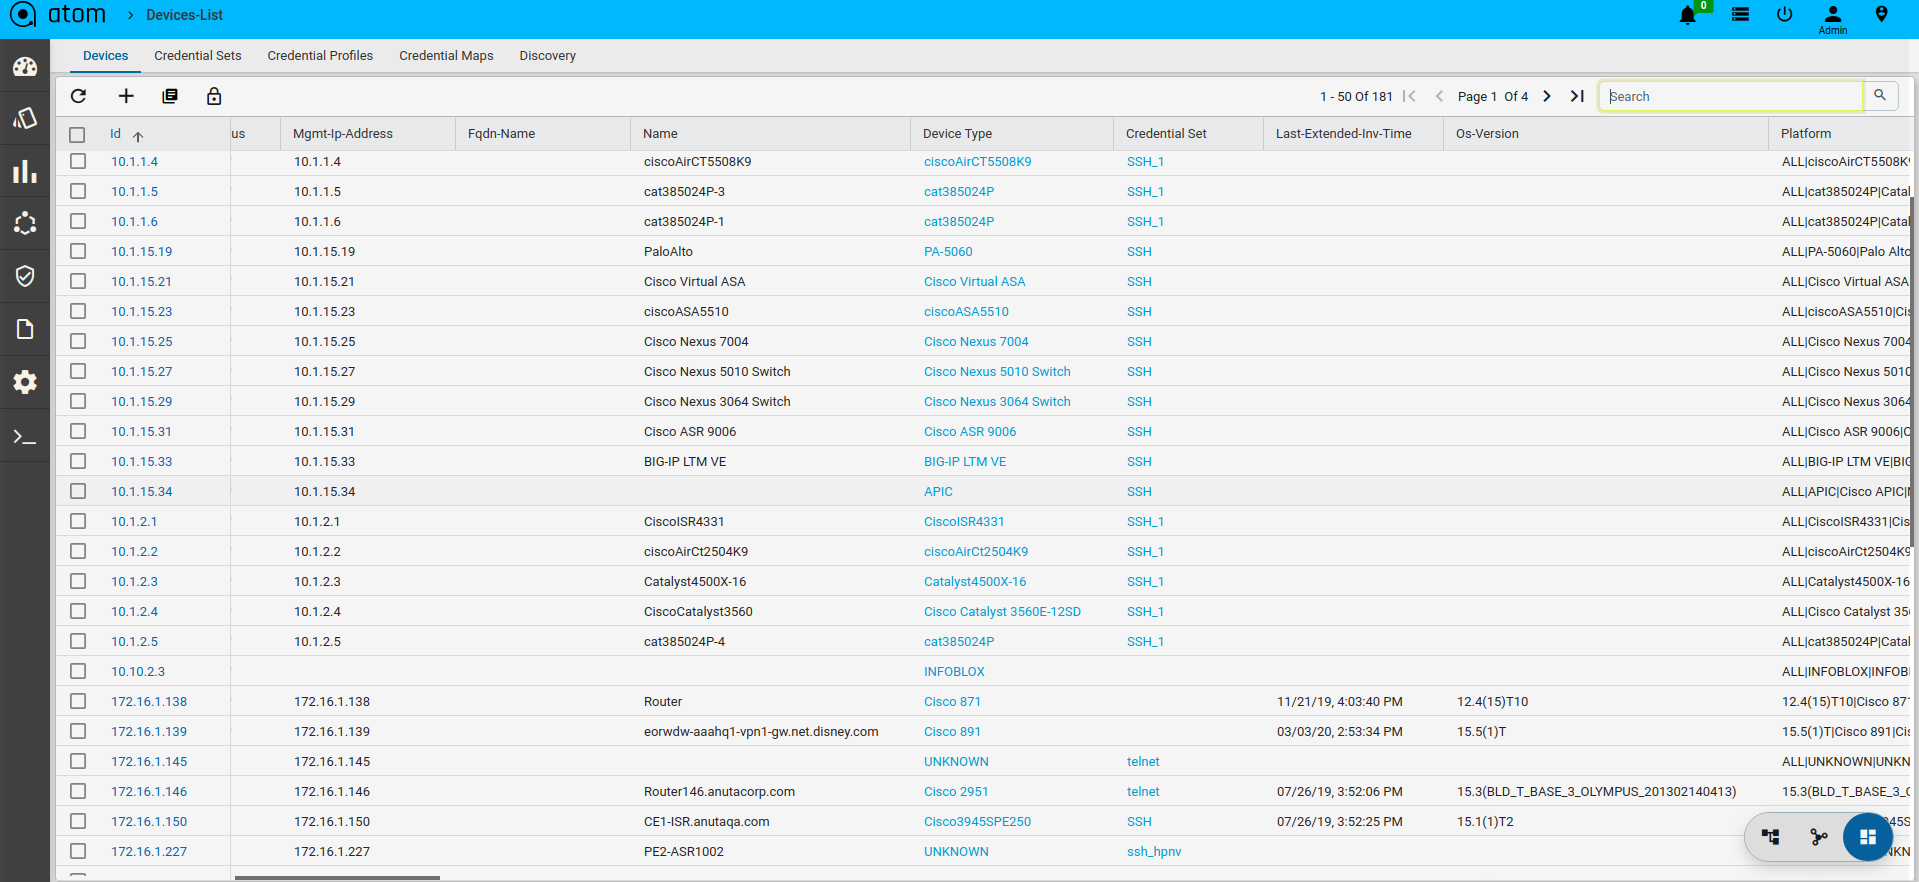
All Device Mgmt activities can be performed from Device Explorer & Grid View. Following are the three main views for a Device.
- Grid View – Grid layout of all Devices & and action on a device(s)
- Tree View – Device Group based tree view of devices that provides a much easier way to toggle between devices and inspect various device characteristics.
- Topology View – Devices can be visualized in a Topology view
- Device Detail View – On Clicking a Device from Tree View or Grid View a detailed view of the device is presented. This is same as the view when a device is selected from the Tree view
Grid, Tree view & Topology Views can be toggled using the view selector button available at the bottom right hand side corner of the page.
Credential Management
ATOM provides multiple functions like Provisioning, Inventory Collection etc. Function like Provisioning can be various ways – Payload (CLI vs YANG or Other) over a Given Transport (SSH, Telnet, HTTP(S), etc.,). For example, based on the use case ATOM Workflow Engine can use various Payload + Transport mechanisms to perform Provisioning actions. ATOM helps accomplish this using:
- Credential Sets – Define the Transport/Connectivity & Authentication to the devices
- Credential Profile – Maps Credential Sets to various functions in ATOM
This addresses various scenarios, some as follows:
- Reuse of same SNMP Credentials across the entire Network, while retaining Device/Vendor Specific Transport for Provisioning.
- Inventory Collection Via SNMP for a Given Vendor/Device vs Telemetry for another
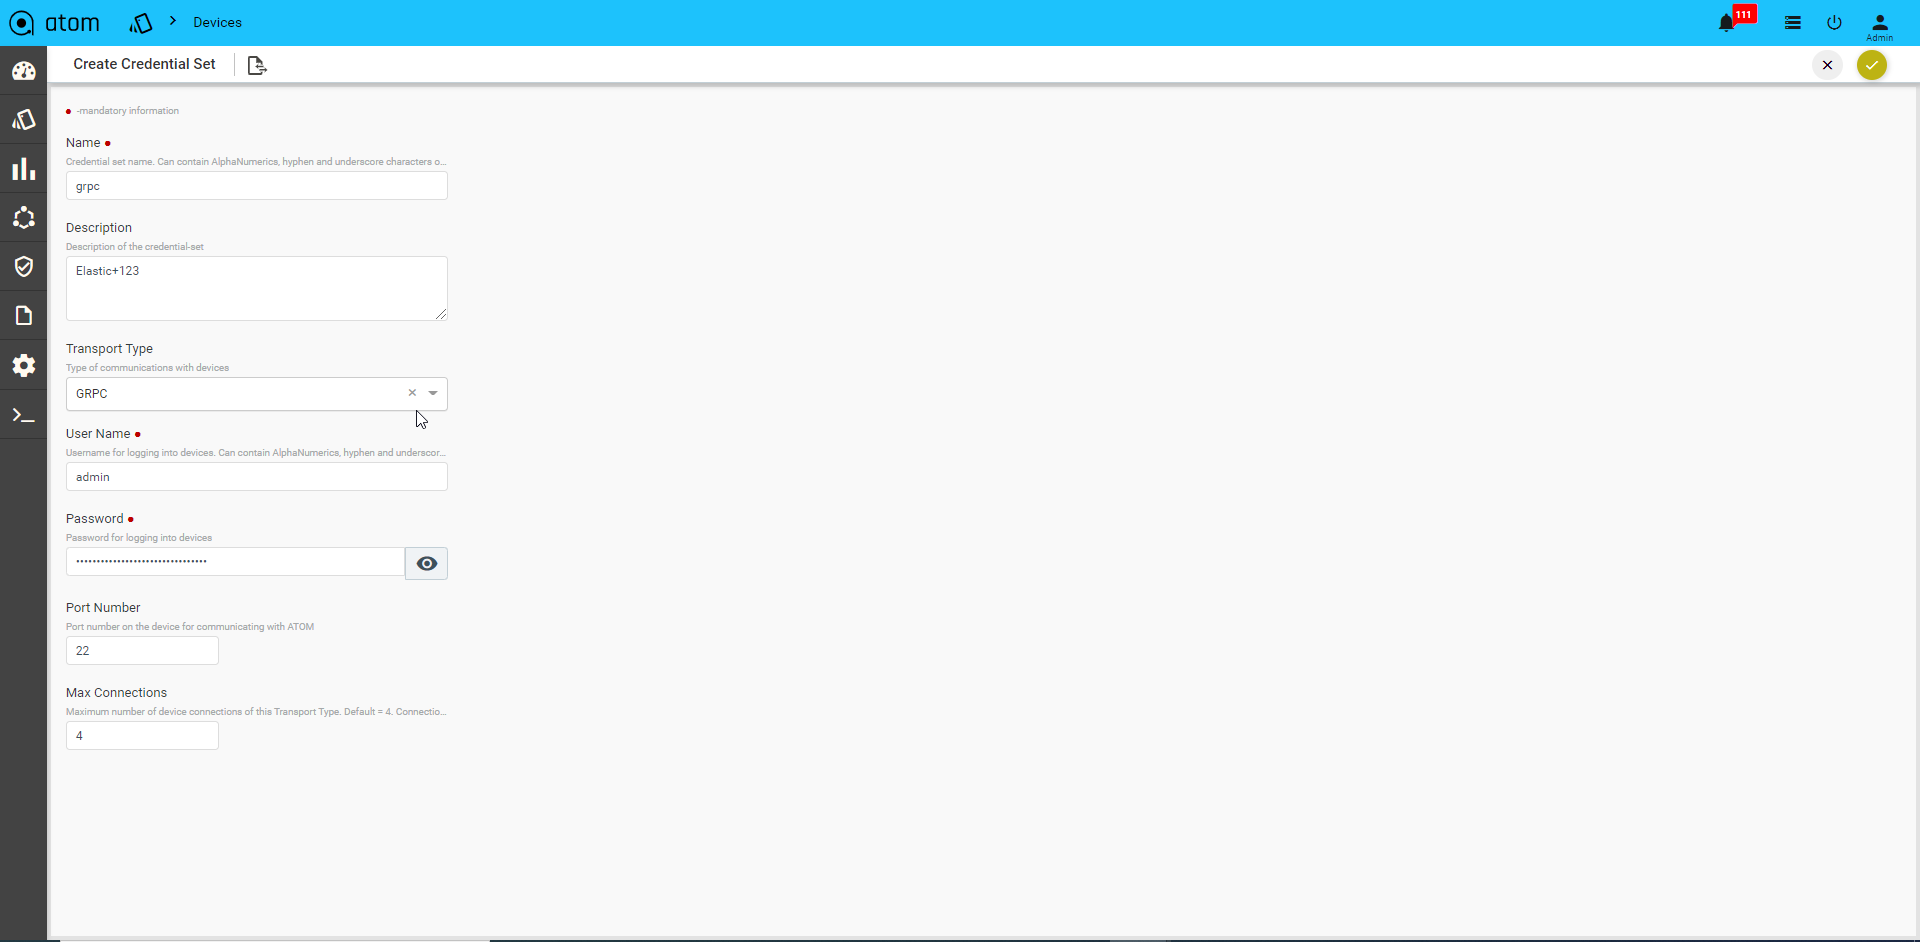
Credential Sets
Following section provides guidance on how to configure device credentials in ATOM.
- Navigate to Resource Manager > Devices > Grid View(Icon) > Credential Sets
- Create/Edit a Credential Set
- Name: Enter a string that will be used to identify the Credential Set
- Description: Enter a description w.r.t the created Credential Set(Optional)
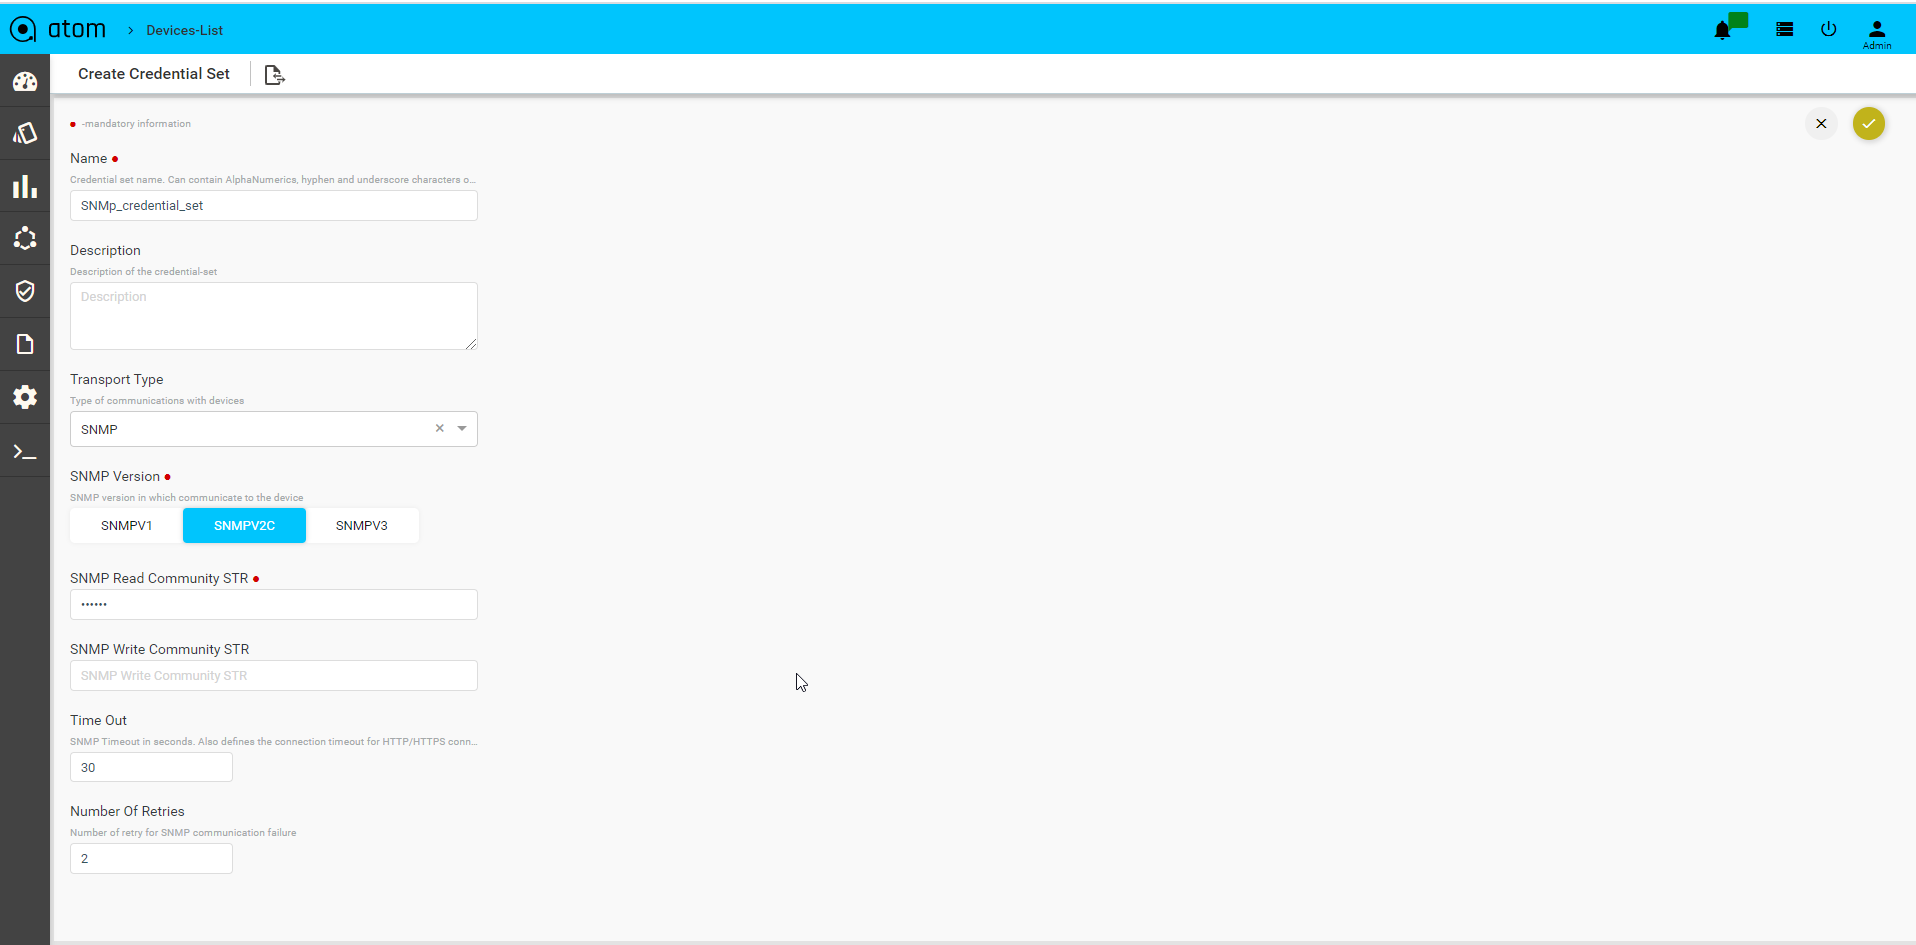
SNMP Transport credentials:
Select Transport type as “SNMP” can view below option
- SNMP version: Select the version of SNMP that should be used for device communication
- SNMP Read Community String: Enter the string that is used by the device to authenticate ATOM before it can retrieve the configuration from the device
- SNMP Write Community String: Enter the string that is used by the device to authenticate ATOM while writing configuration to the device
- Timeout: Enter the time taken for the response from the device in seconds.
- Number Of Retries: Enter the number of times the SNMP request is sent when a timeout occurs.
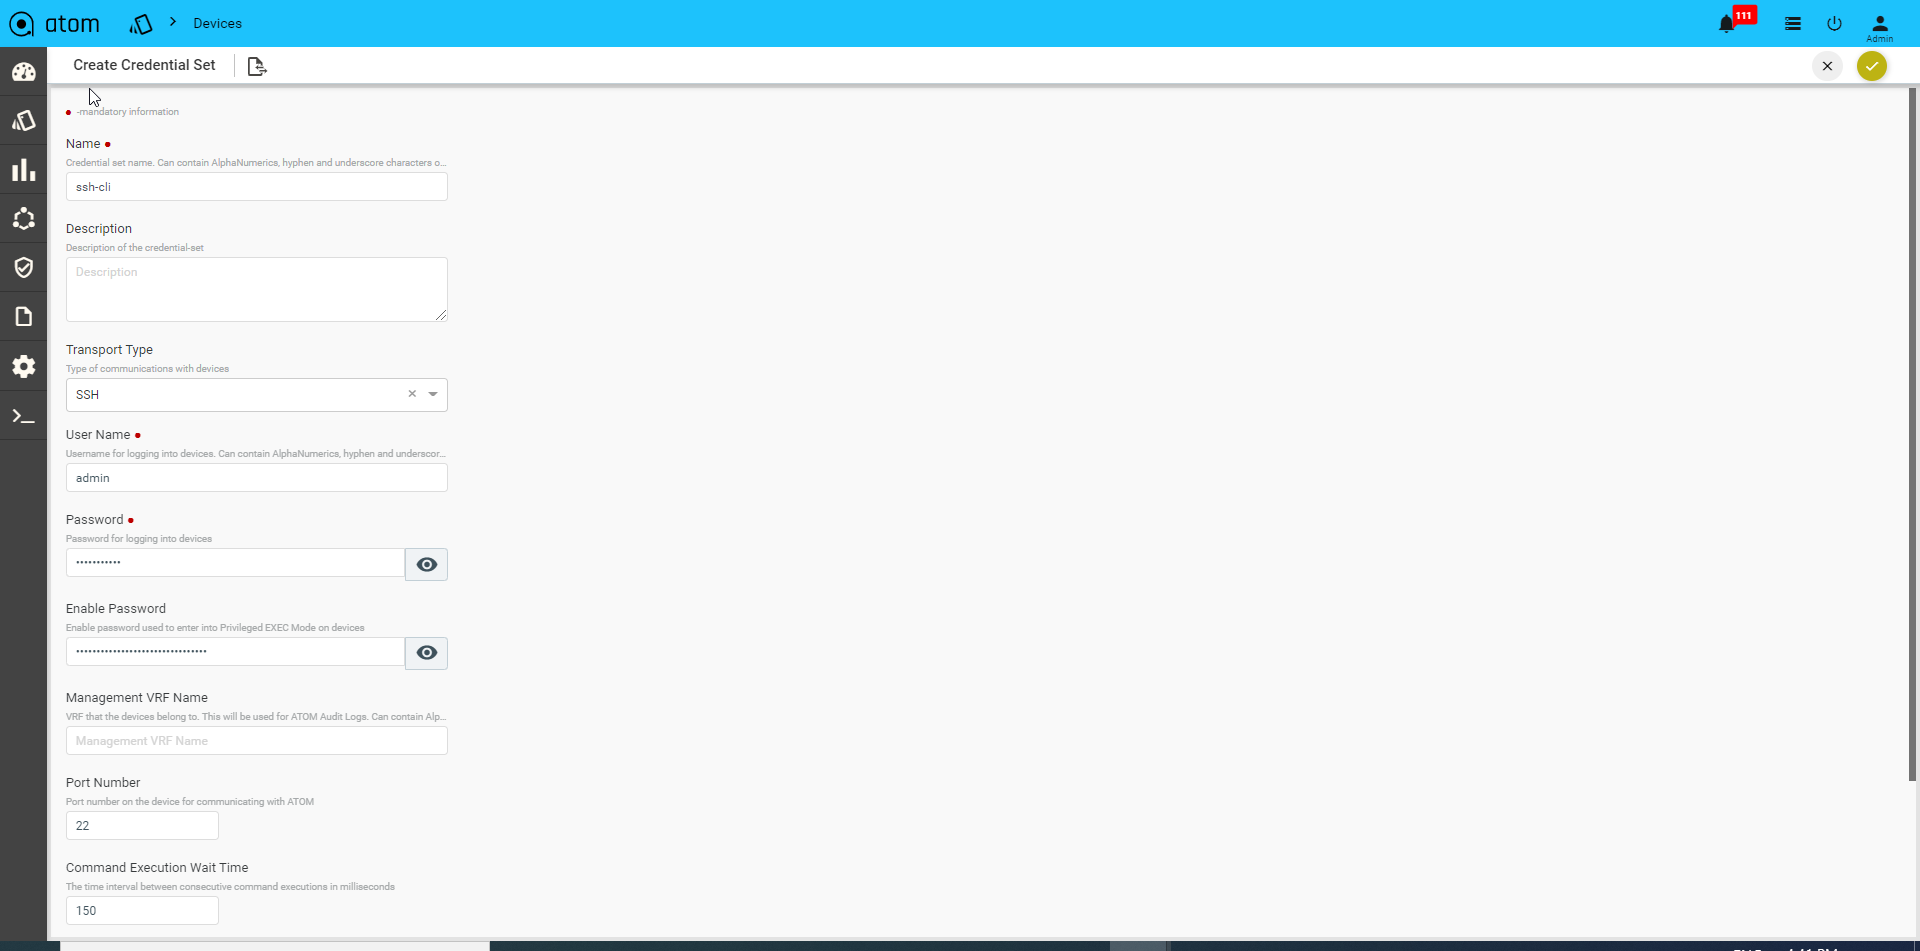
CLI Device(SSH/TELNET) Transport Credentials:
Select Transport type as “SSH/TELNET”
- User name: Enter a string that should be used to login to the device
- Password: Enter a string that used be a password for logging into the device
- Enable Password: Enter a password to enter into the privilege exec mode of the device.
- Mgmt-VRF-Name: Enter the name of the management VRF configured on the device. This will be used by ATOM to retrieve the audit logs from the device.
- Port Number: Enter the number of the port on the device that should be used for communication with ATOM
- Command Execution Wait Time: Enter the number (in millisecs) that ATOM should wait for the consecutive commands to be executed on the device. Enter any number between 10 to 30000.
- CLI Configure Command TimeOut: Enter the time (in seconds) that ATOM should wait for the command line prompt on the device to appear. Enter any between 1 to 1200.
- Max Connections: Enter the number of max connections that can be opened for a given device at any time.
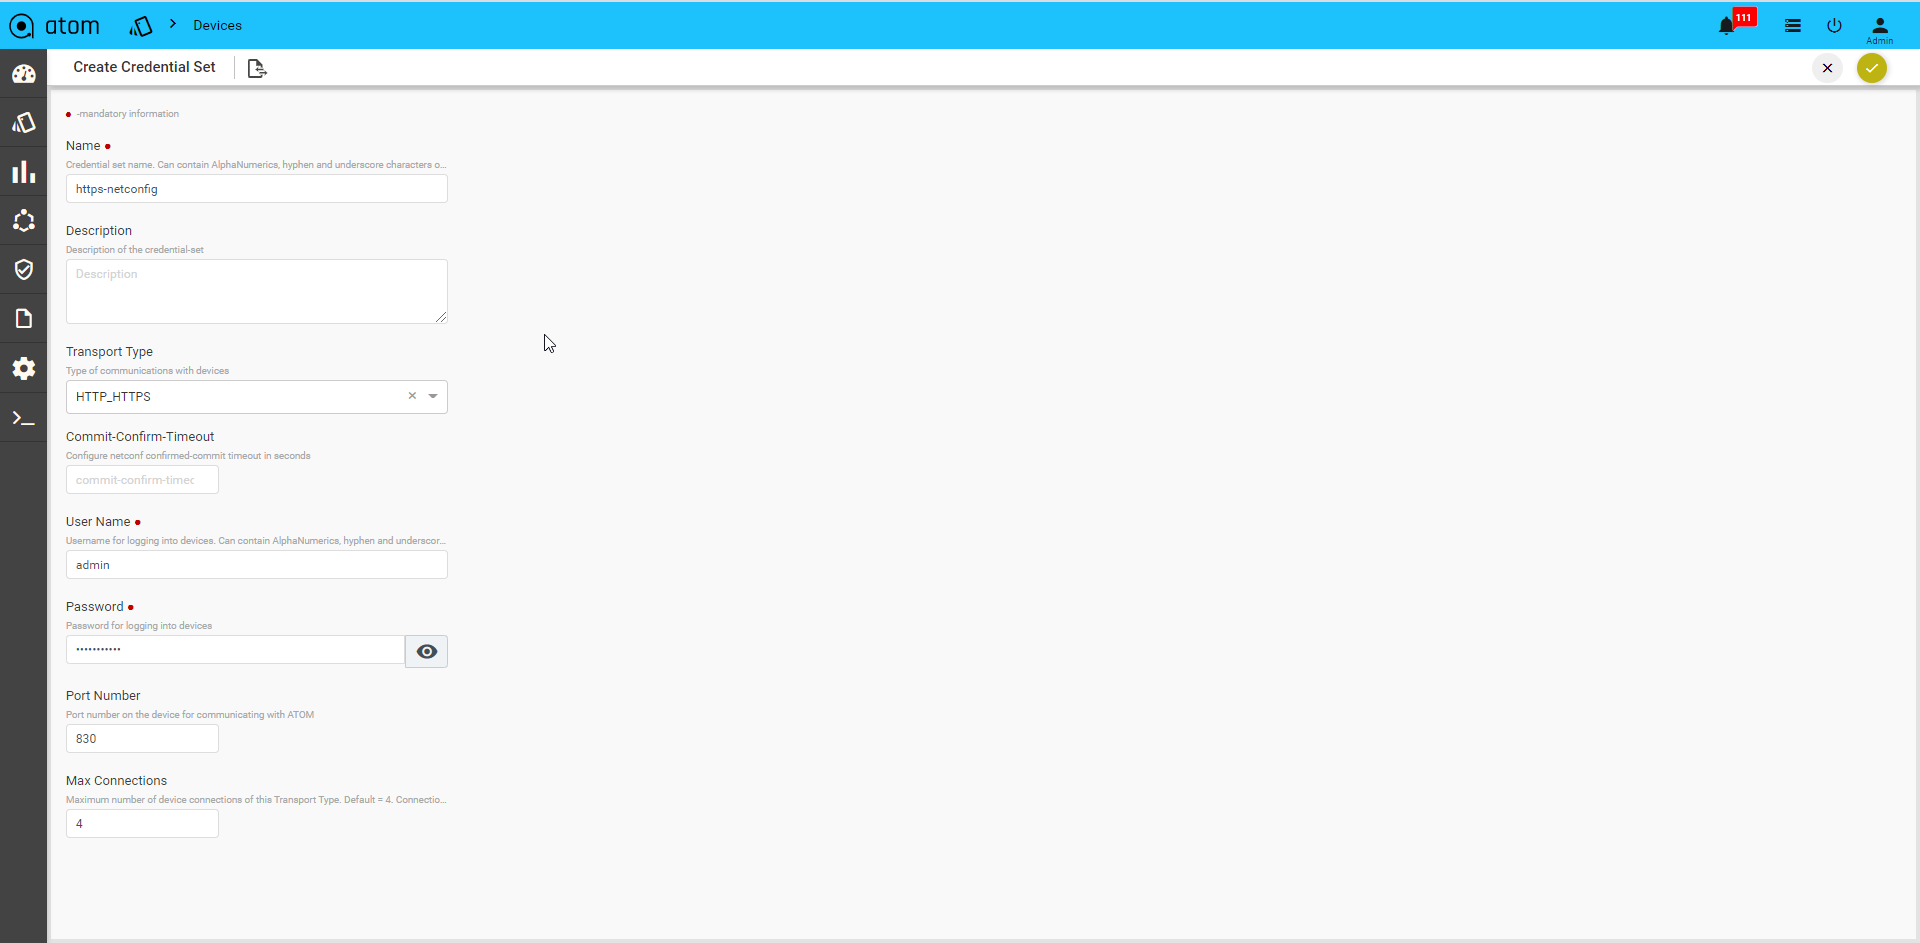
API Device Transport Credential:
Select Transport type as “HTTP_HTTPS / GRPC”
- User name: Enter a string that should be used to login to the device
- Password: Enter a string that used be a password for logging into the device
- Port Number: Enter the number of the port on the device that should be used for communication with ATOM.
- Max Connections: Enter the number of max connections that can be opened for a given device at any time.
GRPC Transport credential:
Credential Profile
By default, ATOM has the following out of the box functions:
- Config Provisioning
- SNMP
- Telemetry
- HTTP provisioning
- NETCONF provisioning
Navigate to Resource Manager > Devices > Grid View(Icon) > Credential Profile
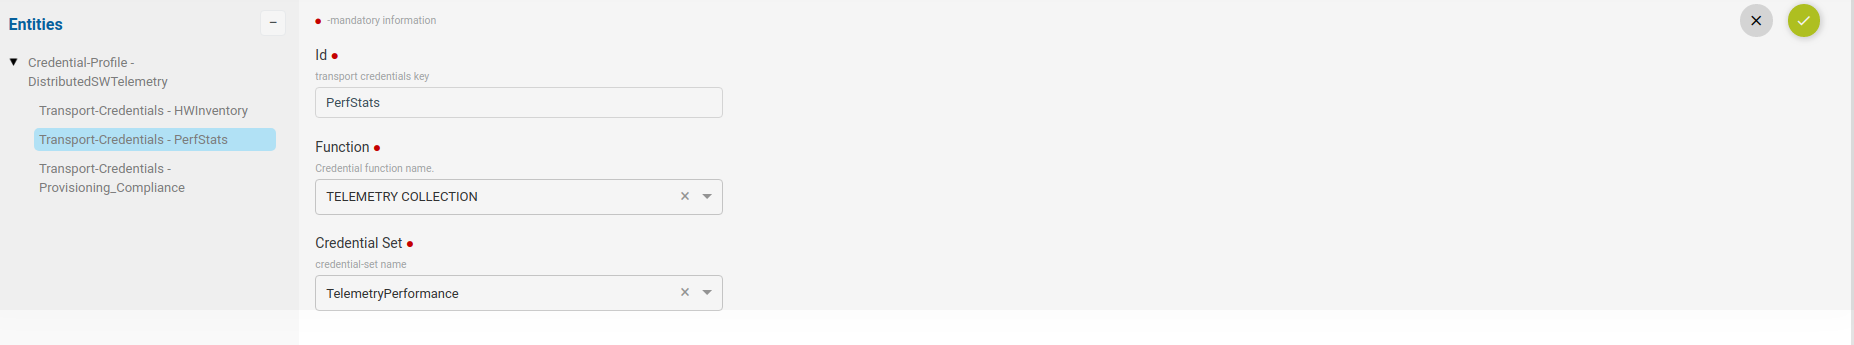
- Here, provide the name of credential profile, description and add the transport credentials by choosing the appropriate functions.
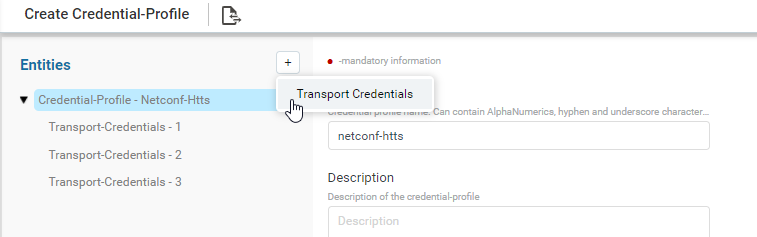
- Below is the snapshot to attach the credential set with function.
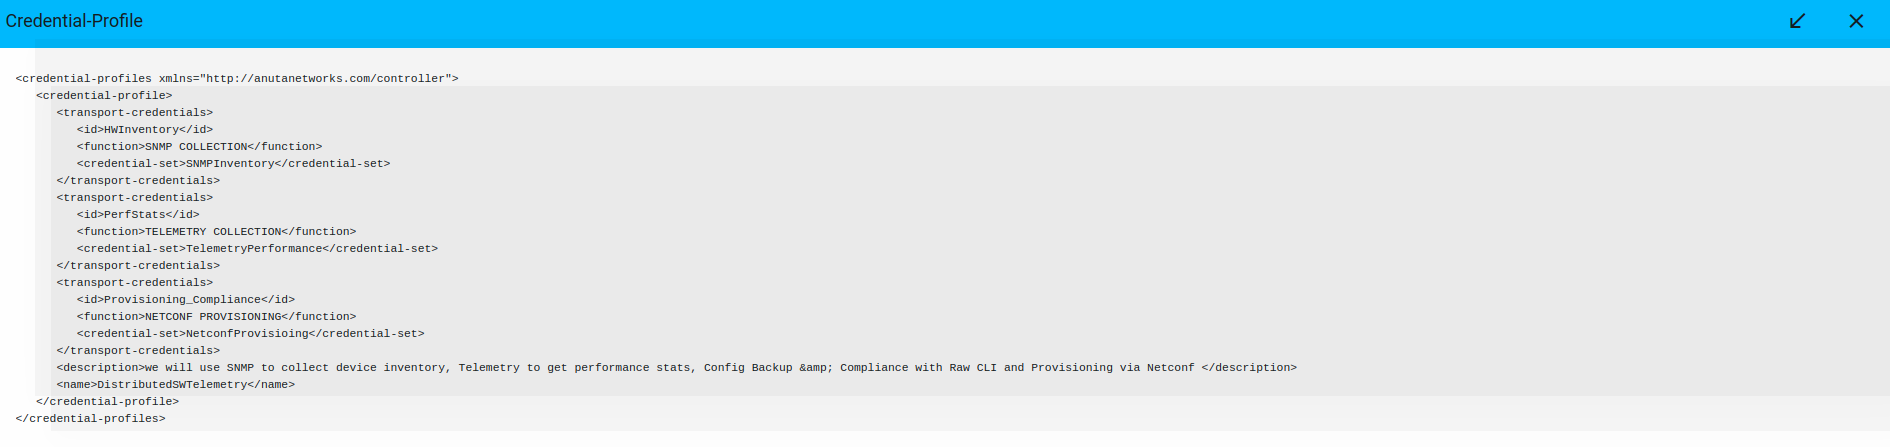
Credential profile payload in XML:
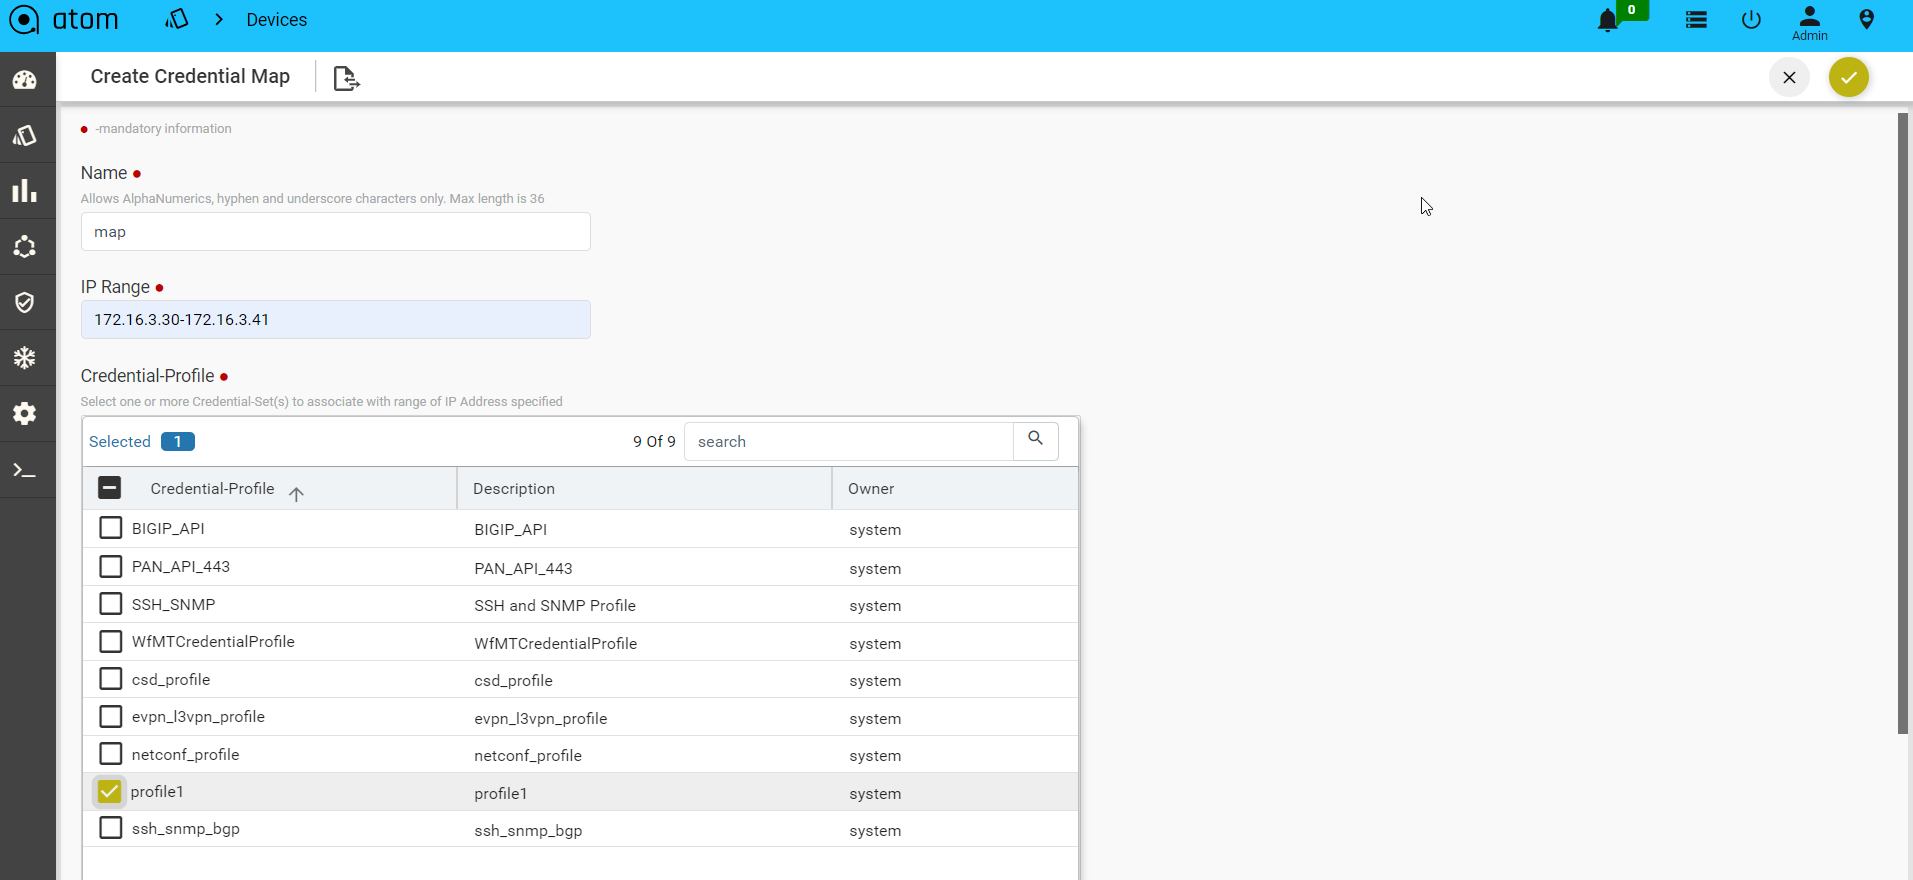
Credential Maps
Credential Map allows users to map multiple Credentials Profiles to an IP-Address range. This addresses the following use cases:
- Device Discovery – When ATOM needs to Perform Discovery using SNMP Sweep or CDP/LLDP. Since devices are yet to be onboarded, explicit assignment is not available.
- Credential profile is mandatory when onboarding a device.
When ATOM needs credentials for a device and explicit Device to Credential Profile is not available, ATOM will cycle through the IP Address range and use the first credential profile that works. The successful Credential Profile is mapped to the device. This process is repeated whenever ATOM is unsuccessful communicating with the device using the current assigned credential profile.
To create a Credential Map:
- Navigate to Resource Manager > Devices > Grid View(Icon) > Credential Maps
- Create/Edit Create Credential Map:
- Name: Enter a name for the Credential Map
- Start-IP-address: Enter an IP address in the range from which ATOM starts the sweep for locating the devices.
- End-IP-address: Enter an IP address in the range beyond which ATOM will not continue the sweep for locating the devices.
| Note: The Start and the End IP address are the range of IP addresses of the devices. |
- Credential Profile: Select one or more Credential Profiles shown.
Device Onboarding
Devices can be onboarded into ATOM using an API, Manually through User Interface of Discovery using CDP/LLDP.
Discovering Devices
Devices discovery is covered in section – Device Discovery
Adding Device Manually
We may have scenarios where device discovery is not viable. Some reasons below:
- Lack of support for Layer 2 discovery support on the device
- Operational/Administrative reason to not use LLDP/CDP
- SNMP Sweep discovery is not suitable – IP Address Range are not well defined, contiguous or some other reasons
Before you begin, it’s mandatory to define Credential Sets & Credential Profiles.
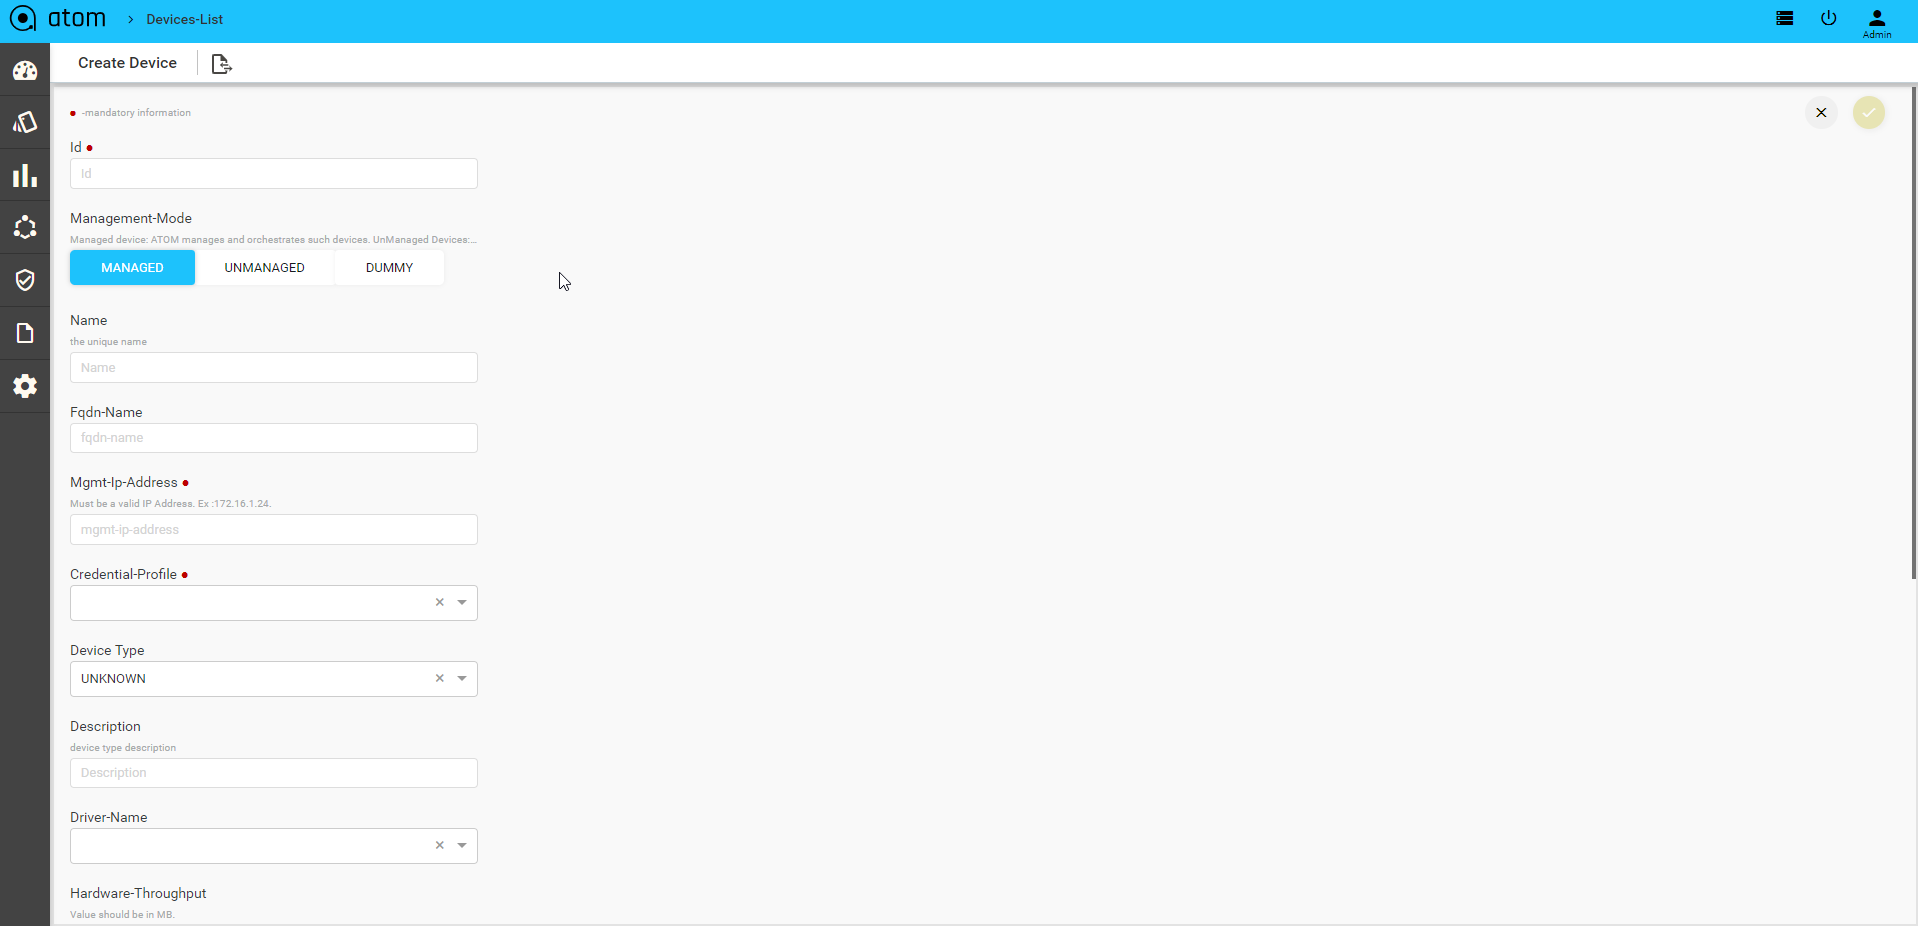
To Add/Edit a Device:
- Navigate to Resource Manager > Devices (Grid View)
- Add – Select Add action
- IP address: Enter the IP address of the device
- Credential Profile: Select the Credential Profile of the device
- Driver name: Driver can be selected for API devices.
- Latitude & Longitude: is a measurement on a globe or map of location north or south of the Equator on devices
- Modify – Select Device & Select Edit action
- Delete – Select one/more device(s) and Select Delete Action
Upon device addition, ATOM will perform the following:
Added Devices are shown in Devices grid and Device status will be shown in Green if device is SNMP reachable and ATOM is able to work with the device successfully.
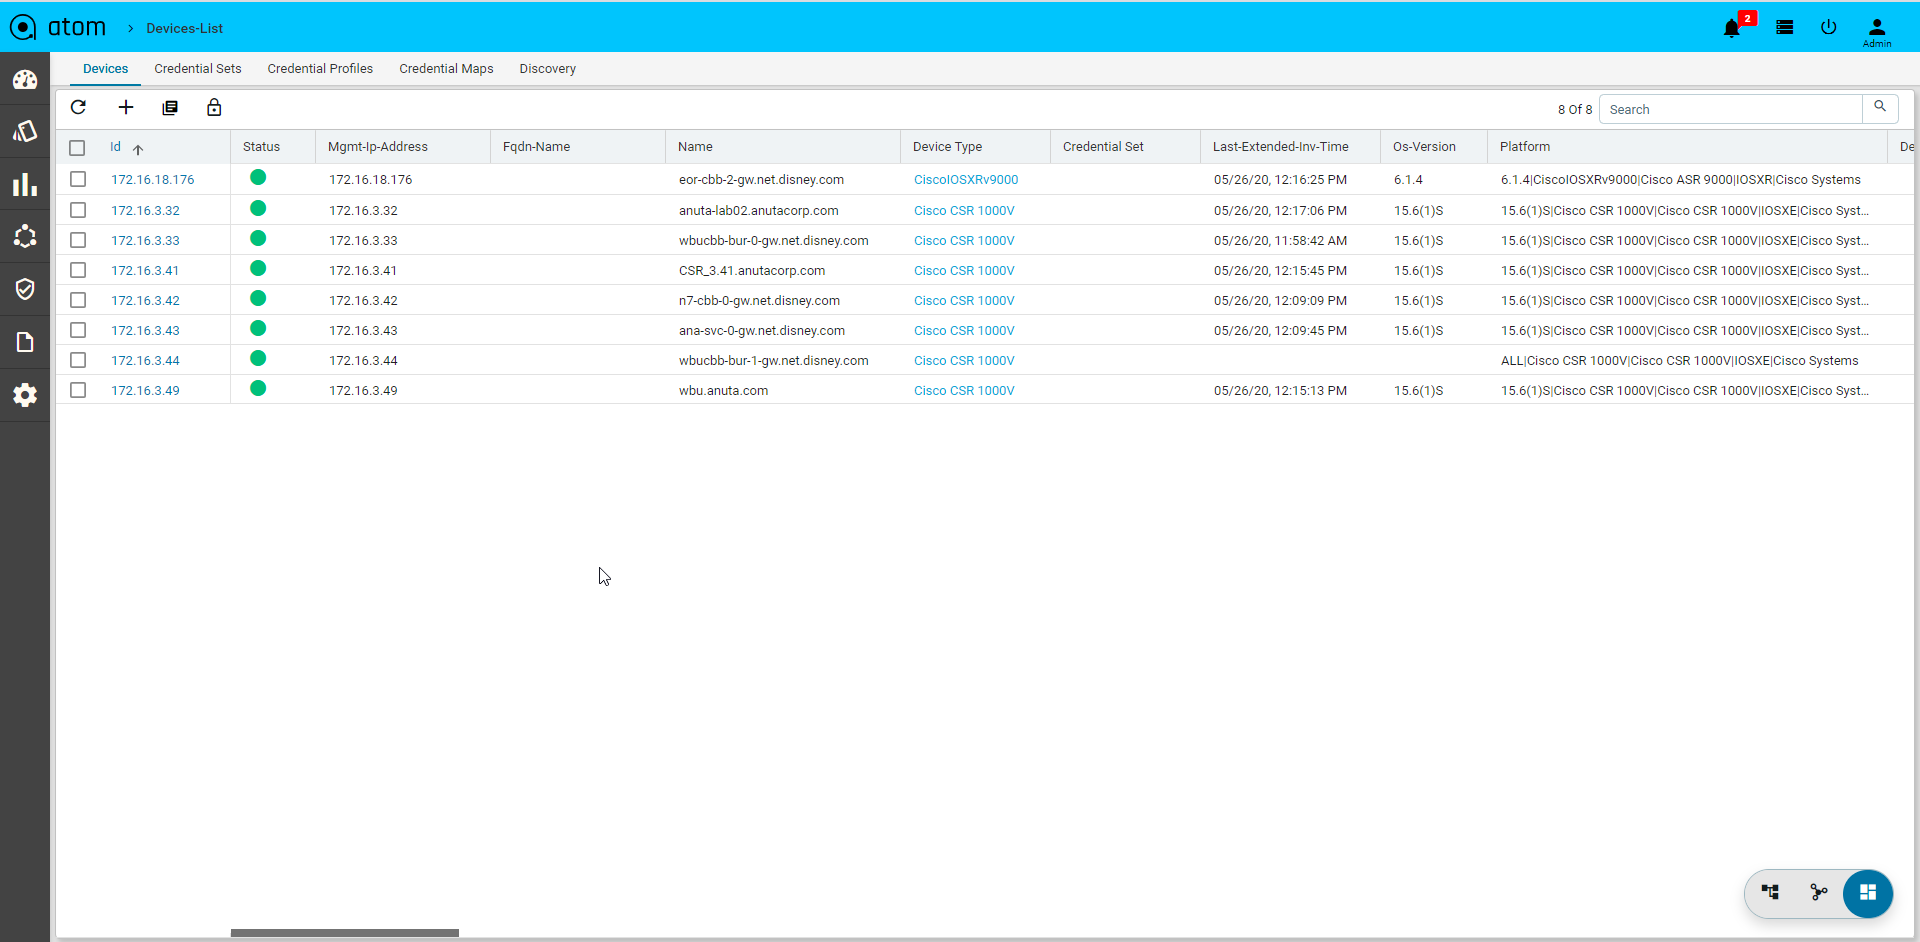
Device Views
ATOM has 3 views for the devices – Tree (Device Explorer), Topology and Grid.
- Tree View:
- Topology View
- Grid View:
Device Explorer
Device explorer view will provide the devices, its associated config and observability elements in logical hierarchy. This view contains the available device-groups and its associated devices . By default, all the devices are part of AllDevices Group.
Device group will have all the corresponding device details Each group and node will have the following sections:
- Summary : It provides the device platform, version, serial number, current operating OS, Device hardware health, Interface summary, Config compliance violations and Active alerts and recent activity.
- Configuration : it provides the entire summary of config related operations.
- Config Archive : It shows the each config retrieval, type, retrieval & parsing status.
- Changelog : provides the summary of change in configuration such as number of lines added, deleted or modified and at what time & corresponding changes.
- Config Data : it will provide the entire config tree through YANG models parsing. This is not applicable for any device group as they can have heterogeneous models based on the grouping criteria & provisioning interface such as ATOM abstract device models, OC or Native models.
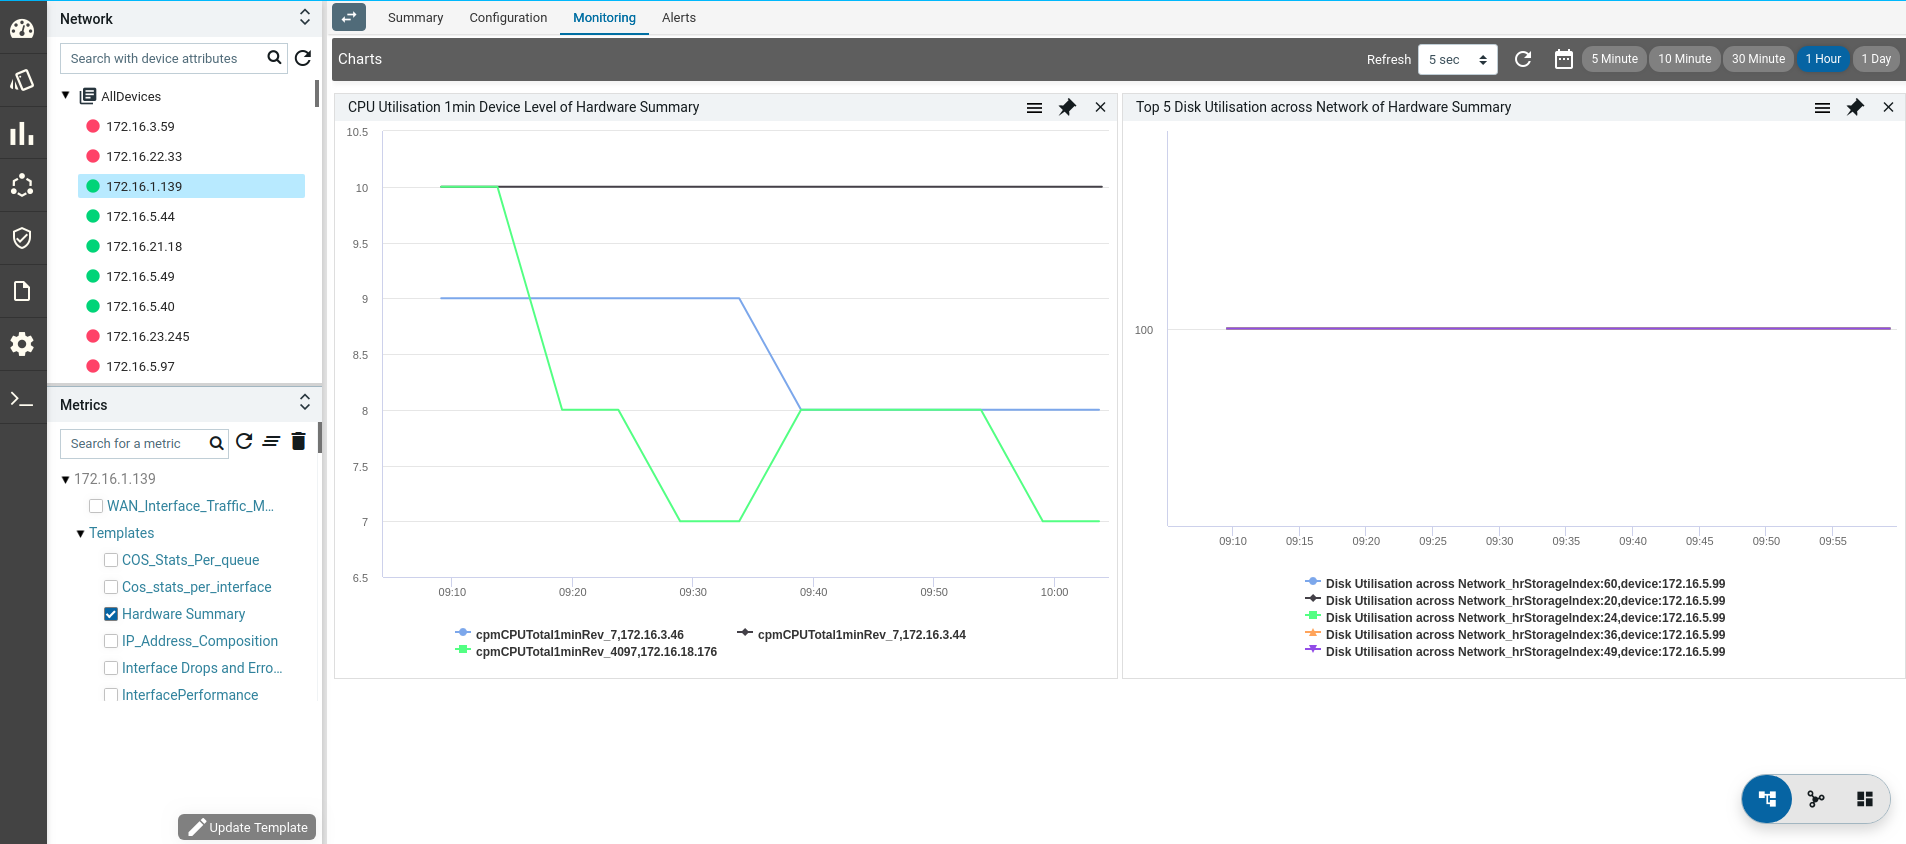
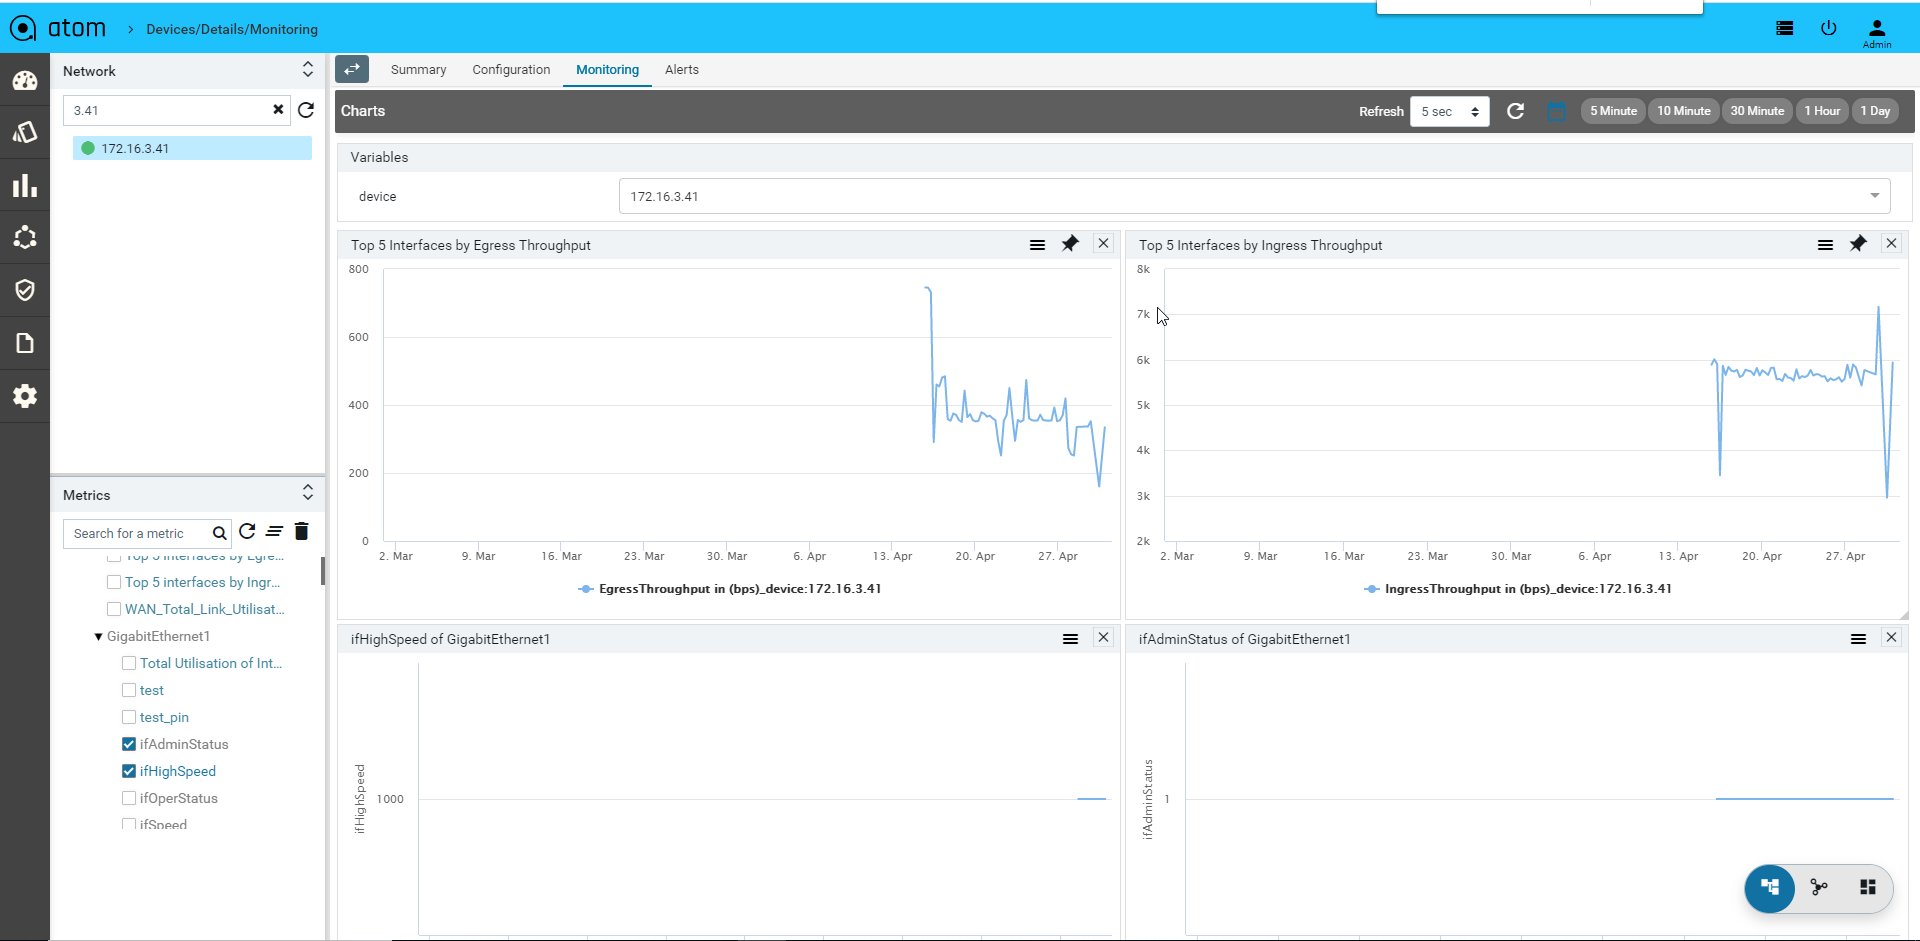
- Monitoring : It contains all possible templates & charts through inheritance from its group or node level. It will show the default template by default as its monitoring summary. Refer Monitoring Guide for more details.
- Alerts : It will show the all active alerts and its history by default. Alert filter view is also available to search & prioritise the alerts. Refer Alerting Guide for more details.
Each device-group view will have a Summary dashboard which can be customizable.
Device Actions
ATOM supports common actions on Device. These actions can be performed from Device Grid view on one or more devices or from within the Device specific view and will be discussed in Device Summary section.
Jobs & Subscriptions
Various Collection & Diagnostics jobs can be invoked.
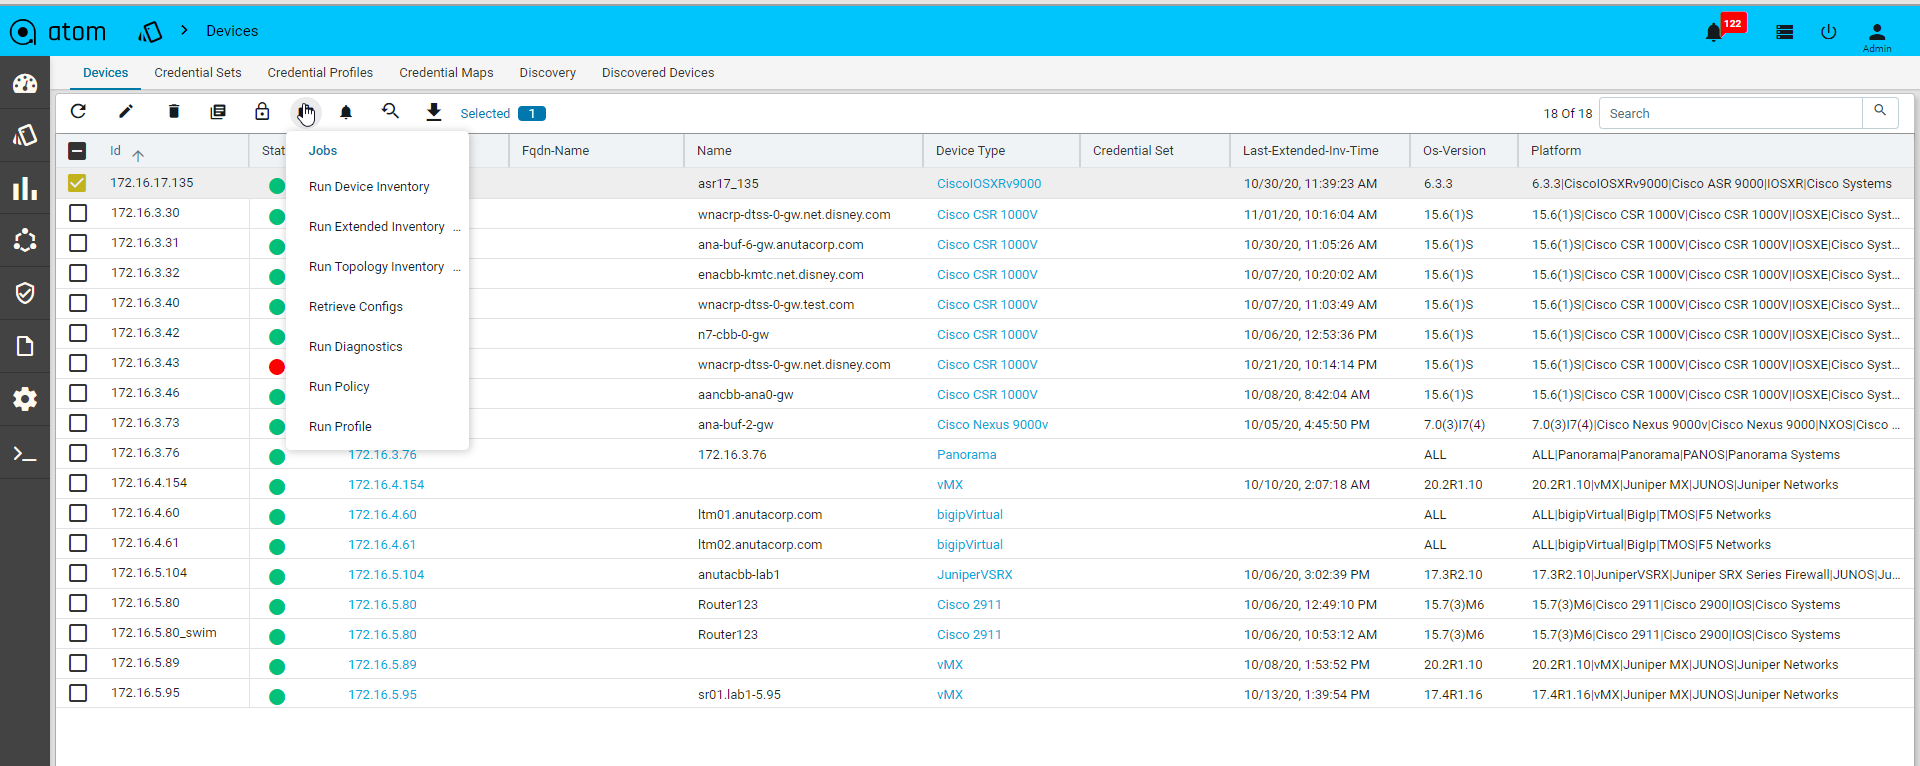
- Navigate to Devices > select one or more devices
- Click on the Jobs and select the job to run
-
- Jobs action -> Run Device Inventory
- Jobs action -> Run Extended Inventory
- Jobs action -> Run Topology Inventory
- Jobs action -> Retrieve Configs
- Jobs action -> Run Diagnostics
- Jobs action -> Run Policy
- Jobs action -> Run Profile
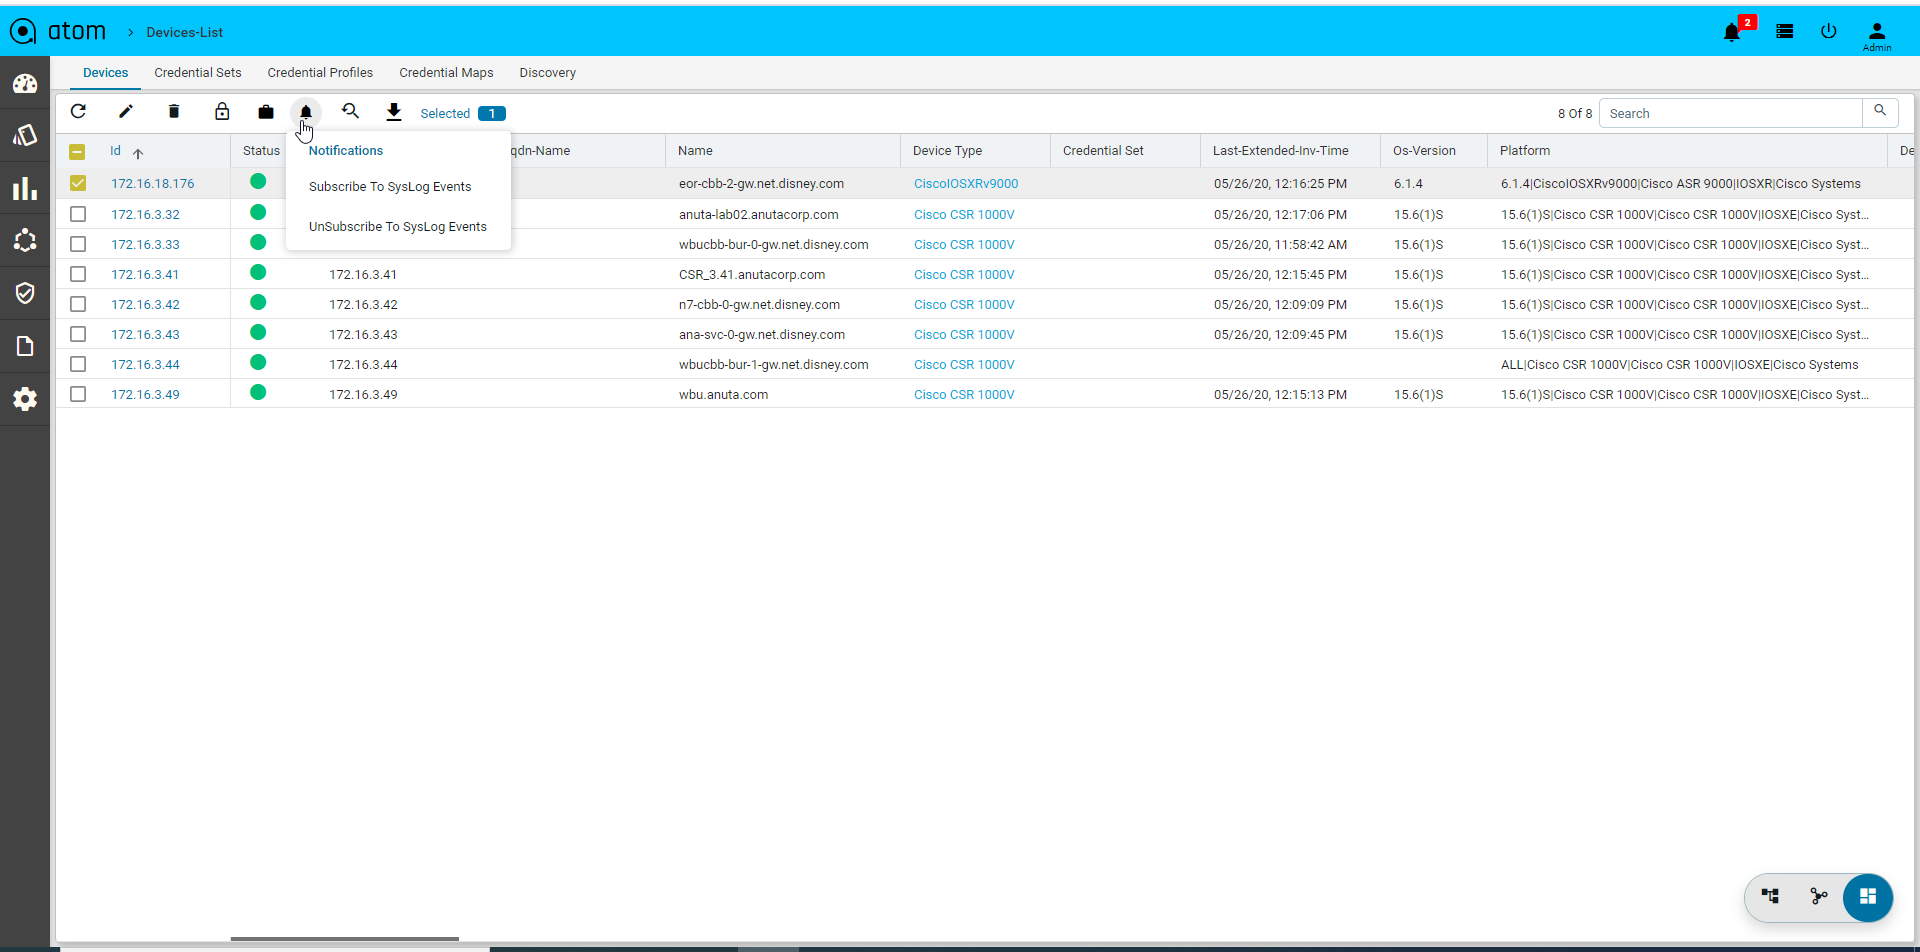
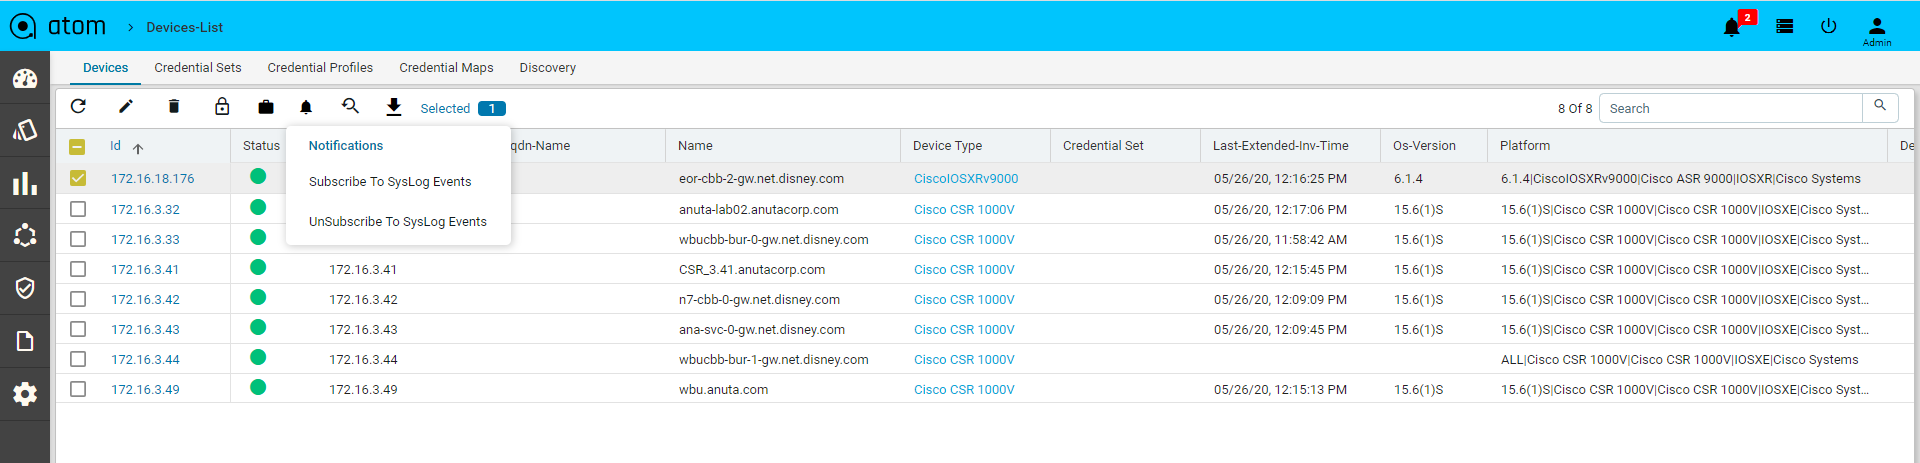
- Click on the Subscriptions to configure Syslog Subscription on the Devices
- This will result in ATOM being configured as a Syslog receiver and is a configuration change on the device.
Exporting Device Information
You can export the device information of the devices either in the XML or JSON format.
- Navigate to Resource Manager > Devices > Grid View(Icon) > Devices
- Select one or more devices
- Click the View/Download button and select either the XML or JSON
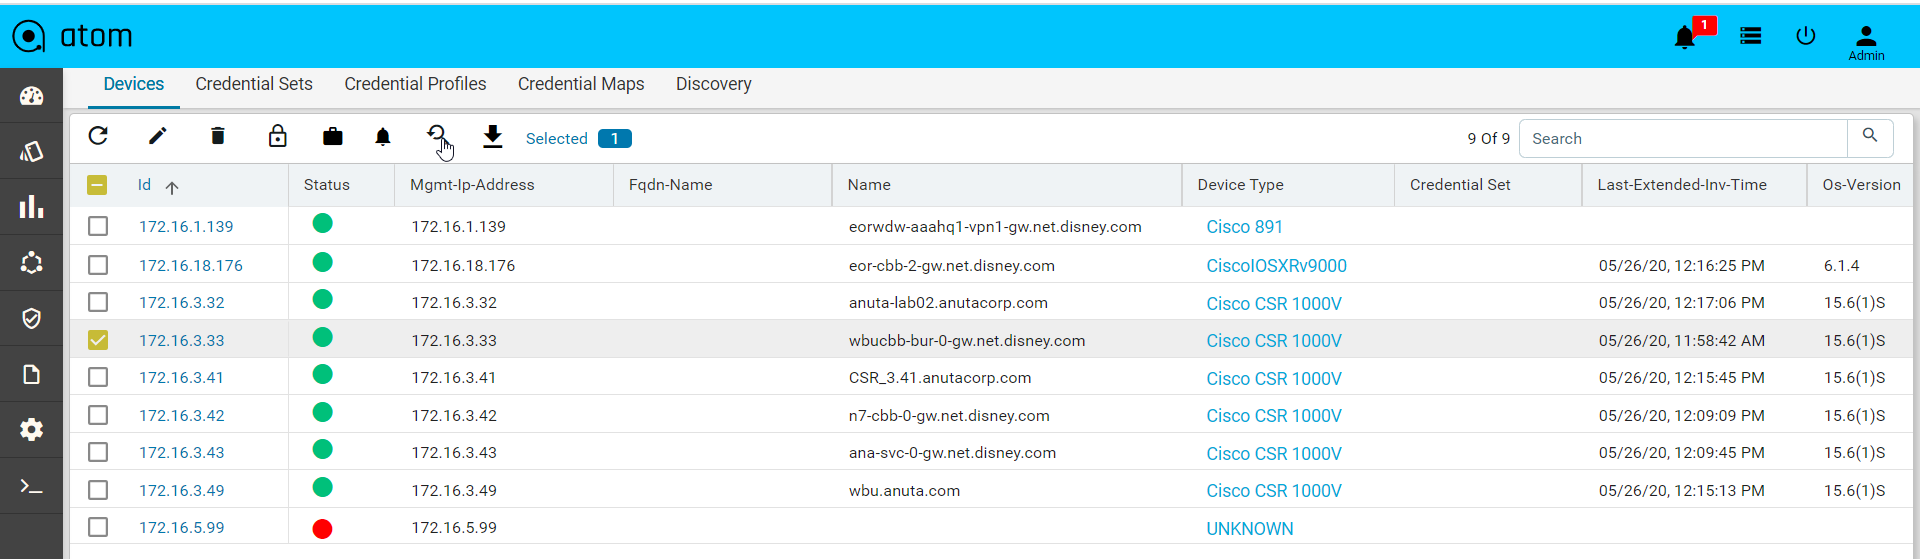
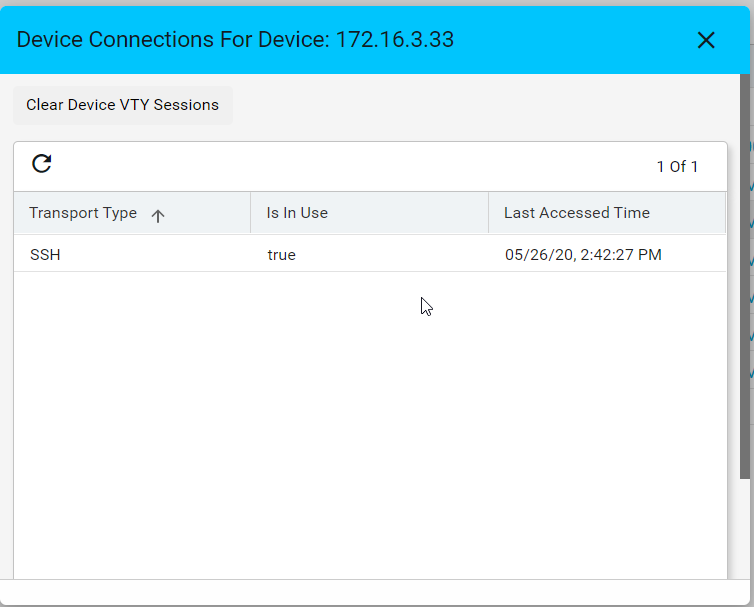
VTY Sessions
This is used to view the active vty sessions.
- Navigate to Resource Manager > Devices > Grid View(Icon) > Devices
- Select any device
- Click the VTY Sessions button
Default Jobs
Below are the jobs which run during the device onboarding process in the mentioned order.
- Device Inventory : It gathers the Platform, OS Version through SNMP and gets the Device to ONLINE. If the platform is not found in ATOM then check Platform guide on
- Device Extended Inventory : It collects the Serial Number, Interface performance, health, availability etc.,
- Device Diagnostics : ATOM will perform the reachability check through Ping, SNMP and Telnet/SSH if they are applicable.
- Base Config Pull or Config Retrieval : It will retrieve the configuration and persist in the database. Configuration will be collected if the credential function is set to Config SNAPSHOT or any of the PROVISIONING functions. Build data model flag is used to parse the configuration into YANG entities from the specified config source snapshot.
Below is the example, to backup cli and netconf xml config and parse the xml version.
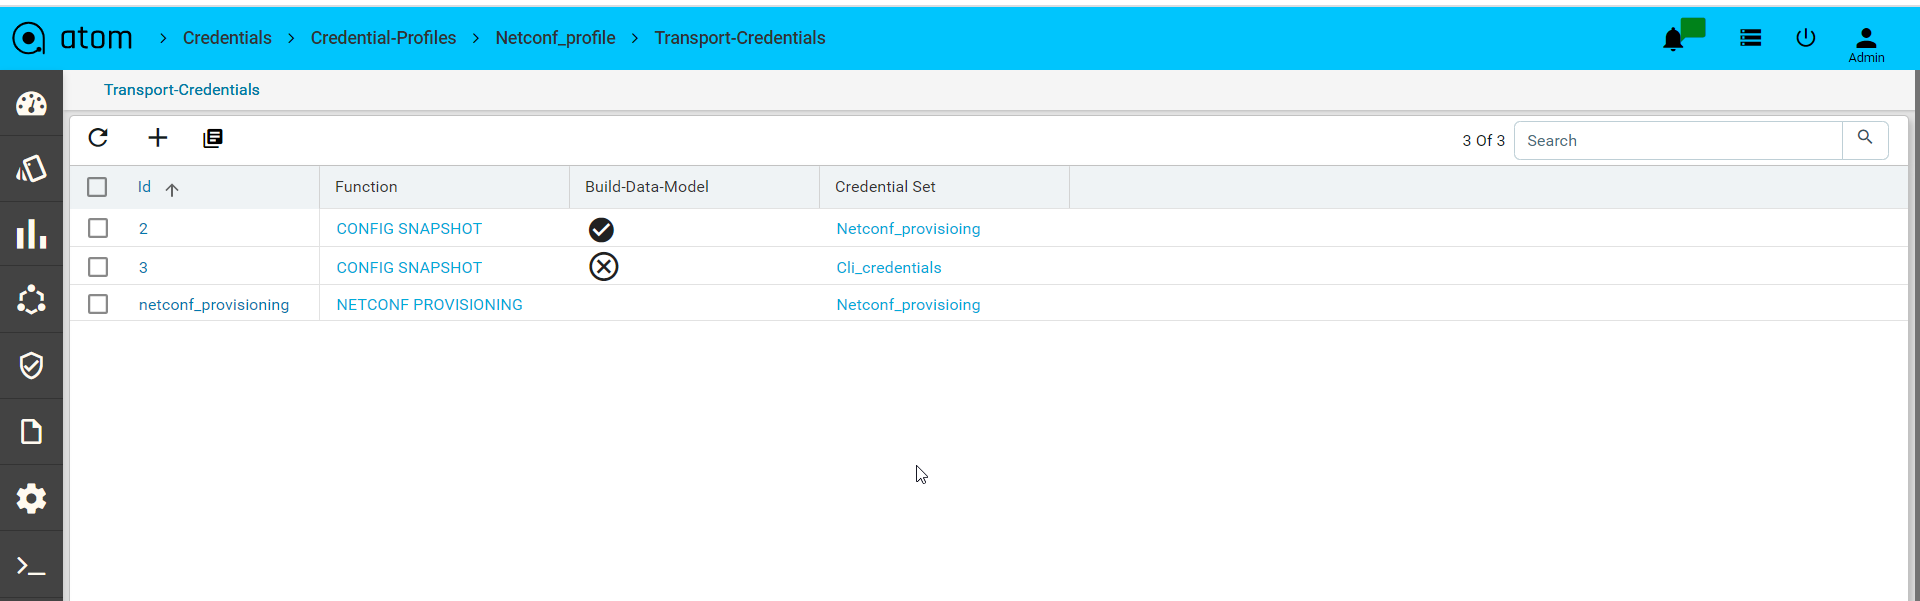
Config Type column will show us the source of config retrieval.
All the above operations can be customized for any platform as required and scheduled similar to other collection jobs.
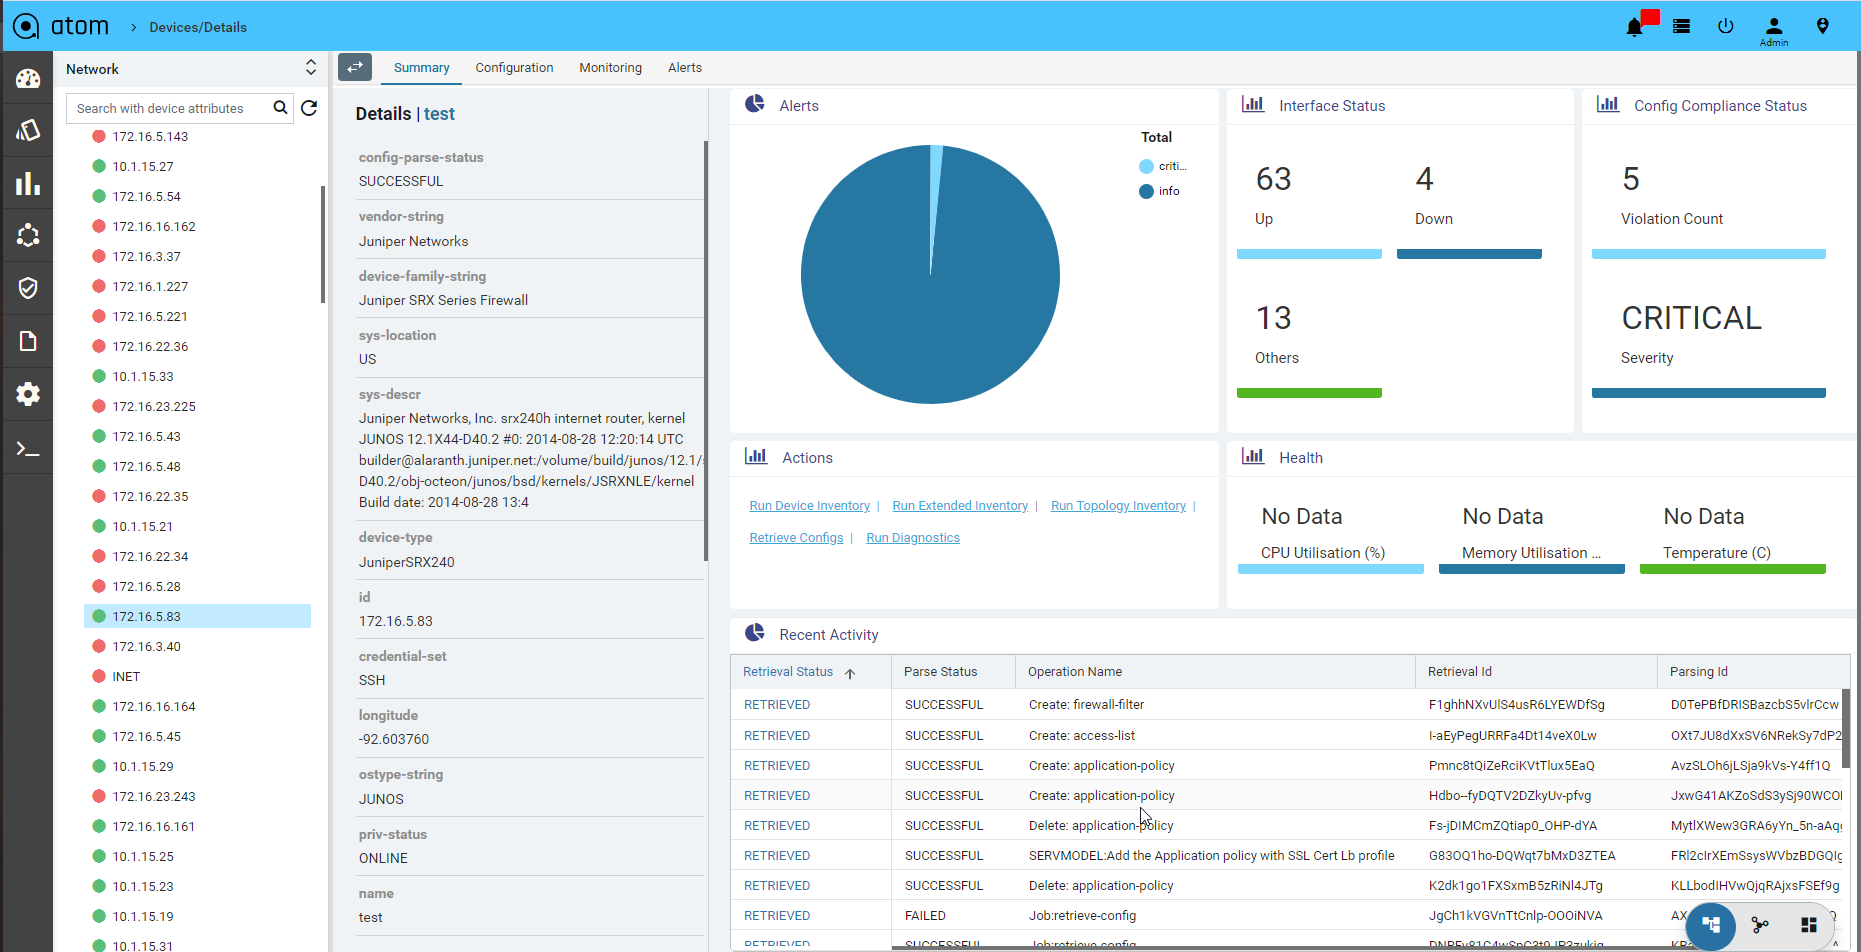
Device Summary
Device summary view provides a quick snapshot of important device attributes including Alarm summary, interface summary, recent configuration change history and health.
Device Summary also provides access to most popular device actions and quick links to frequently used activities.
- Navigate to Devices > select a device
- Click on the Device > Summary> to view the details associated with each attribute.
Configuration Management
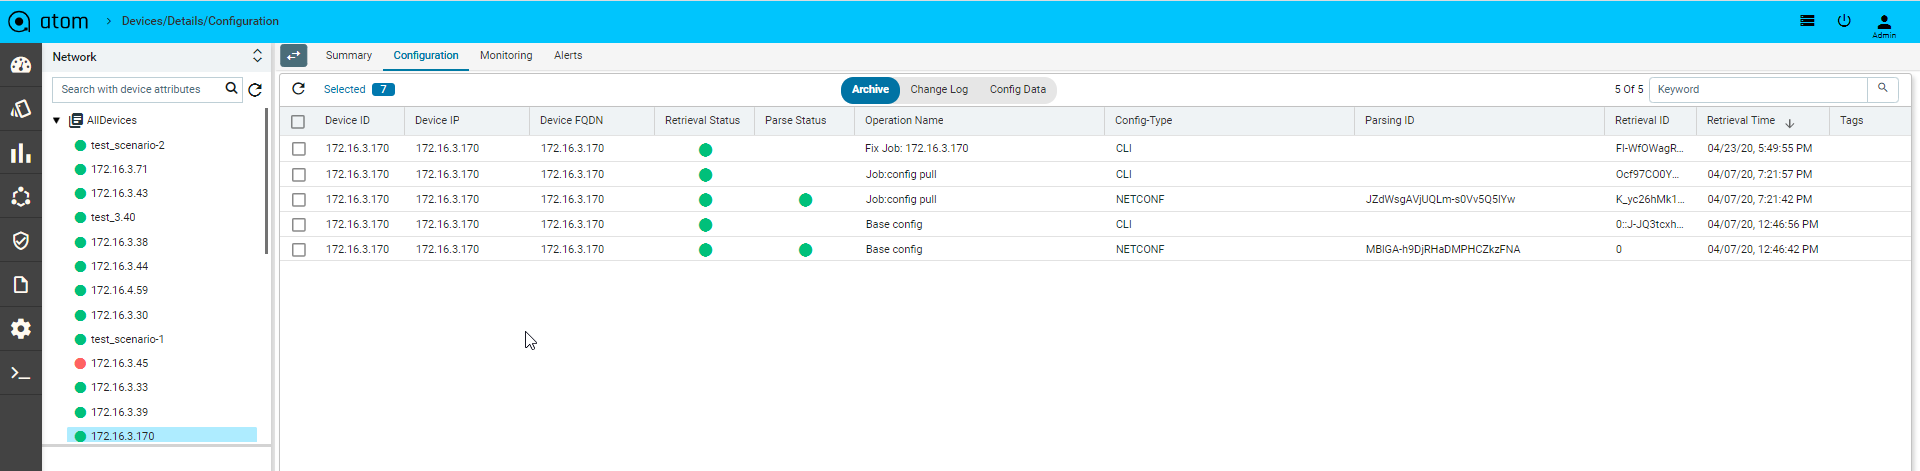
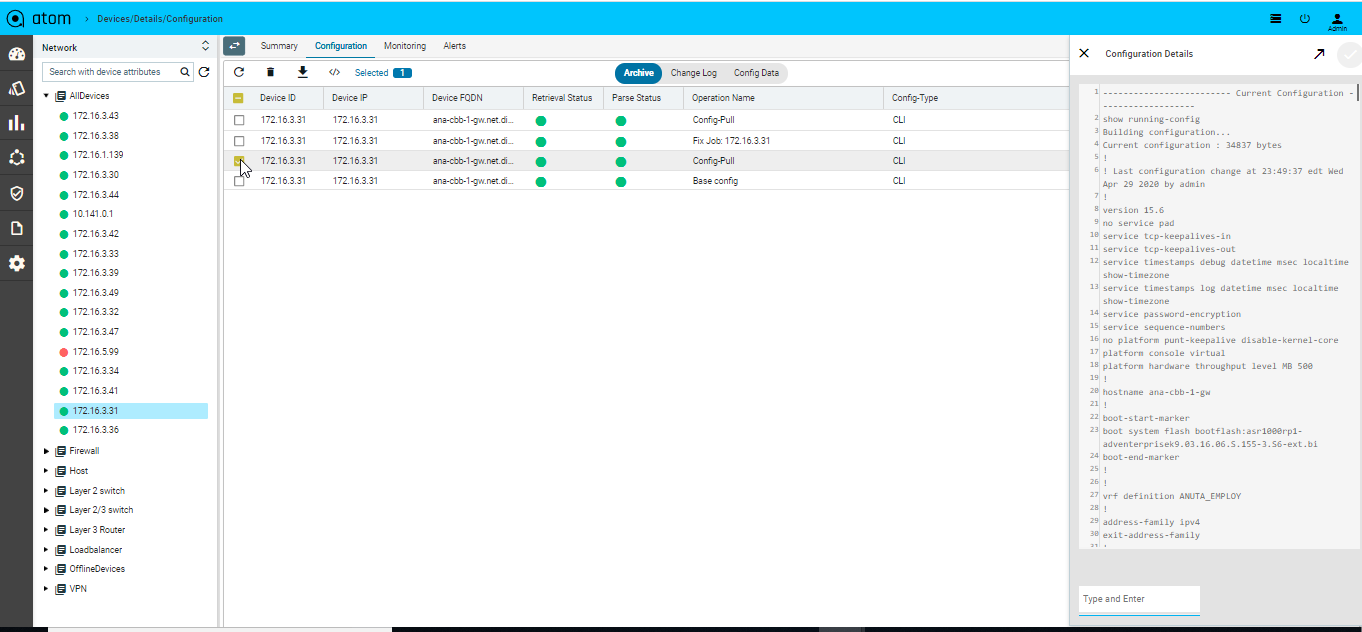
Configuration Archive
ATOM Collects Device configuration periodically as configured in Jobs->Configuration or upon a config change event from the device. To trigger configuration collection through config change notification, ATOM should be configured to receive config change notification through SNMP Trap or Syslog.
- To view Device(s) Configuration – Navigate to Devices > select a device(s)
- Click on the “Configuration > Archive” Tab
- Select an Entry in the Grid
- In Details view – CLI/XML Configuration is displayed
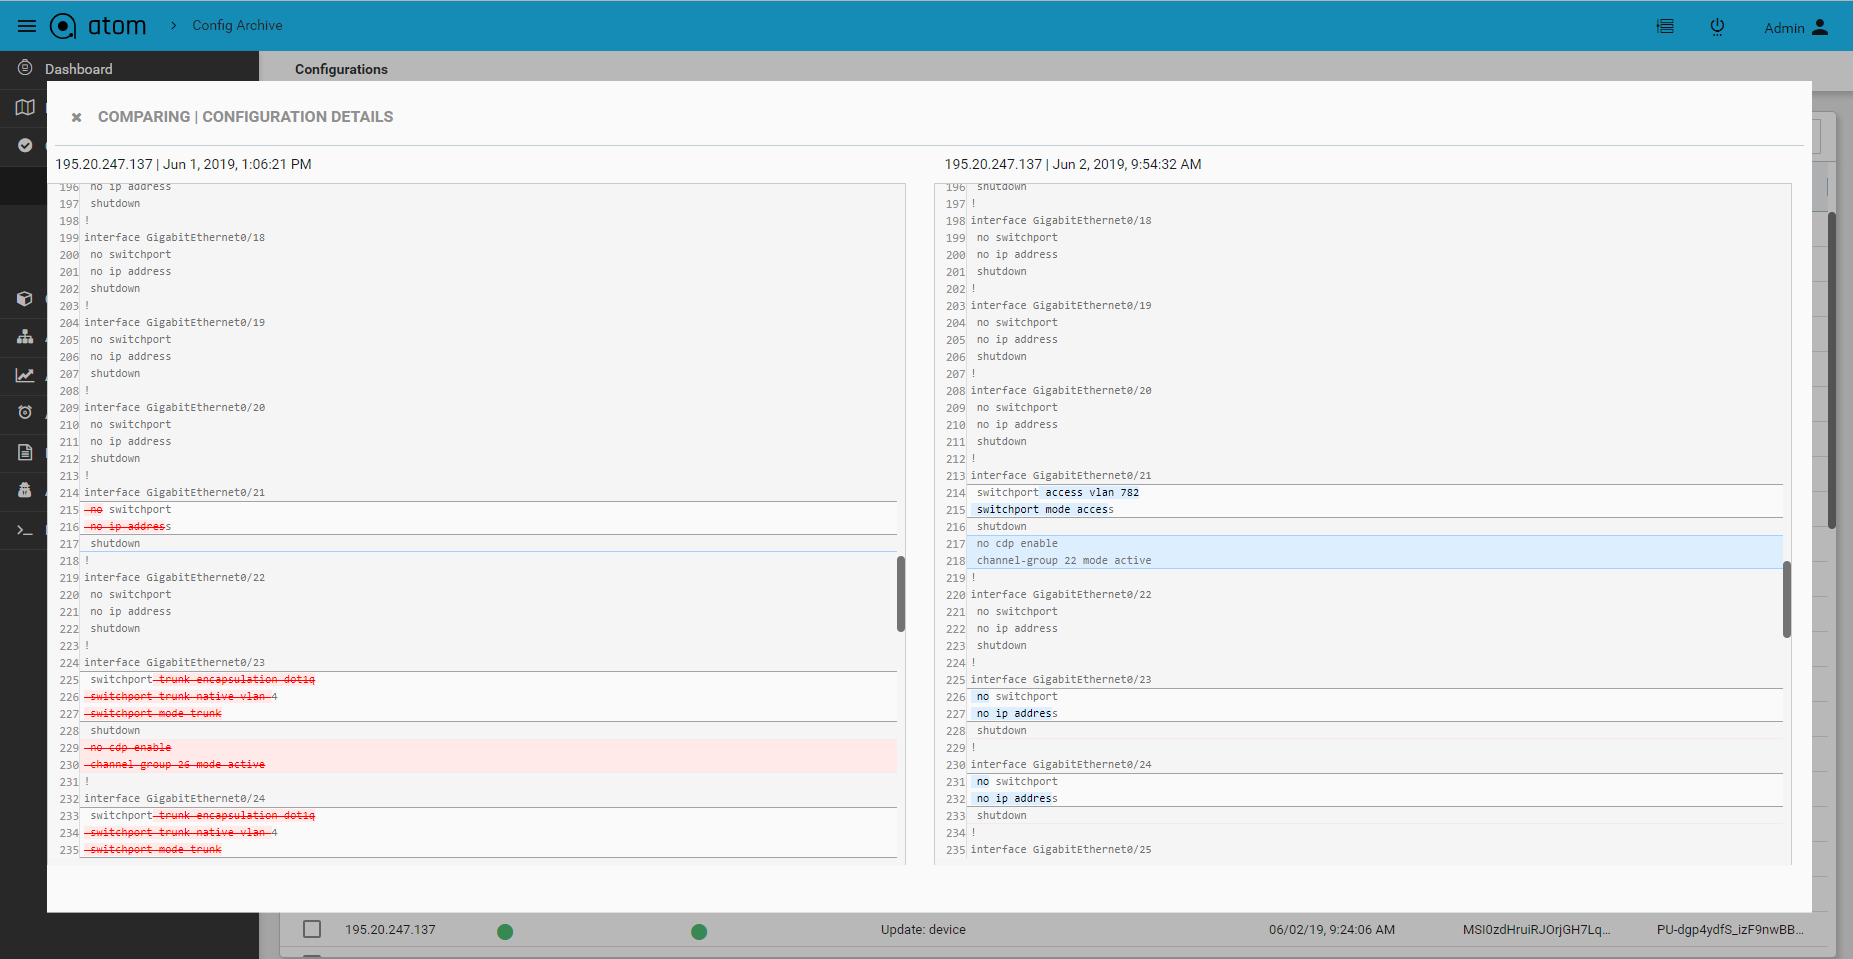
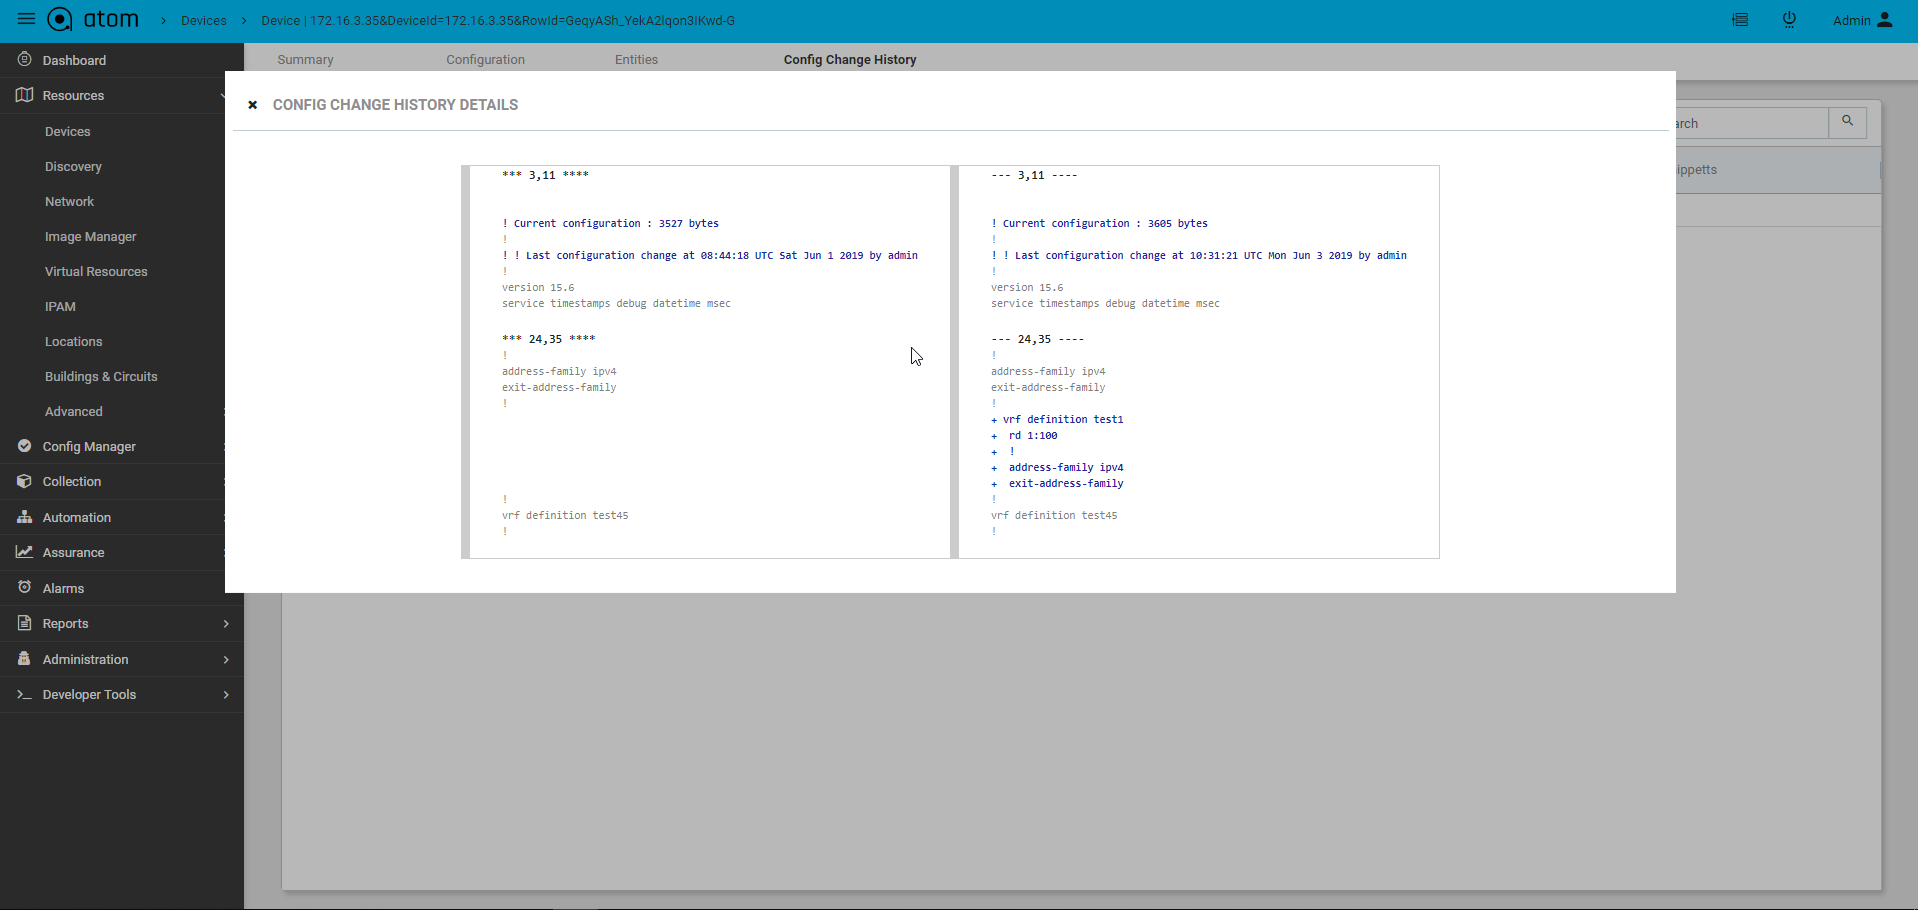
Configuration Diff
Configuration differences across various revisions can be viewed by selecting two versions from the Configuration archive grid.
- To view Device(s) Configuration – Navigate to Devices > select a device(s)
- Click on the “Configuration > Archive” Tab
- Search configuration grid using tags or other attributes
- Select two configuration revisions
- Click on “Compare” to launch configuration diff view
Configuration Tagging
Configuration version can be tagged using user provided flags or tags. This can be used for filtering and comparison of configuration revisions.
- To view Device(s) Configuration – Navigate to Devices > select a device(s)
- Click on the “Configuration > Archive” Tab
- Select an entry from the configuration revision grid
- Click on “Update Tags”
- Enter one or more tags in the lower right of the configuration details view
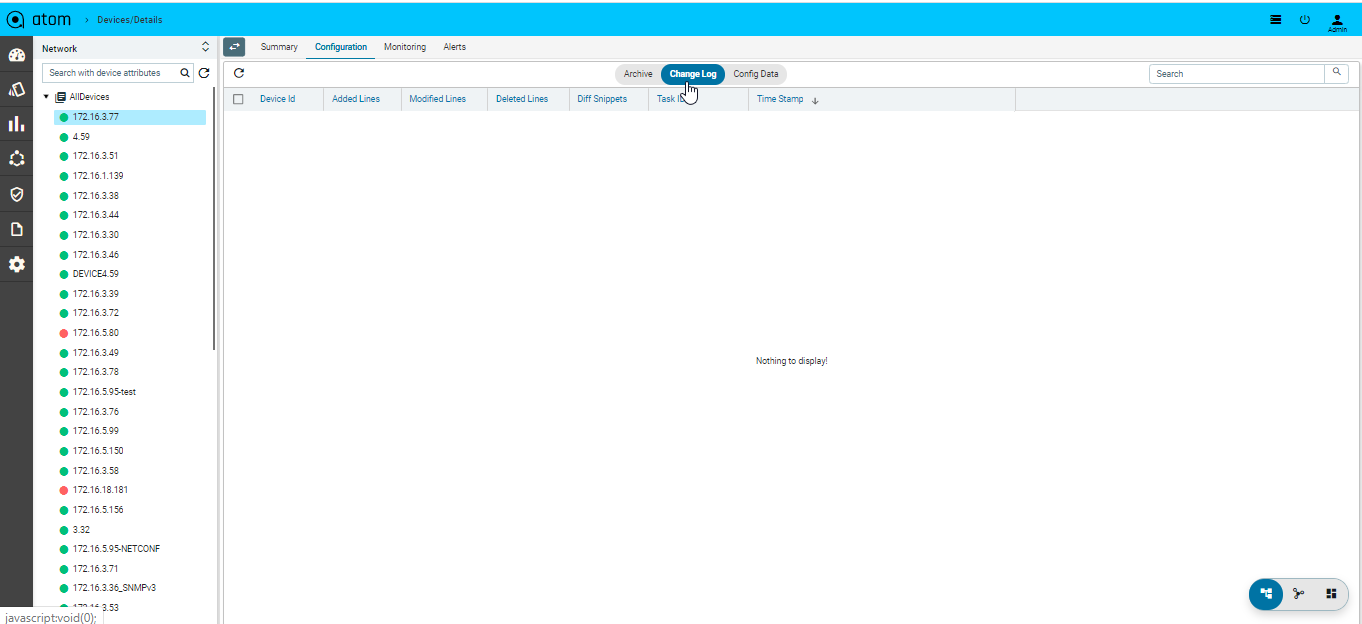
Configuration Change Log
Configuration archive provides full comparison of device configuration changes across revisions. ATOM provides another view to see only config modifications only.
This can be enabled from Admin Settings.
- Administrations > System> General settings> Admin settings
- Edit “Admin Settings”
- Set “generate-config-inventory-event” to true
Config change history for devices can be tracked as follows:
- Navigate to Devices (Tree View) > select device(s)
- Click on the “Configuration” Tab
- Click on the “Change Log” Tab
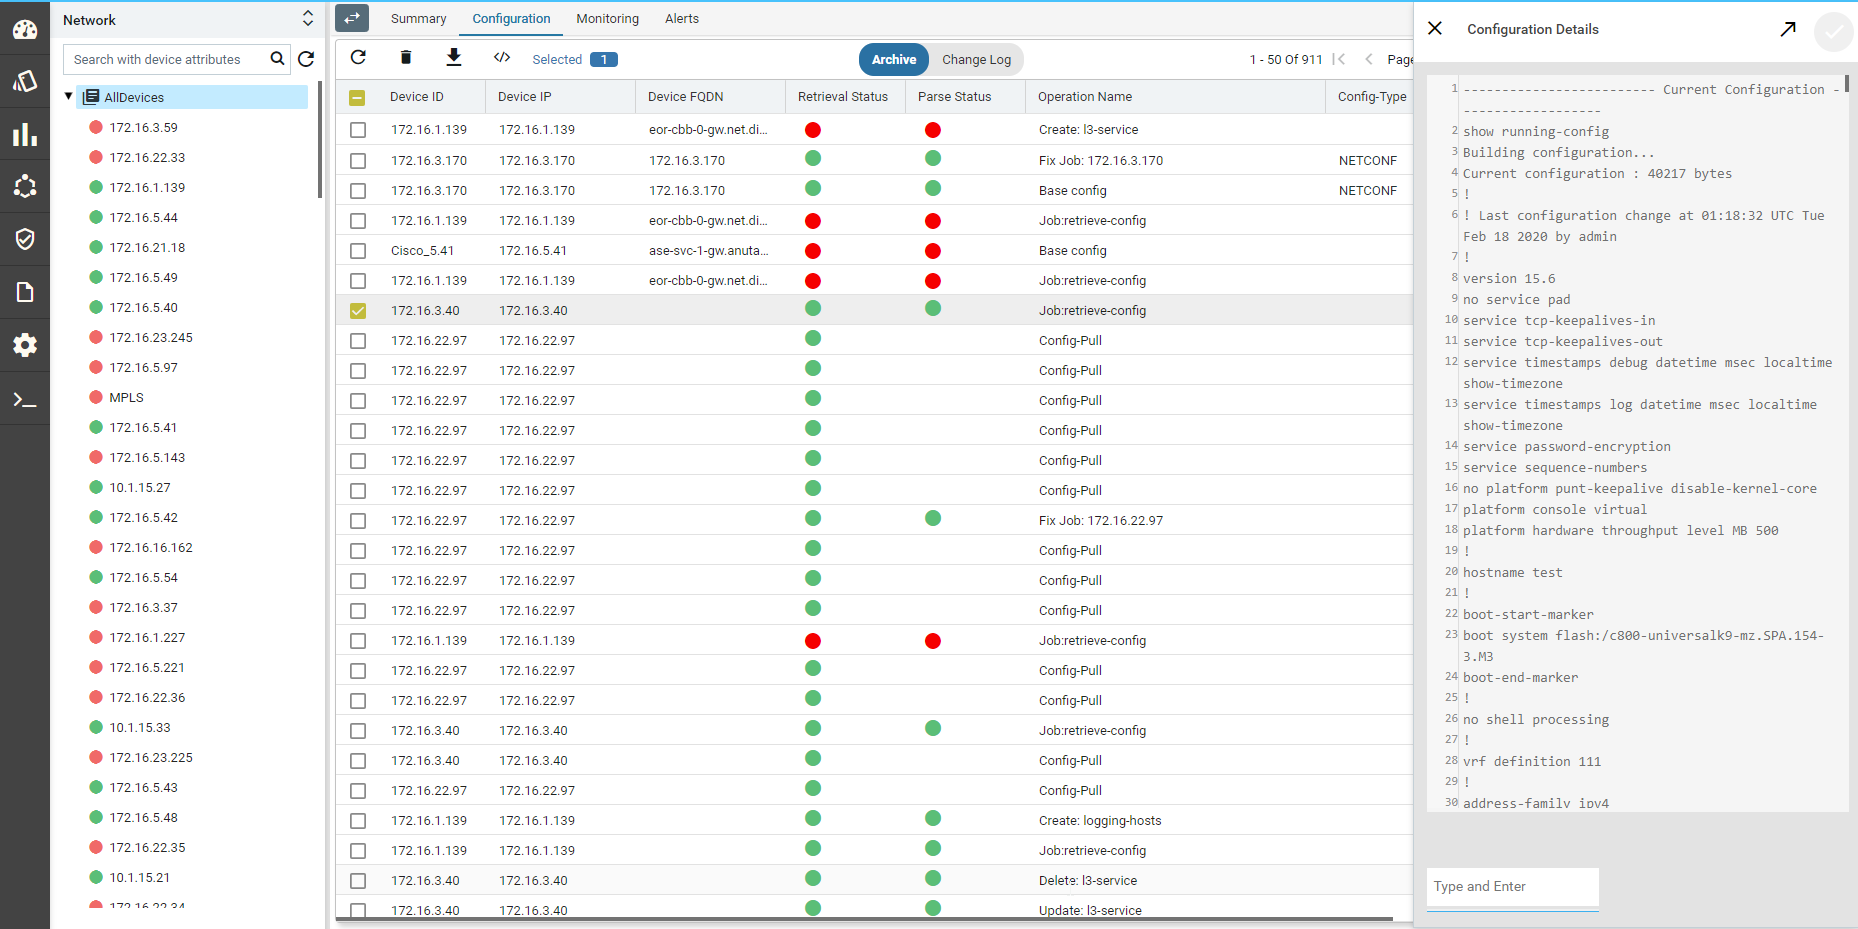
Configuration Change Management – Create/Update/Delete
Configuration archive discussed in the “Configuration Management” section provides a Read-Only view of Device CLI configuration. Additionally, ATOM provides Model driven configuration for create, update & delete. This includes the following:
- Discovery of Device configuration
- Show a tree view of the configuration
- Create/Edit/Delete of Device configuration
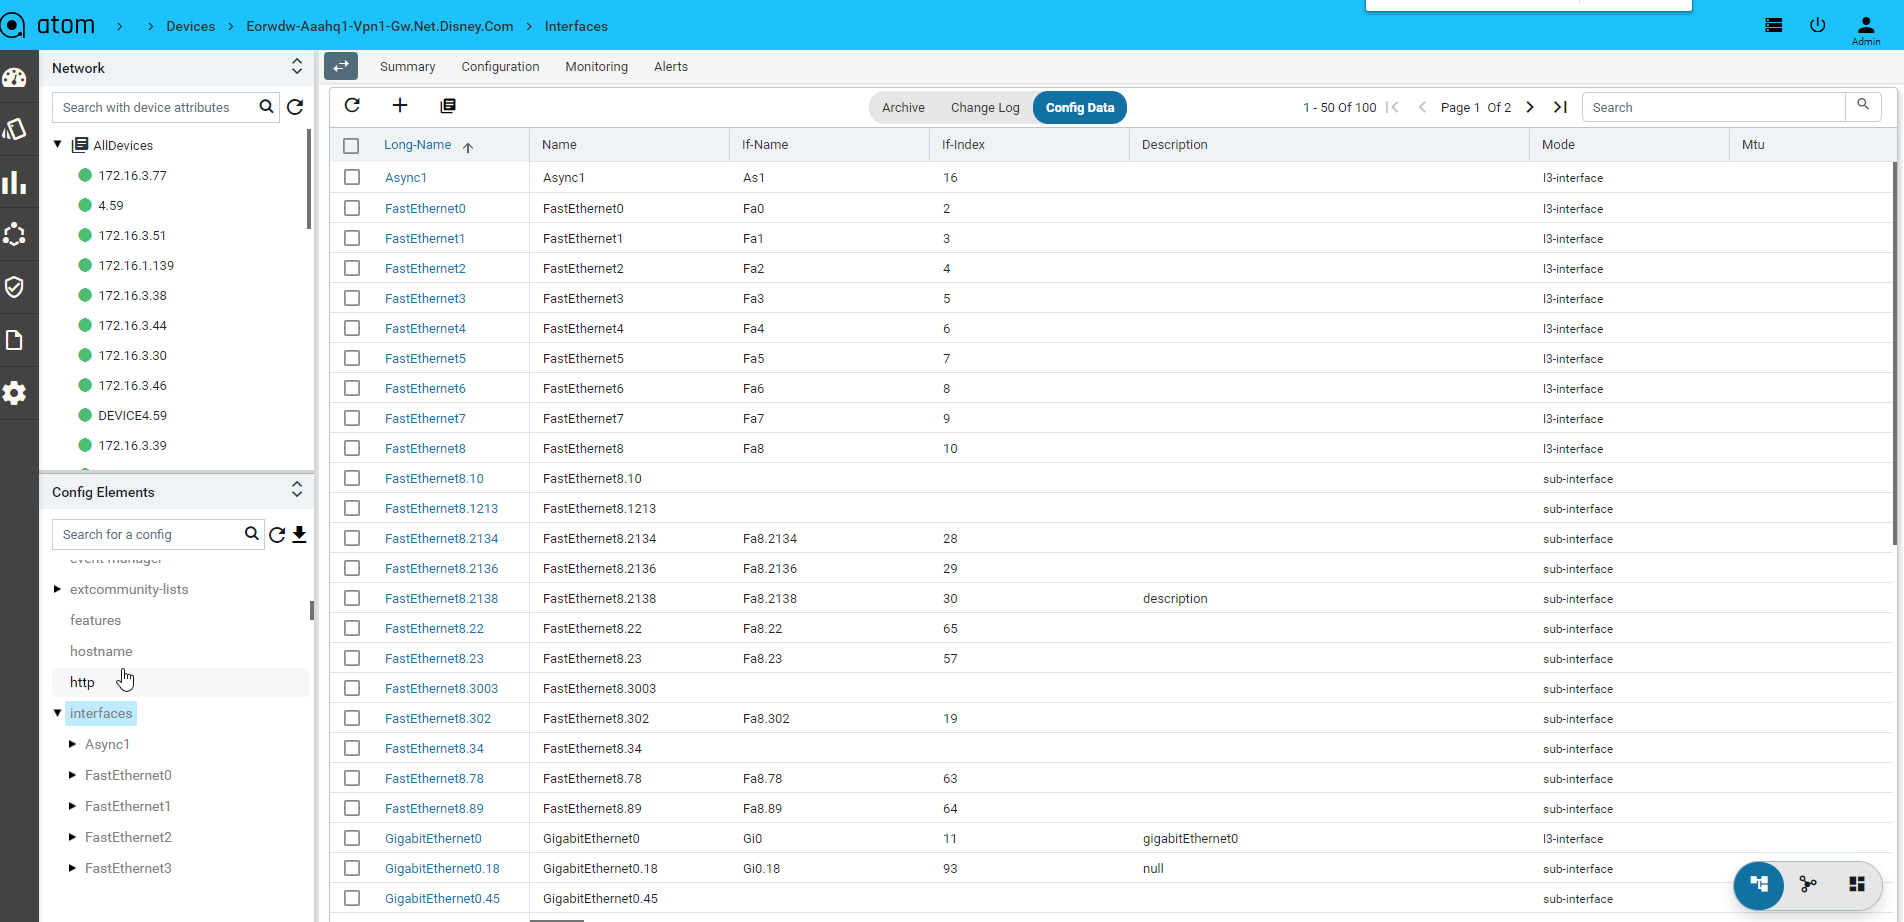
Configuration Editing can be done from “Config Data” view:
- To view Device Configuration – Navigate to Devices > select a device
- Click on the Configuration> Config Data Tab
- From the Tree view select a node and possible operations are shown on the right hand side
Note: Create/Edit/Delete from here will send configuration instructions to the device. ATOM should be set to interactive mode from the Administration page.
Device Inventory (SNMP)
All Device inventory collected through SNMP Collection job is shown in Entities view. Following provides guidance on
- To view Device Configuration – Navigate to Devices > select a device
- Click on the “Monitoring” Tab
- Collected data will be shown under MIB-name
Adding Unmanaged devices
Some devices, with feature capabilities such as L2 only, L2 and L3 both, L3 only, can be manually added to the Devices table. Such devices are not managed by ATOM and it does neither generate configurations nor push any configurations on them. Multiple unmanaged devices can be on‐boarded into the resource pool and each such device can be used during service instantiation.
To add an Unmanaged device, do the following:
- Navigate to Resources > Devices > Add Device
- In the Create device screen, select the Unmanaged option
Enter values in the following fields:
- Host Name: Enter a name for the device
- Device Capability: Select one or more capabilities from the available list.
For example, if you want the device to behave as a L3 device, choose L3Router from the list.
- Device Type: Select the category of the device that it belongs to. 3. Add network connections between the null device and it’s peer device as follows:
- Source Interface: Select the interface, on the null device, from which the network connection should originate.
- Peer Device: Select the device, managed by ATOM, as the peer device.
- Peer Interface: Select the interface on the peer device where the network connection should terminate.
Adding Dummy devices
In some scenarios, you may have to create devices for which configurations are created as a part of a service but are not pushed to any actual device. These logical entities are termed Dummy Devices and they do not have any real world counterparts with a pingable IP address.
Monitoring
ATOM enables you to create Assurance profiles to facilitate 24×7 uptime of your network. Closed loop automation (CLA) framework allows you to define policies and remediation actions in violation of those policies.
ATOM collects operational & performance metrics from multiple data sources such as SNMP, SNMP traps, Syslog and Streaming Telemetry and stores them in a time-series database.
Following are the different activities on the metrics:
- Visualize Data Using Charts & Reports
- Alerts against thresholds defined on the Metrics
- Alert Dashboards – Collection of Predefined & User Defined Dashlets
- Alert Routing to Email, Slack etc.,
- Actions on Alerts
- Closed Loop Automation Actions on the Alerts
Please refer to “ATOM User Guide – Performance Management & Alerting” for further details.
Network Topology
Network Connections
Network connectivity is discovered between devices using Layer 2 discovery protocols – CDP & LLDP. In cases where CDP/LLDP is not supported or enabled on the device, Network connections can be added Manually using Network connections .
NOTE: Network connections should be added manually between the devices that have LACP port channels configured on them.
To add a Network Connection, do the following:
- Go to Resource Manager > Network
- Click Network Connections and click Add.
- In the Create Network Connection screen, enter the values in the following fields:
- Unique ID: This is a system‐generated ID for a network connection.
- Source Device: Select a Device (origin of the network connection)
- Source Interface : Enter a name for the interface on the source device
- Destination Device: Select a Device (the end of the network connection)
- Destination Interface: Enter a name for the interface on the destination device. A Network Connection is established between the interfaces of the source and the destination devices.
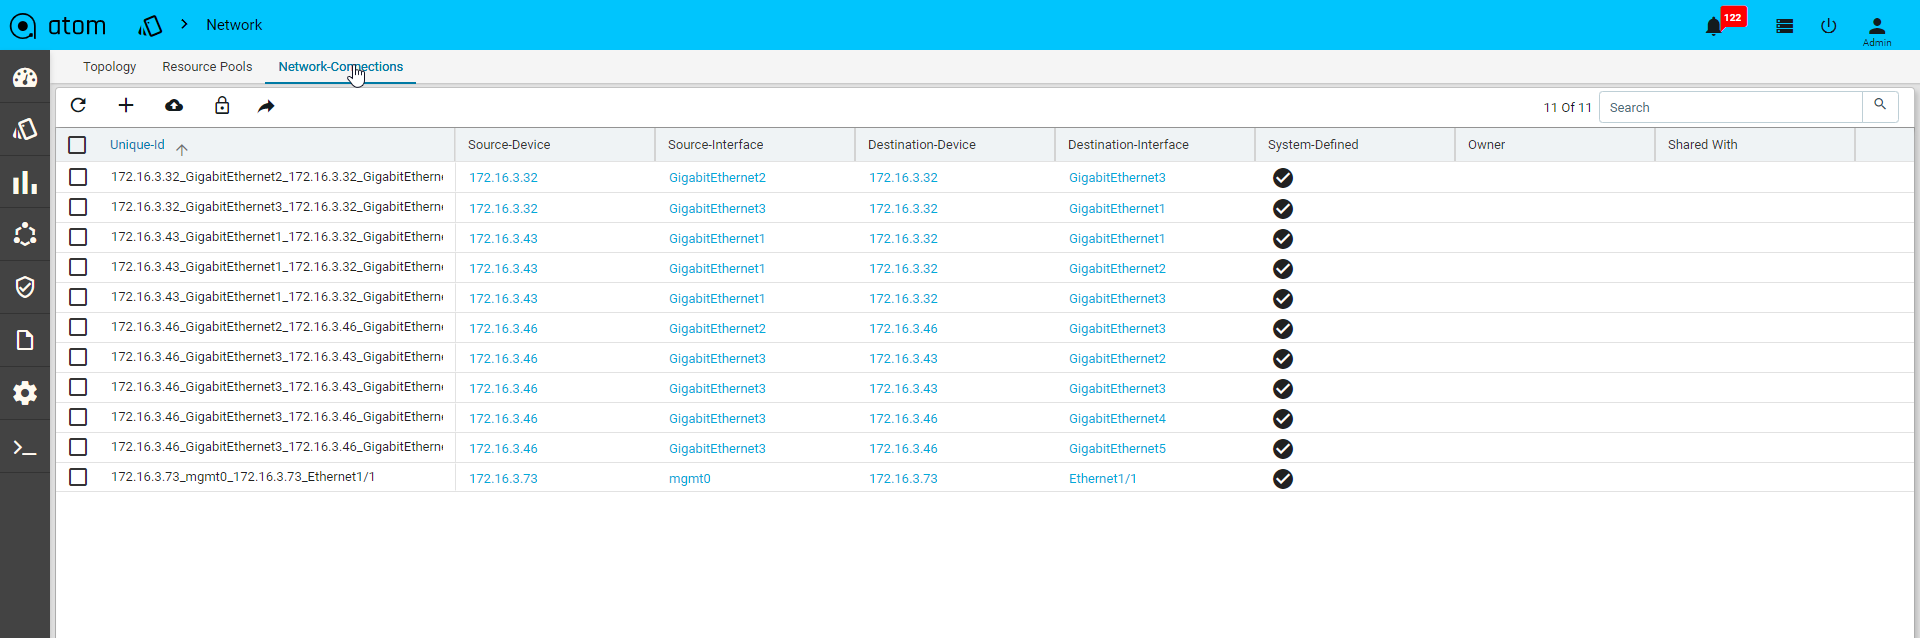
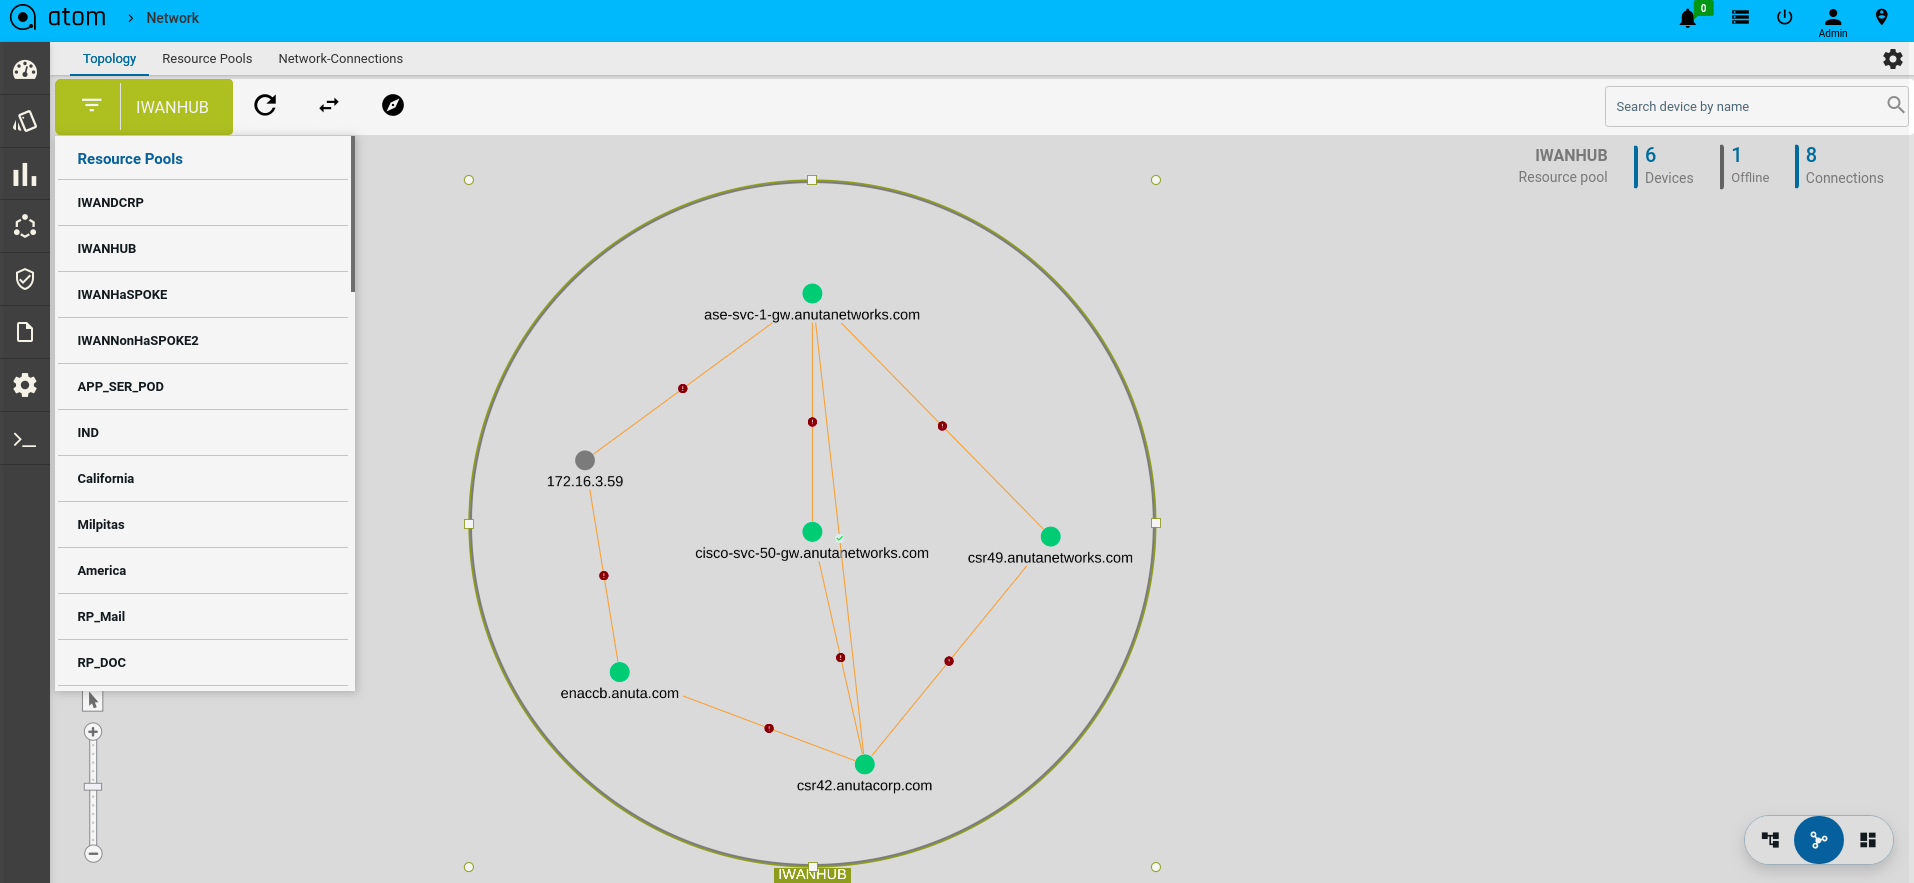
Network Topology
All the devices for each of which network connections are available are displayed in the topology view.
Resource Pools
A resource pool is a logical abstraction for flexible management of resources managed by ATOM. A resource pool can contain child resource pools and you can create a hierarchy of shared resources. The resource pools at a higher level are called parent resource pools. Users can create child resource pools of the parent resource pool or of any user‐created child resource pool. Each child resource pool owns some of the parent’s resources and can, in turn, have a hierarchy of child resource pools to represent successively smaller units of resources.
Resource pools allow you to delegate control over the resources of a host and by creating multiple resource pools as direct children of the host, you can delegate control of the resource pools to tenants or users within the organizations.
Using resource pools can yield the following benefits to the administrator:
- Flexible hierarchical organization
- Isolation between pools, sharing within pools
- Access control and delegation
Creating a Resource Pool
- Navigate to Resource Manager > Network > Resource Pools
- In the right pane, click the Add Resource Pool button to create a Resource Pool
- In the Create Resource Pool, enter values in the fields are displayed: .
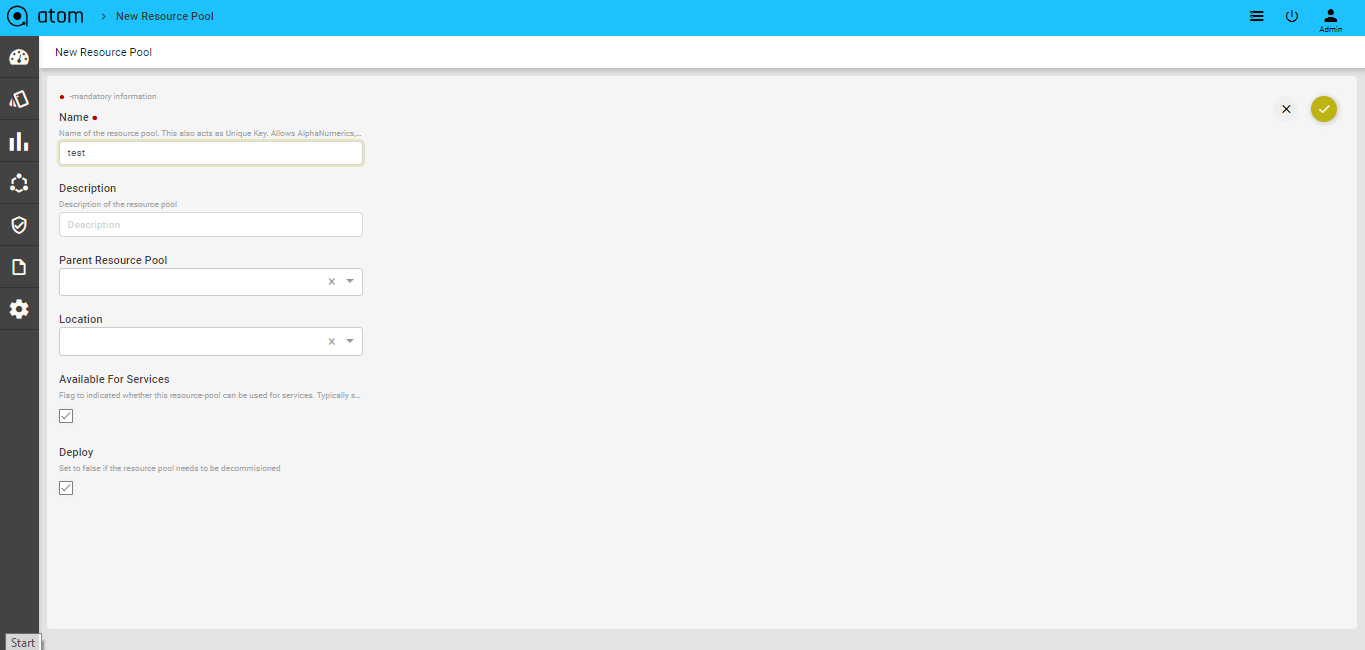
- Name: Enter a name for the resource pool
- Description: Enter some descriptive text for the created resource pool
- Available for Services: Select this option if the resource pool can be used for creating services.
- Parent Resource Pool: Select a resource pool that should act as the parent for this resource pool that is being created.
- Location: Select the name of the site or the geographical location where this resource pool should be created. See the section, “Locations” for more information about creating Locations and Location types.
- Deploy: Select this option if the resource pool should be deployed or used in services.
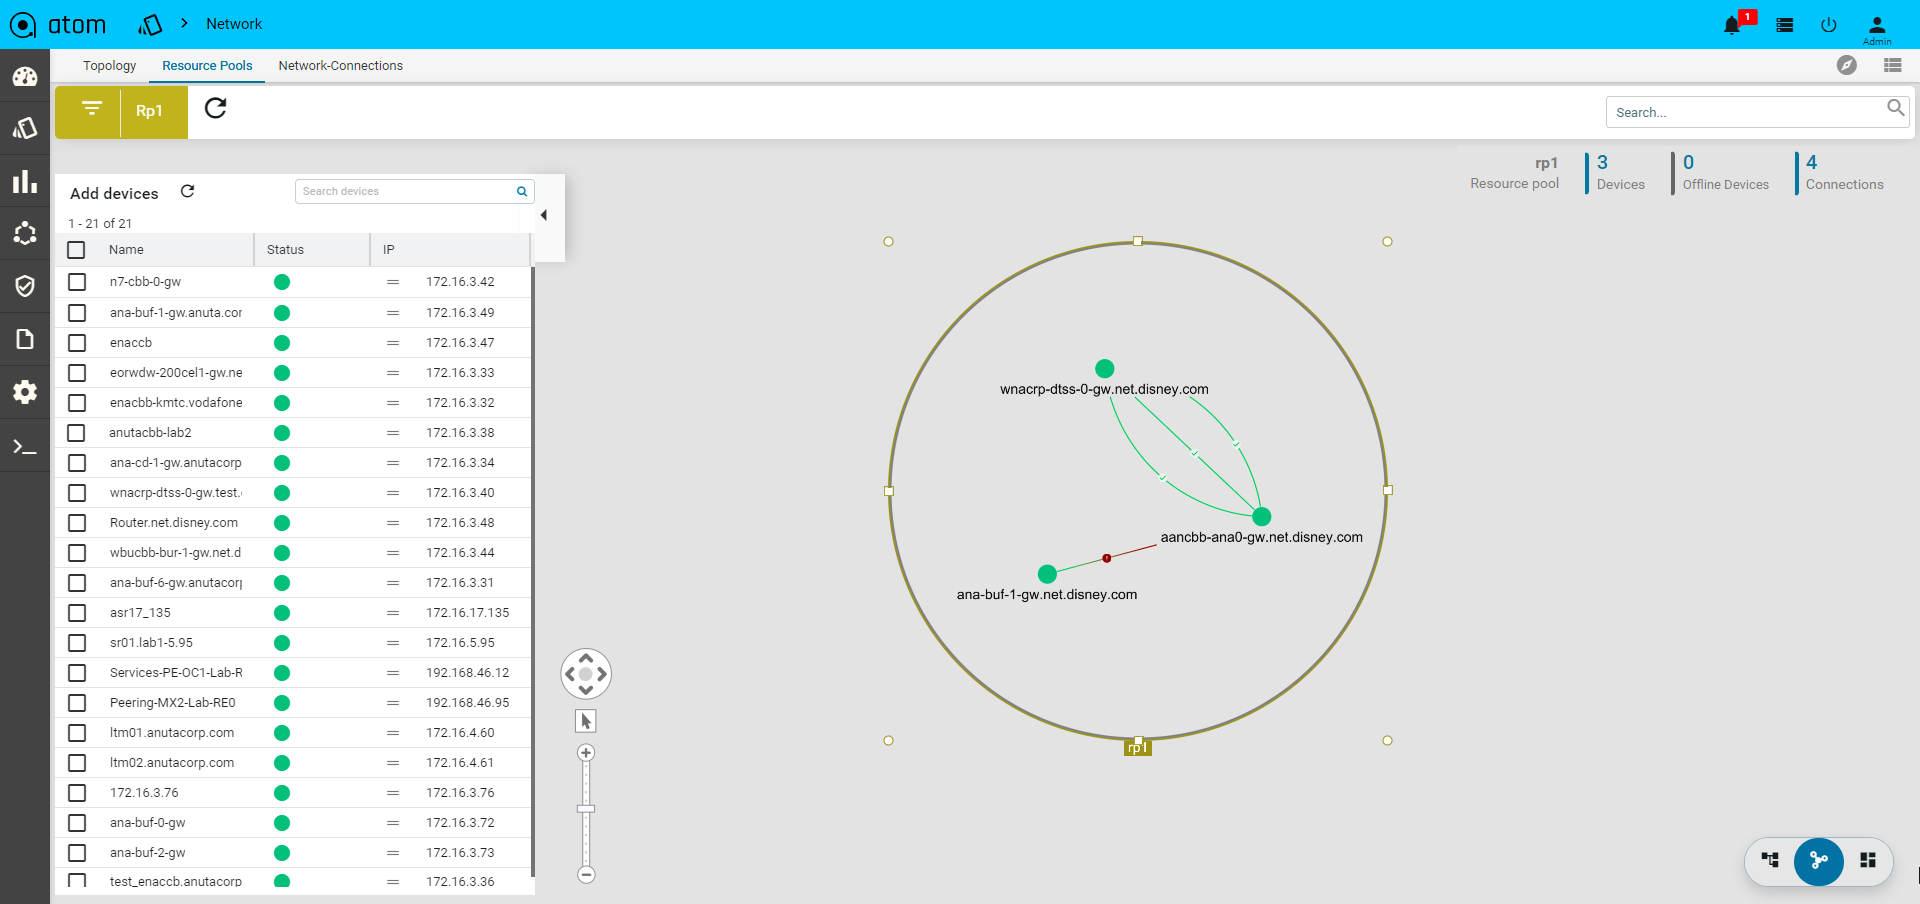
Adding Devices to a Resource Pool
- Click the created resource pool to add the required devices to it.
Select Resource pool > Add Devices

- All the devices available in ATOM are displayed in the left pane.
- Click Add to include the required devices in the resource pool
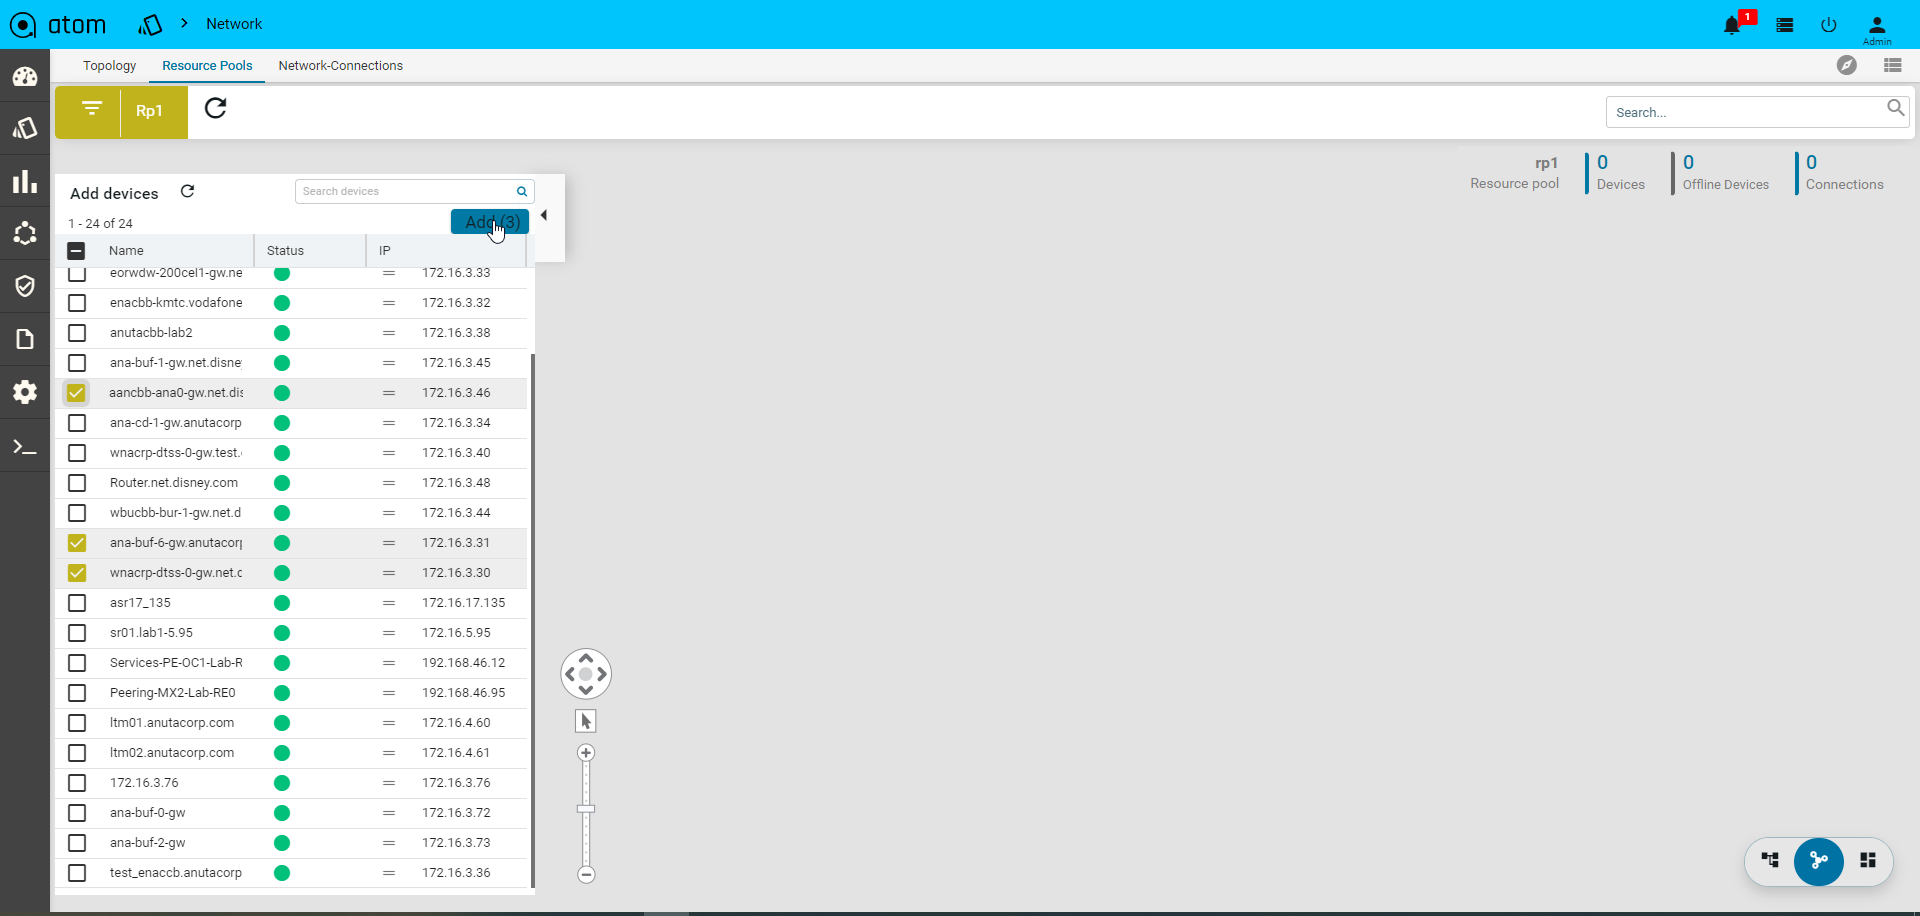
- Select the device from the Drag and Drop the devices pane to the right pane All the selected devices are now part of the resource pool created earlier.
Locations
Devices & Resources Pools can be attached to a Physical Location. Location tagging allows devices and resource pools to be visualized on a Geographical Map in topology view.
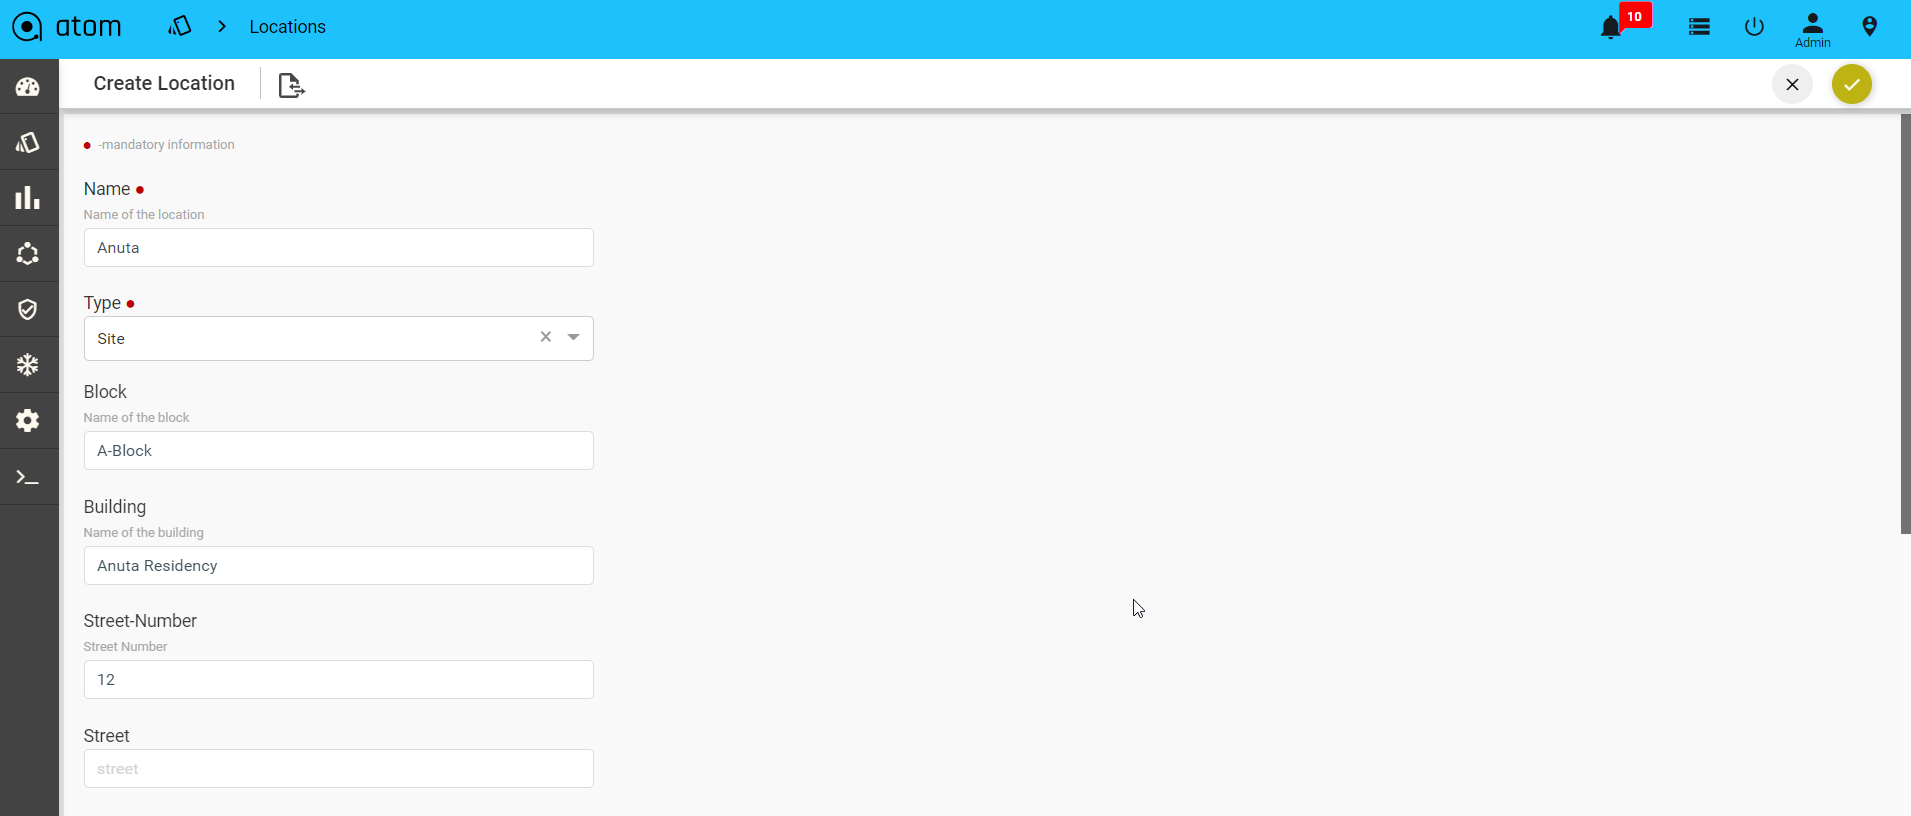
- To Create/Edit a Location – Resource Manager > Locations > Resources-Location >click Add Location
- In the Create Location screen, enter values in the fields described:
- Name: Add the name of for the data center or the site that you want to create.
- Type: Select from the pre‐defined location types from the drop‐down menu. (preferably select Site)
- Block: Enter the name of the block where the location is situated
- Building: Enter the name of the Building
- Street Number: Enter the number of the street where the Building is located
- Latitude: Enter the latitude of the site.
- Longitude: Enter the longitude of the site.
- Street: Enter the street name where the building is located.
- Country: Select a country from a pre populated list available in ATOM
- City: Select a specific city contained in the chosen country.
- State: Enter the name of the State or province to which the city belongs.
- Zip Code: Enter the zip code of the City where the Site is located.
- Parent Location: Select one of the predefined locations (of the type, Region or Country) defined earlier.
For assigning the created Location to a Resource pool, refer to section, “Creating a Resource Pool”.
After the successful allocation of the Resource Pool to the given Location, you can view it on the map. Select the created Resource Pool and click View on Map
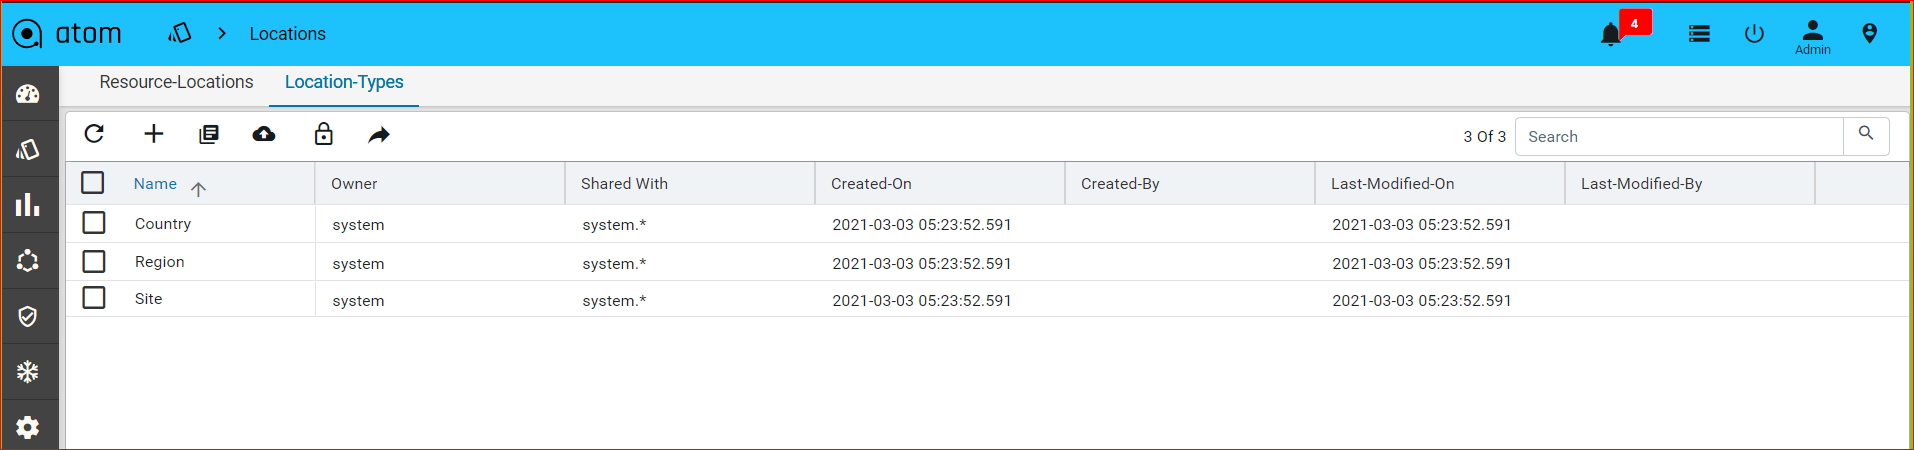
Location Types
Add the types of the location that should be associated with a Location.
Navigate to Resource Manager > Locations > Location Types.
The default location types available in ATOM are Region, Country, and Data Center
IPAM
IP Address Pool Group
For effective management of IP addresses, you can arrange IP addresses as an ordered collection and use them while instantiating a service.
- Navigate to Resource Manager > IPAM > IP Address Pool Groups
- Click Add IP Address Pool Group in the right pane
- In the Create IP Address Pool Group screen, enter values in the fields:
- Name: Enter the name of the IP address pool group
- Label: Enter the name of the label that describes the IP address pool group
- Click Add to add IP Address Pools to be included in the IP Address Pool Group
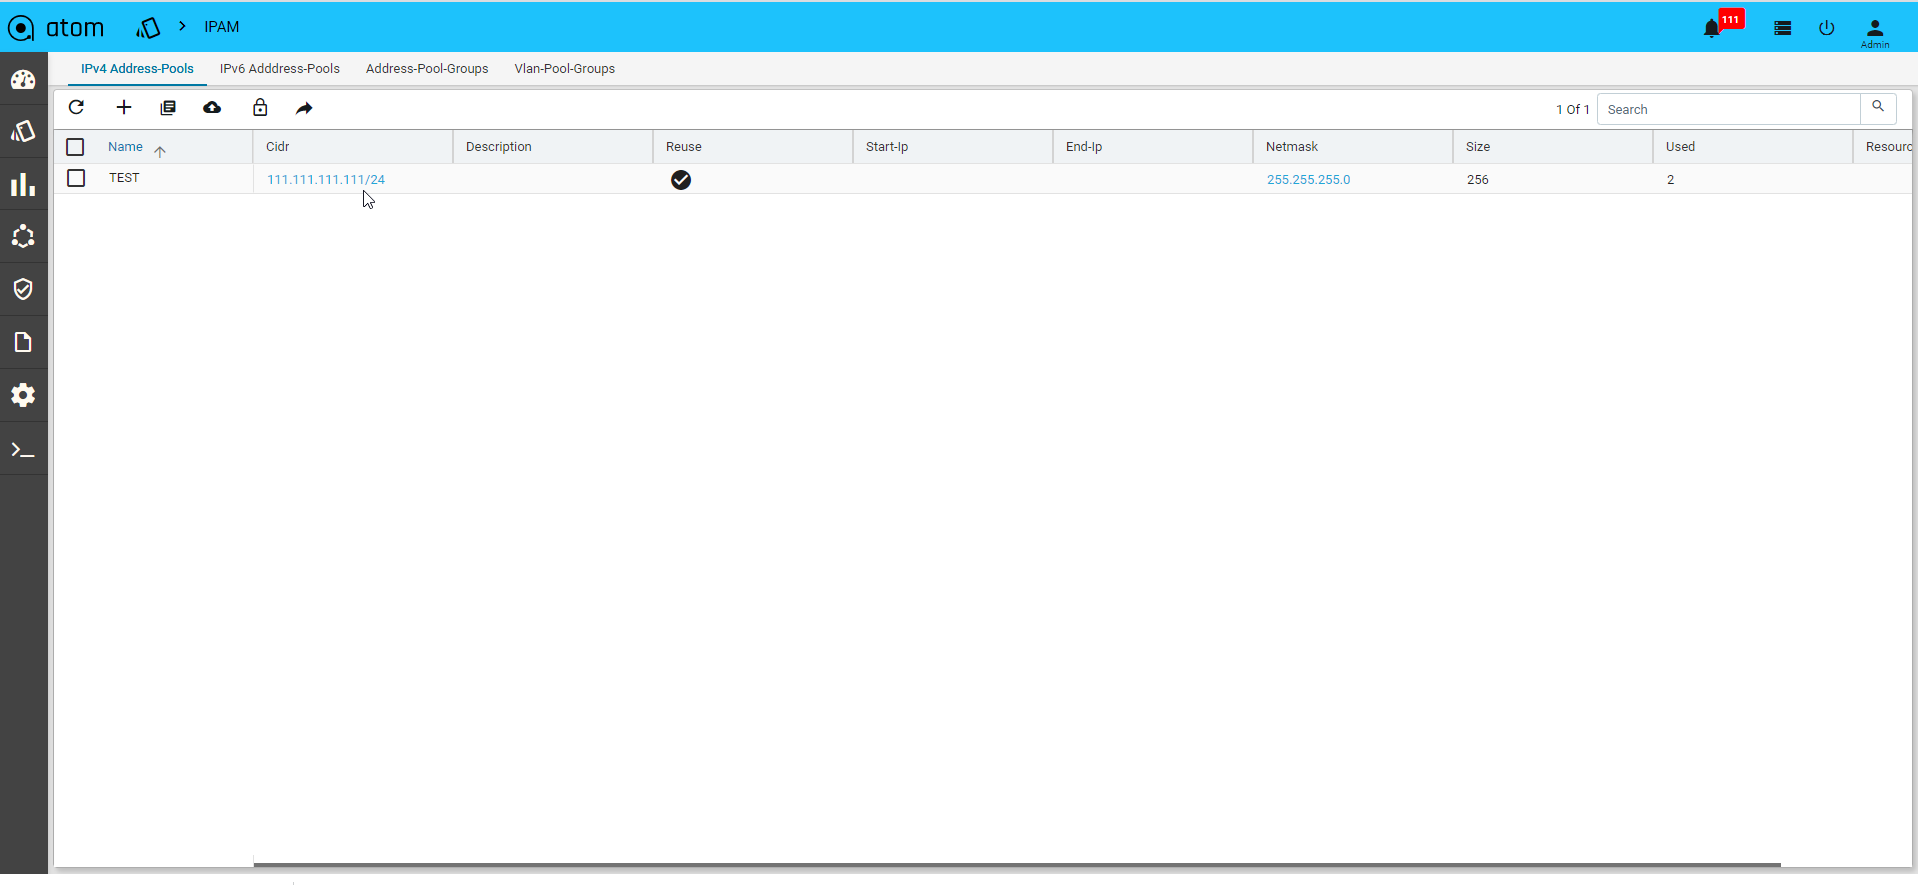
IP Address Pools
A range of IP addresses can be assigned to a pool and associated with a resourcepool.All these IP addresses will be used during the instantiation of the service.
1. Navigate to Resource Manager > IPAM > IP4- Address Pools
2. Click Add IP Address Pool on the right pane and enter values in the following fields:
- Name: Enter a unique name for the IP address pool
- CIDR: Enter the CIDR (IP address followed by a slash and number)
- Description: Enter the description for the created IP Address Pool
- Reuse: Select this option if the IP addresses contained in this pool should be reused across different services.
- Start IP:Enter the start IP address of the range of IP addresses
- End IP: Enter the last IP address in the IP address range.
- Resource Pool: Select the Resource pool to which these IP addresses should be assigned. All the services that are created in these Resource Pools will use these IP addresses.
Creating IP address entries
IP Address entries are the IP Address Pools that have been reserved for a service.
• Click IP address pool > Action > IP address entries
IPV4
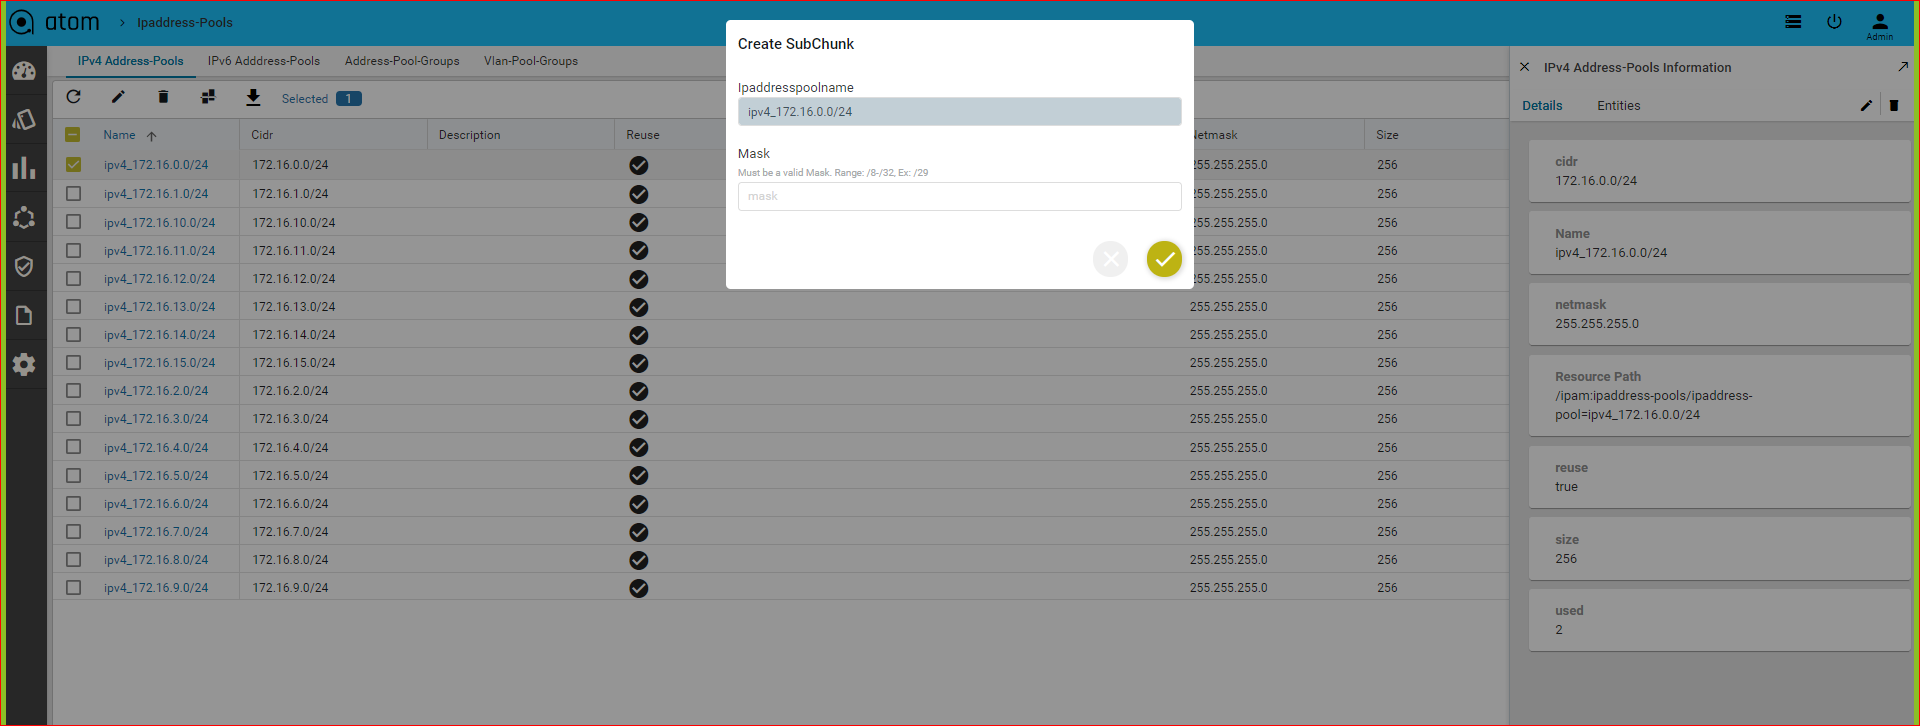
Creating Sub Chunks of the IP Address Pools
The network contained in an IP address pool can be divided into two or more networks within it. The resulting sub chunks can be used for different services to be configured on a resource pool tied with the parent IP address pool.
IPV6:
Resource Manager > IPAM > IP6- Address Pools

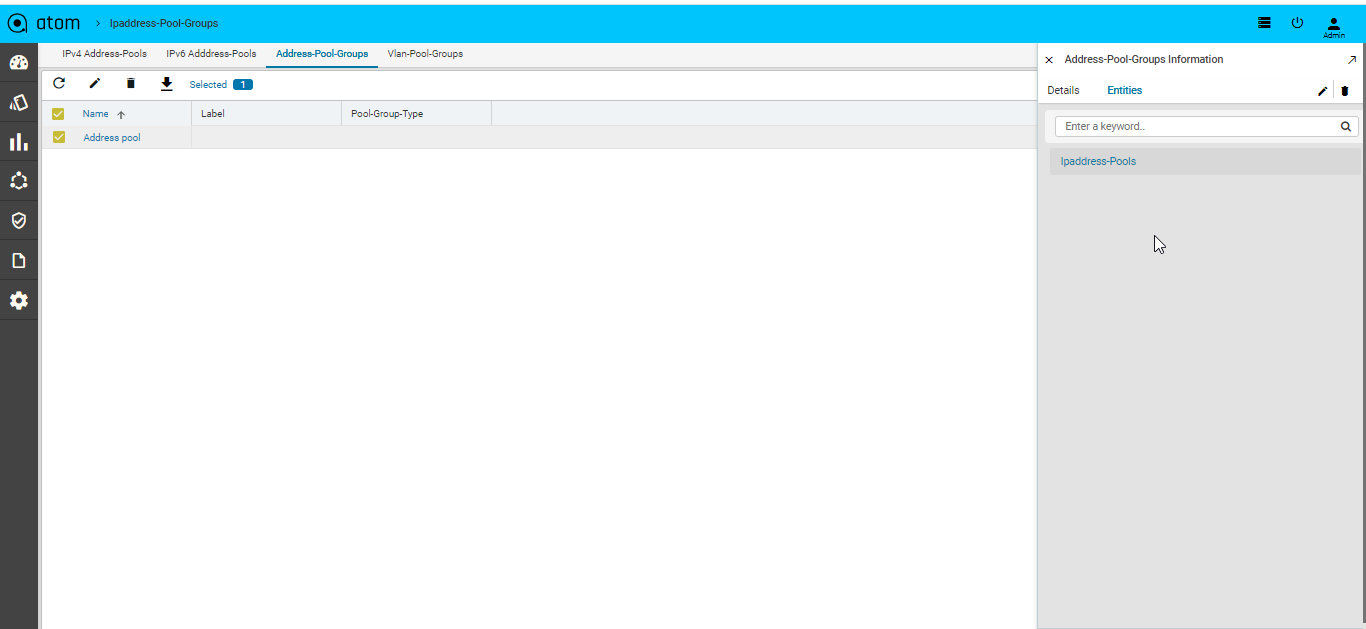
Address-pool-Groups
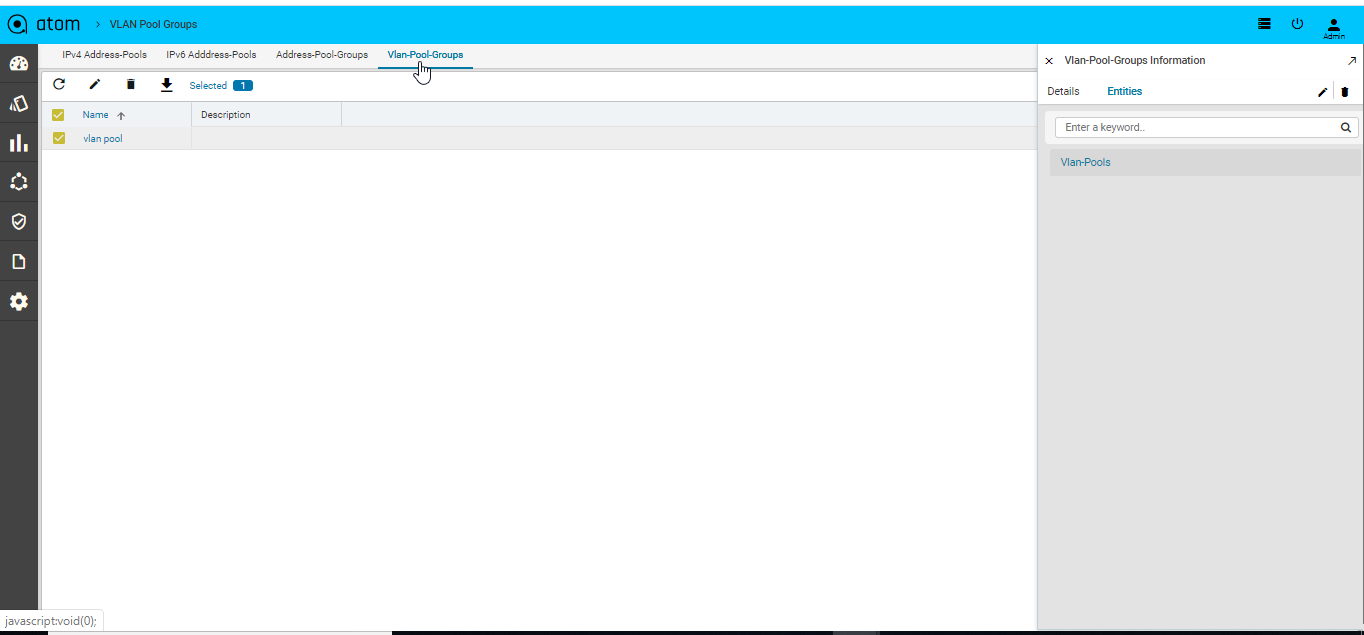
VLAN Groups
You can define VLAN groups and VLAN pools and define them as resource boundaries for a tenant in such a way that these VLAN Pools can be used during service instantiation on a resource pool.
Adding VLAN Groups
- Navigate to Resources > IPAM > VLAN Groups
- In the right pane, click Add VLAN Pool Group
- In the Create VLAN Pool Group screen, enter values in the following fields:
- Name: Enter a name for VLAN Group
- Description:
- Click Actions > vlan pools > vlan pool to create VLAN pools in the VLAN group:
- Enter values in the following fields:
- Start VLAN: Enter a number from the valid VLAN range. (1‐4096)
- End VLAN: Enter a number from the valid range (1‐4096)
- Click Add to add the required resource pools to the VLAN Pools
- Click the vlan pool > click Actions to add allocated VLAN.
Configuration Compliance
Configuration Compliance feature allows users to Define & Enforce Configuration Compliance Standards.
For more details and usecases please refer to “ATOM CLI Compliance Guide” and “ATOM Yang Compliance Guide”.
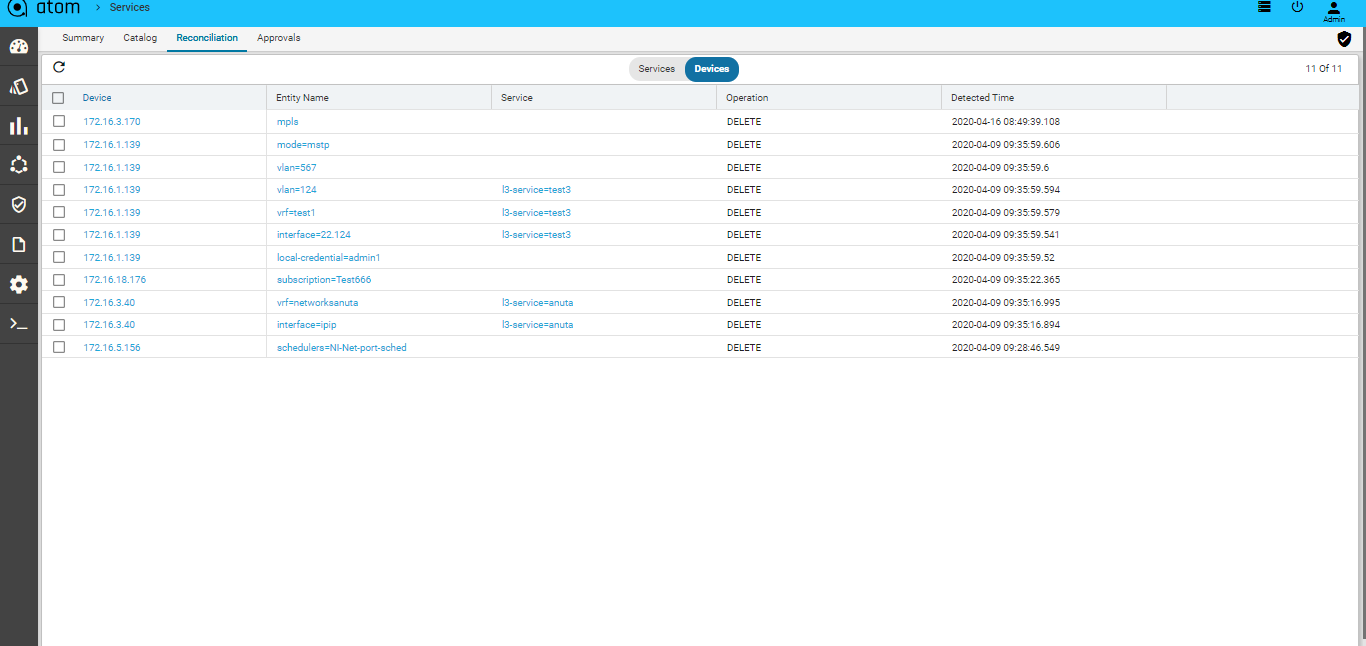
Configuration Drift (Network Services)
Whenever there is a configuration change in the device that does not match with the generated configuration on ATOM, a reconciliation task is generated in ATOM. After viewing the config diff generated, the administrator can decide how to reconcile these config differences so that the device and ATOM are always in sync with respect to the configuration states.
- Navigate to Automation->Services->Reconciliation in the left pane
- In the right pane, click Reconciliation > Entities to view all the reconciliation entities that are generated at the device level and service level.
- Double click the reconciliation entity of your choice, to view the Reconciliation details:
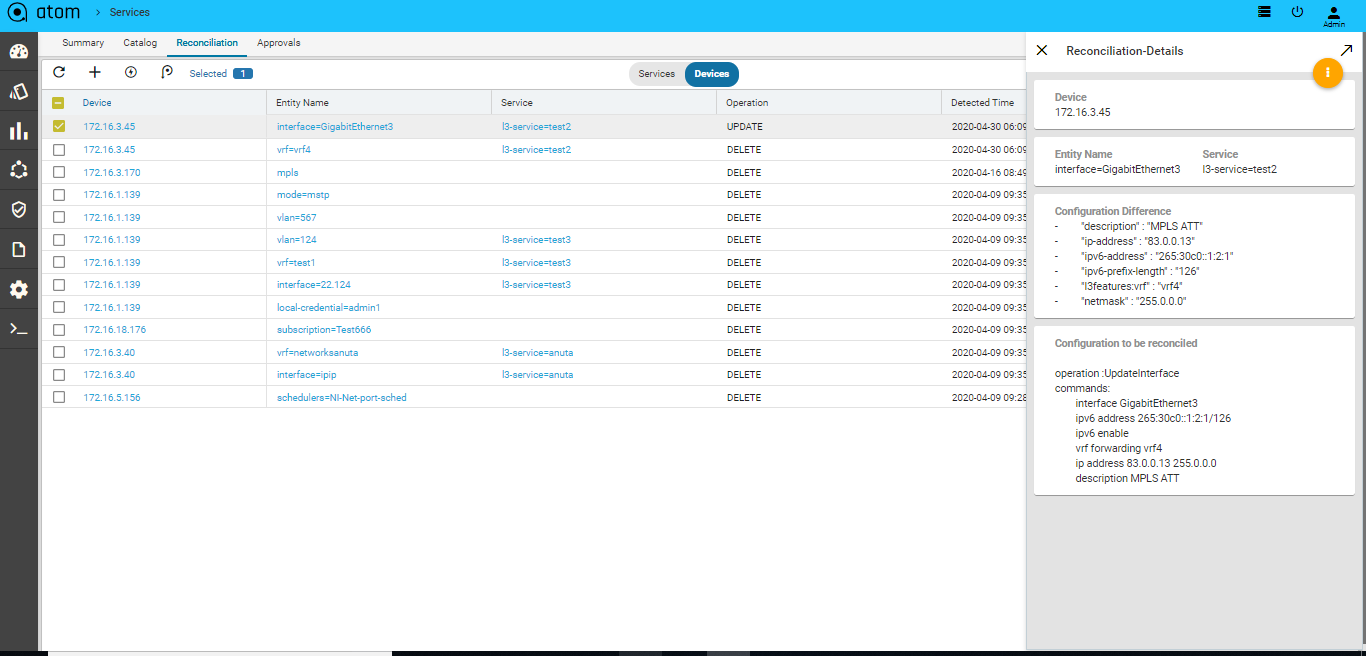
The configuration difference between ATOM and the device is shown on the left pane where as the right pane displays the configurations that should be pushed to the device to reconcile with the state of ATOM.
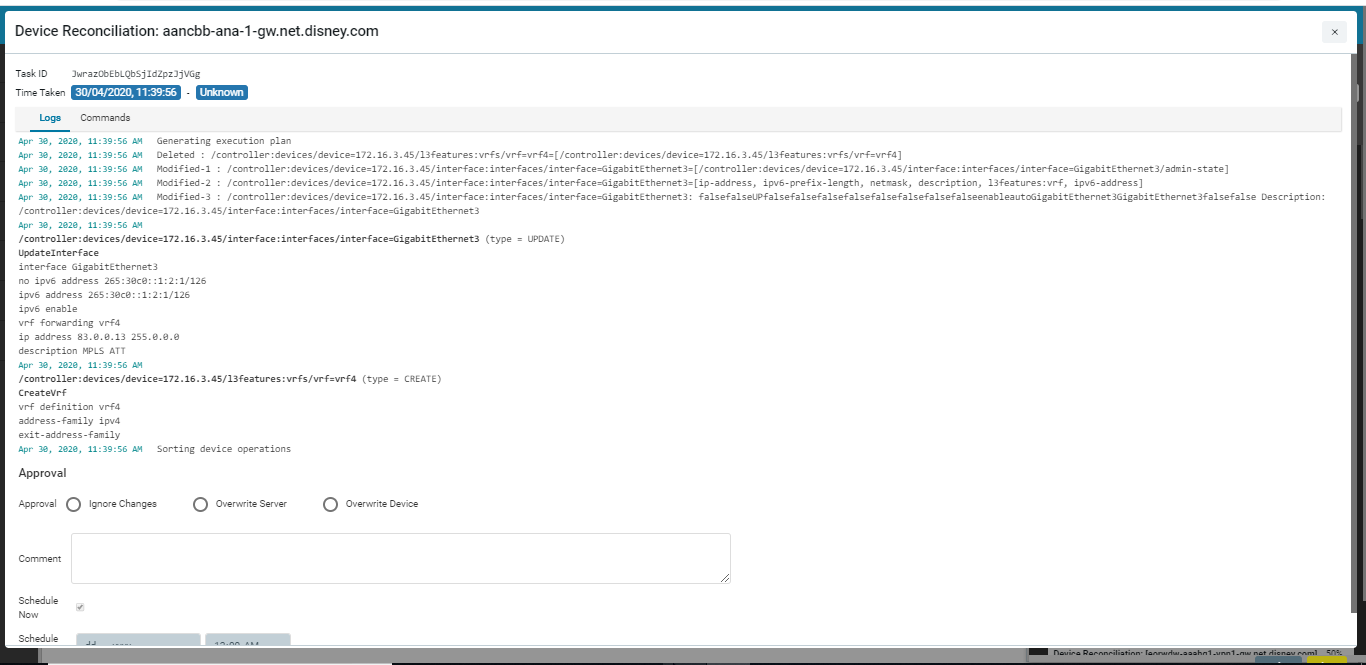
- Click the Reconciliation Policy to create the policies for reconciling the config differences either with the state of ATOM or with that of the device.
- OVERWRITE SERVER – The generated config diff is pushed to the database of ATOM to reconcile with the state of the device
- OVERWRITE DEVICE – The generated config diff is pushed to the device to reconcile with the state of ATOM.
- WAIT FOR APPROVAL – Select this option if the generated reconciliation entities require a review by an administrator. The generated config diff is sent to an approver who can take the decision of either pushing the configurations to the device or overwriting the ATOM database.
Setting the Global Policy
The policy configured in this setting will have an impact on all the reconciliation entities generated for all devices.
Setting the Device Policy
You can set granular control of what needs to be done with the config diff generated by ATOM for a specific device or a set of devices. The policy configured at the global level can be overridden by the device level.
For example, if the global level the policy is set is WAIT FOR APPROVAL but at the device level it is set to OVERWRITE DEVICE, all the reconciliation entities generated in ATOM for that device will be reconciled with the state of ATOM.
Example
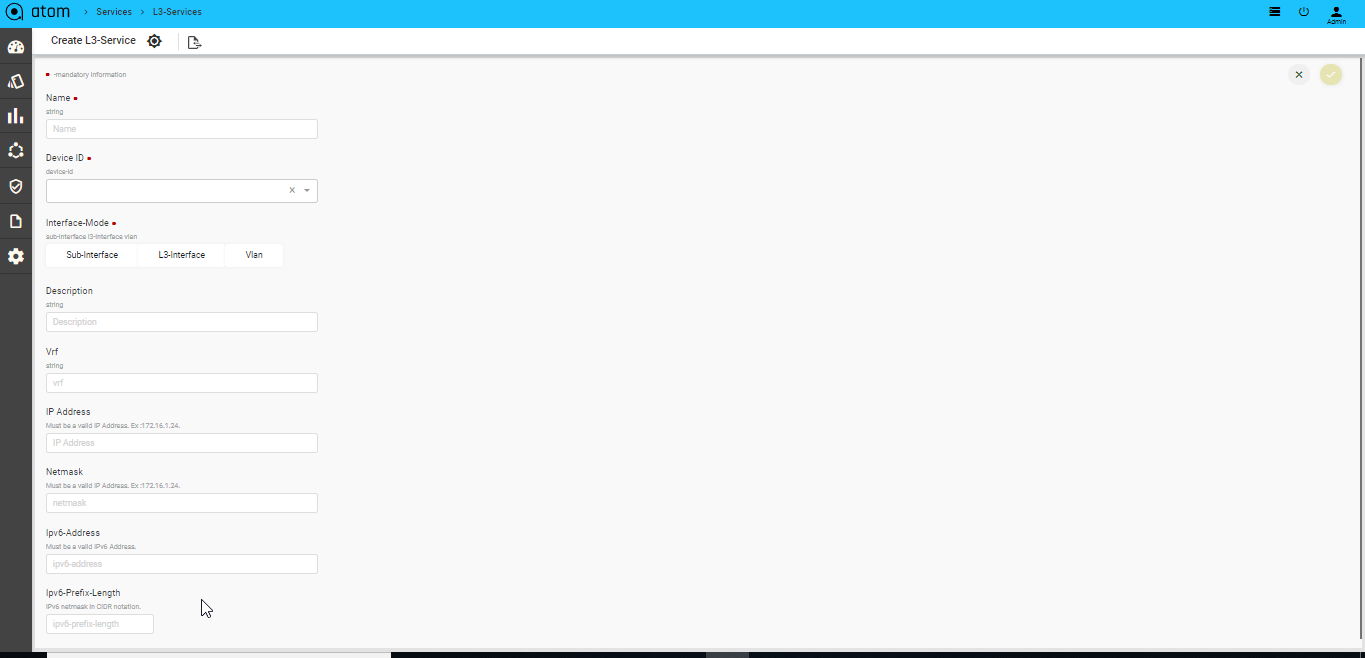
Let us understand how service compliance and reconciliation work by taking the service, L3 service” as follows:
- Create a service instance in ATOM
- Login to the device console and delete the “test VRF” from the device
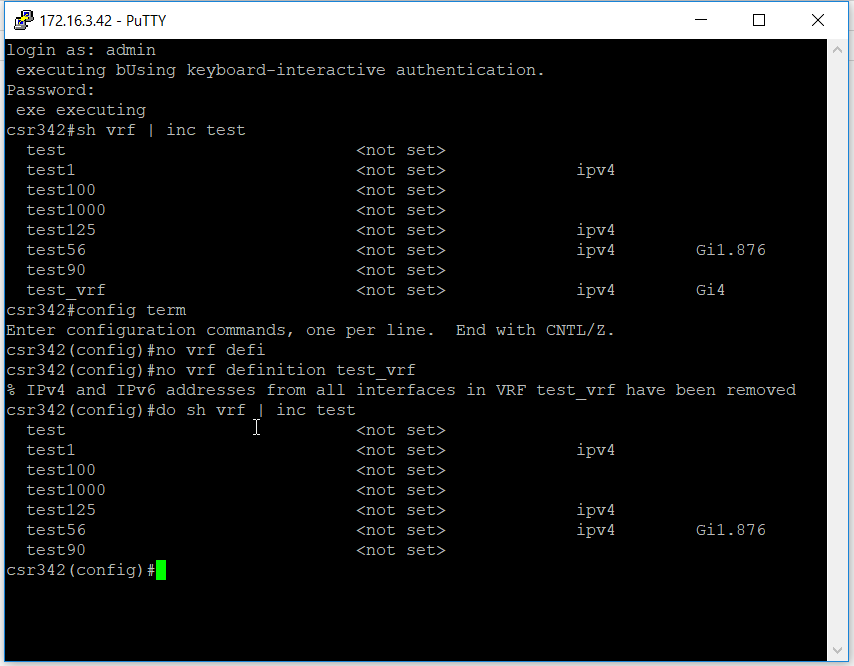
- As there is a config difference between the device and ATOM, a Reconciliation task is triggered in ATOM.
As the config change in the device is related to the created service in ATOM, a Service Inventory task is created.
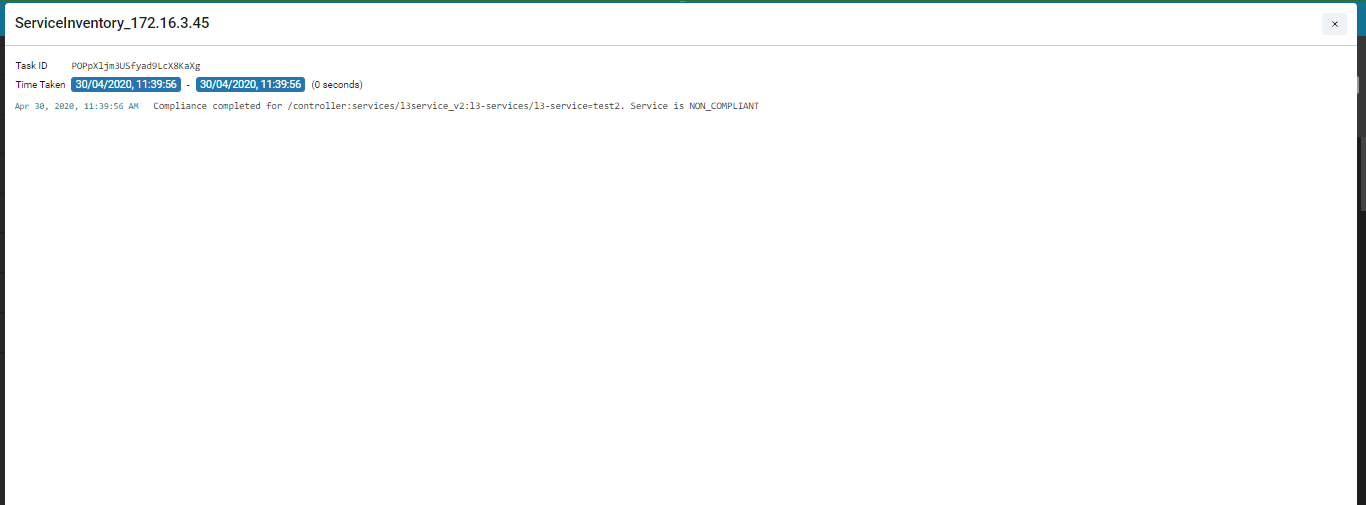
The Service is marked as “Non Compliant” service as shown in the “Compliance” Dashboard.
You can either resolve the service violation or look at the Reconciliation entities created.
Service Compliance
ATOM helps to detect any configuration deviations in network at the service level. ATOM detects the missing, deleted, violated configurations of the services that have been instantiated in ATOM and sends the reconciliation report.
When a service is instantiated on a device, all the necessary configurations are generated by ATOM and pushed to the device. After the successful creation of the service on the device, ATOM compares the running configuration on the device, compares this with the services that were generated , flags the violations and marks the service as non-compliant.
If there is any service that is non-compliant, navigate to Automation –> Services->Reconciliation->Services
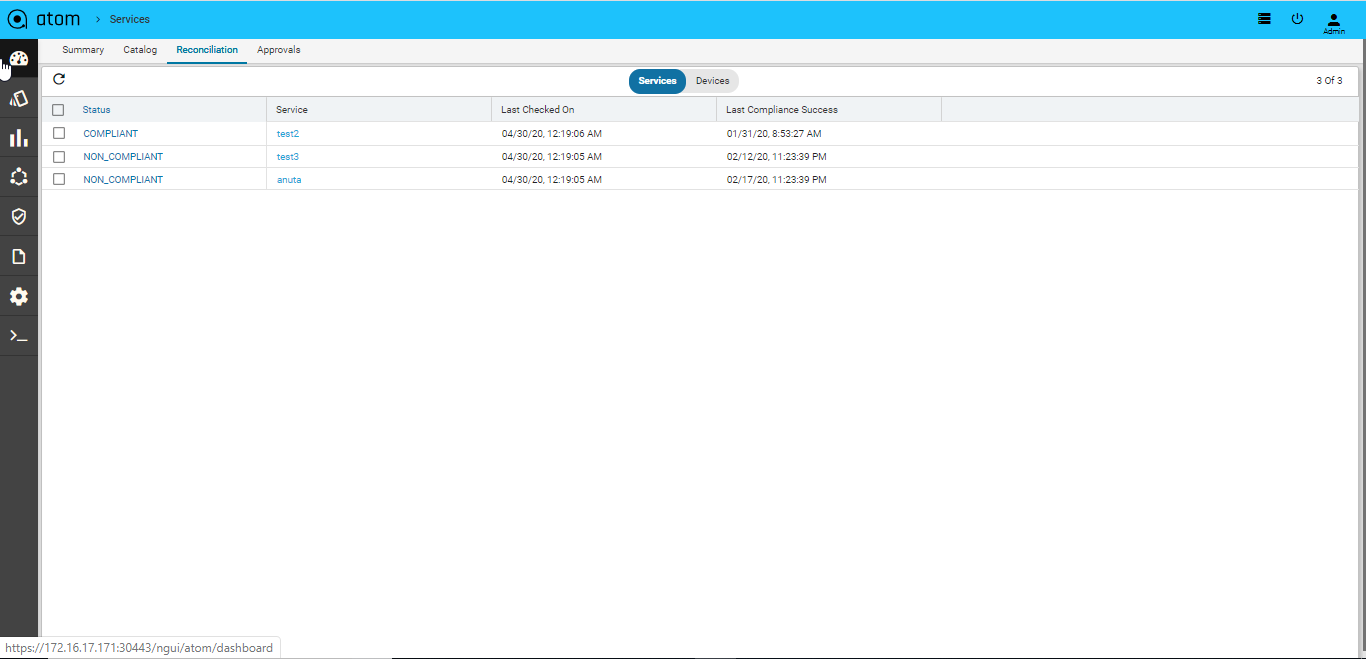
Click Non Compliant Services to view those services
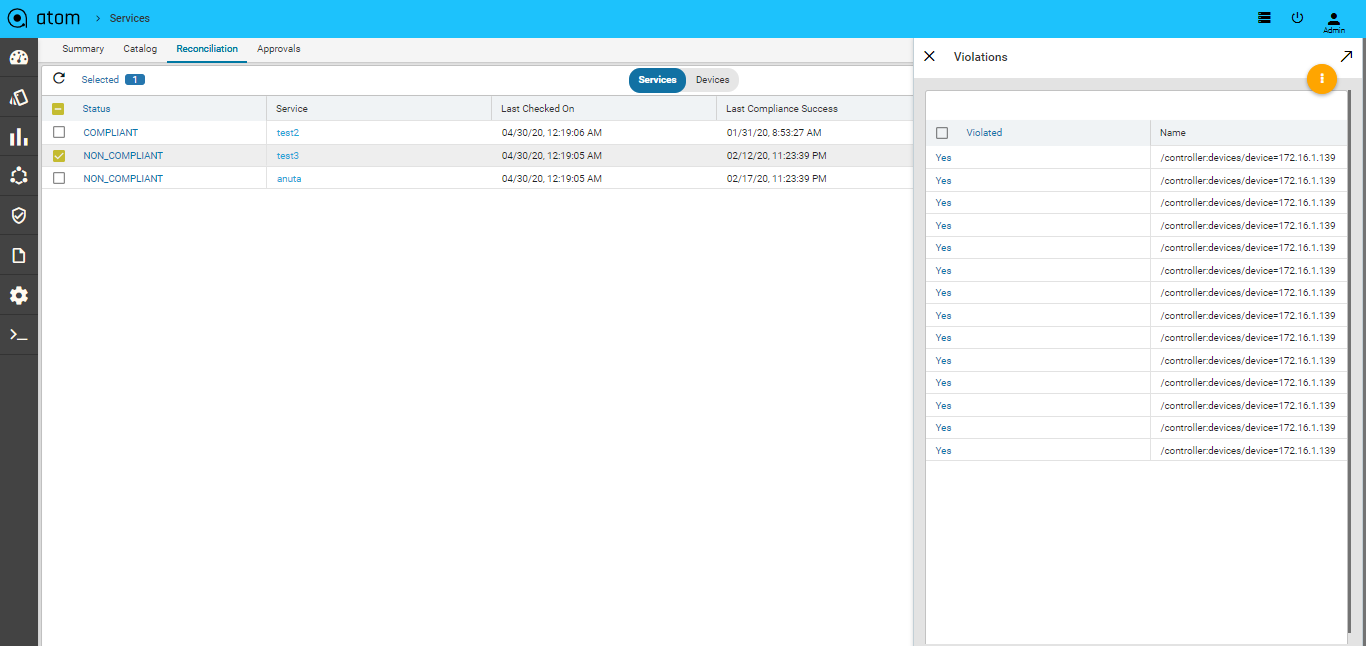
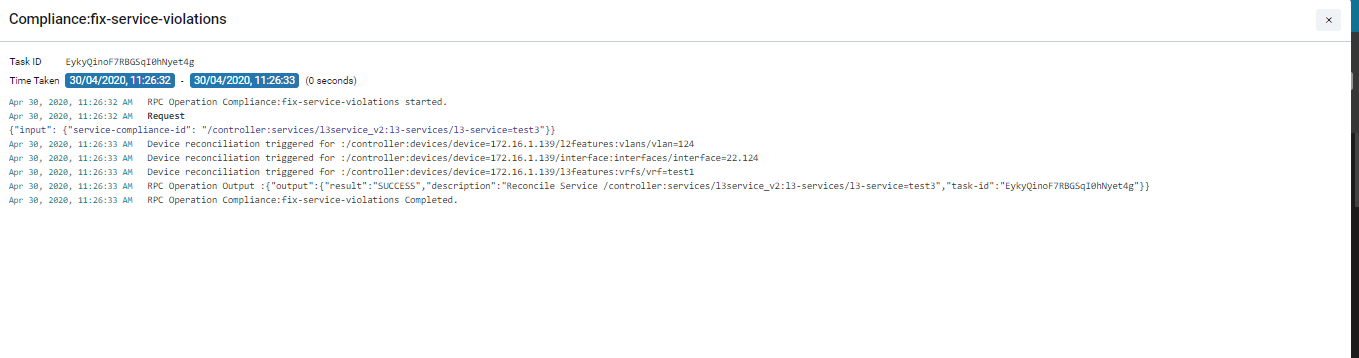
Resolving Service Violations
ATOM generates the config diff, in the service created through ATOM. and pushes the deleted configurations (that were either removed intentionally or accidentally) to the device, thus enabling the administrator to maintain the same state of configuration in both.
- Select Non Compliant Services > Click Resolve Violations
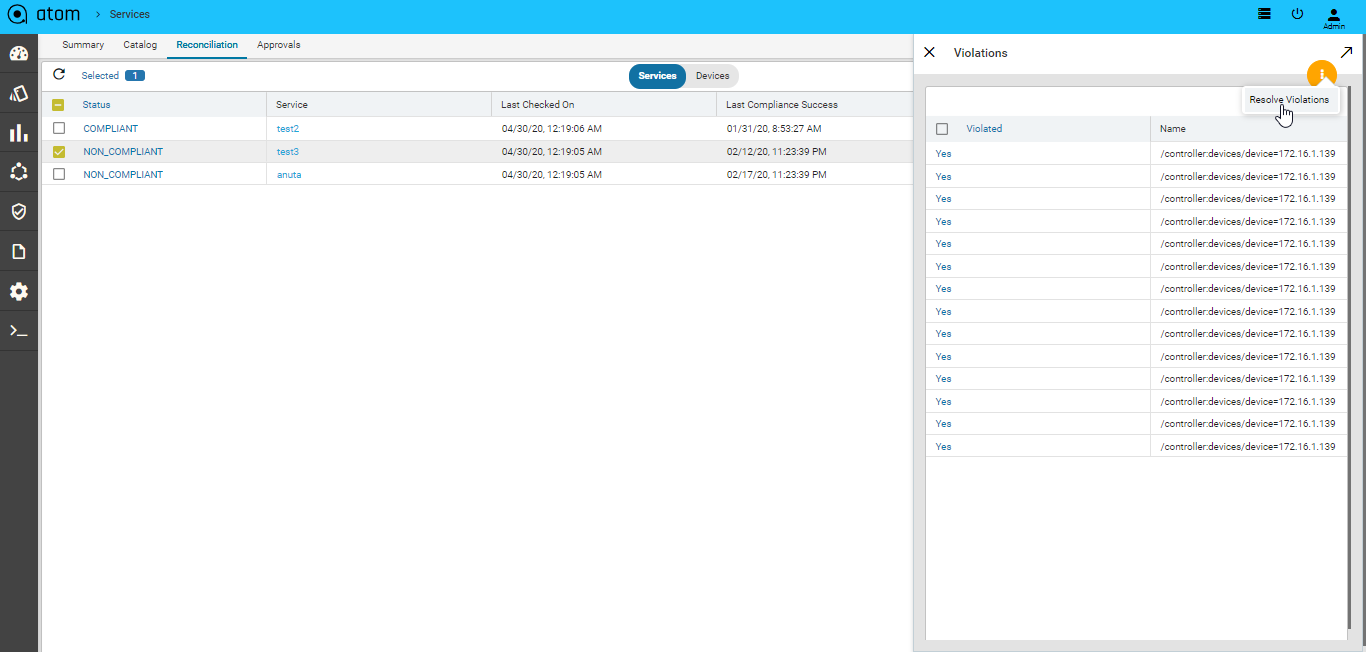
- Click the Task Viewer and look for the task named “RPC Operation: Compliance:fix-service-violations”
Collections in ATOM
ATOM collects network operational & performance data from multiple data sources such as SNMP, Streaming Telemetry, SNMP Traps and Syslog.
Appropriate data source and data stream can be chosen based on device capabilities, and throughput and latency requirements. Model-Driven Telemetry uses a push model and provides near real-time access to operational & performance statistics.
The collected Operational and Performance data can be visualized using Grafana (available as part of ATOM package) or in ATOM UI (by using various built-in reports available in Report section or under the device view). Users can build additional dashboards customized to their interests. (See ATOM Platform Guide to know more on how to create custom dashboards).
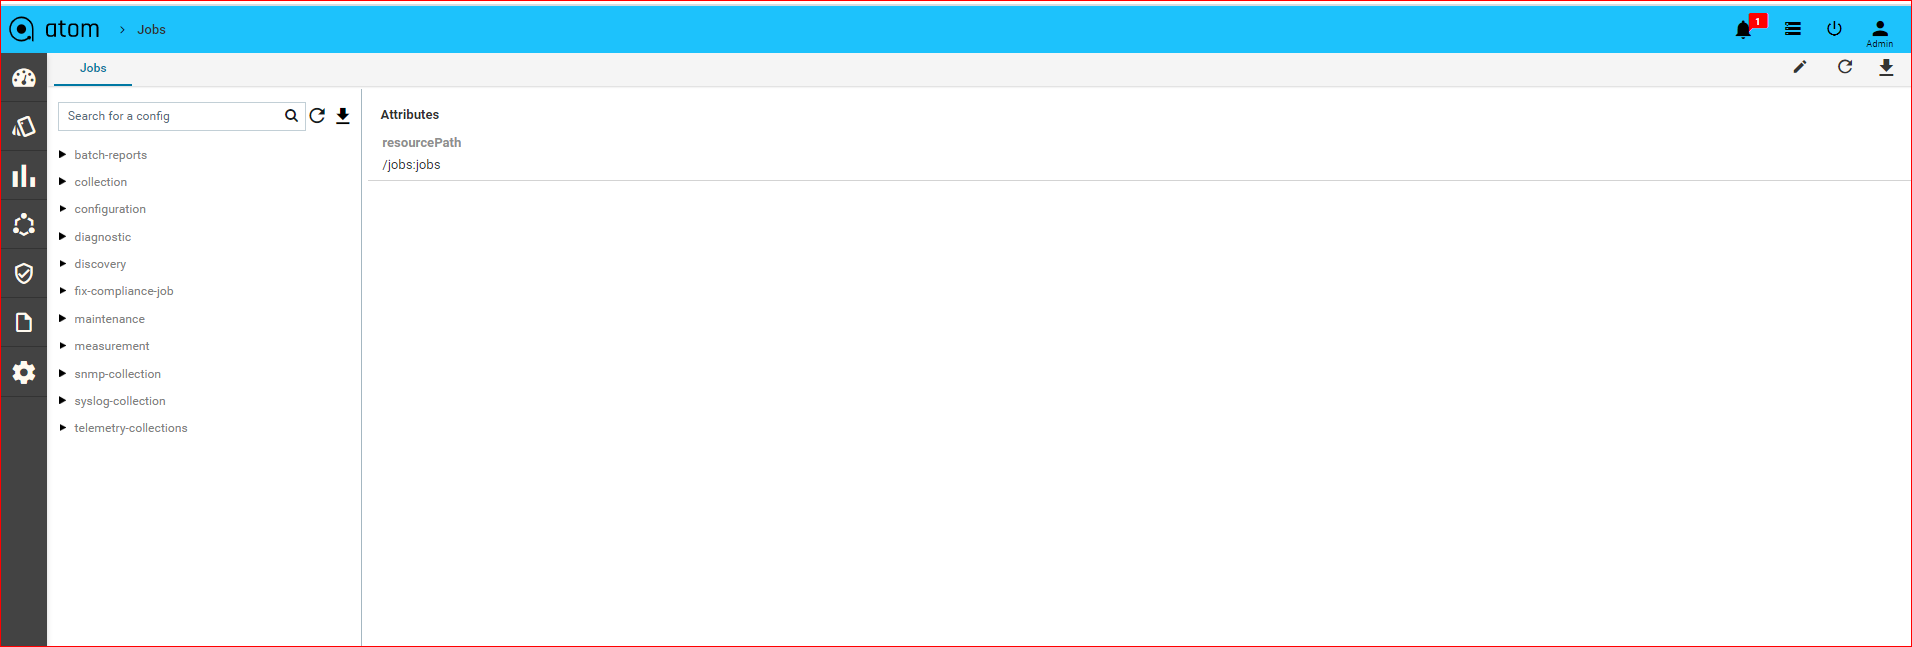
Jobs
A Job is the configurable task on a device that can be managed by ATOM. A job thus created can be a piece of work that can be created, executed and tracked in ATOM. Depending on the need, the administrator can schedule and manually run various Jobs to collect data about the device state.
Jobs are classified into the following types:
- Collection Job
- Configuration Job
- Diagnostics Job
- Discovery Job
- Inventory Job
- Maintenance Job
- Batch-reports Job
- SNMP-collections Job
- Syslog-collection Job
- Telemetry-Collections Job
- Telemetry-measurement Job
Collection Job
ATOM collects or retrieves the status of the device (OFFLINE or ONLINE) . By default, this job is scheduled to run every 6 hours. Starting with 6.0 release, you can model the collection job to collect information about the device using the SNMP OIDs. For more information, refer section, “Modelling of Collection Job” in the “ATOM Platform Guide.”
Configuration Job
Configuration job retrieves the running configurations from the device, or is triggered in the event of configuration discrepancies (either at the device or the service level) between the device and ATOM.
Creating a Configuration Job
- Navigate to Monitoring > Jobs > Configuration
- Select the Configuration folder > Add Configuration
- In the Create configuration screen, enter the values in the following fields:
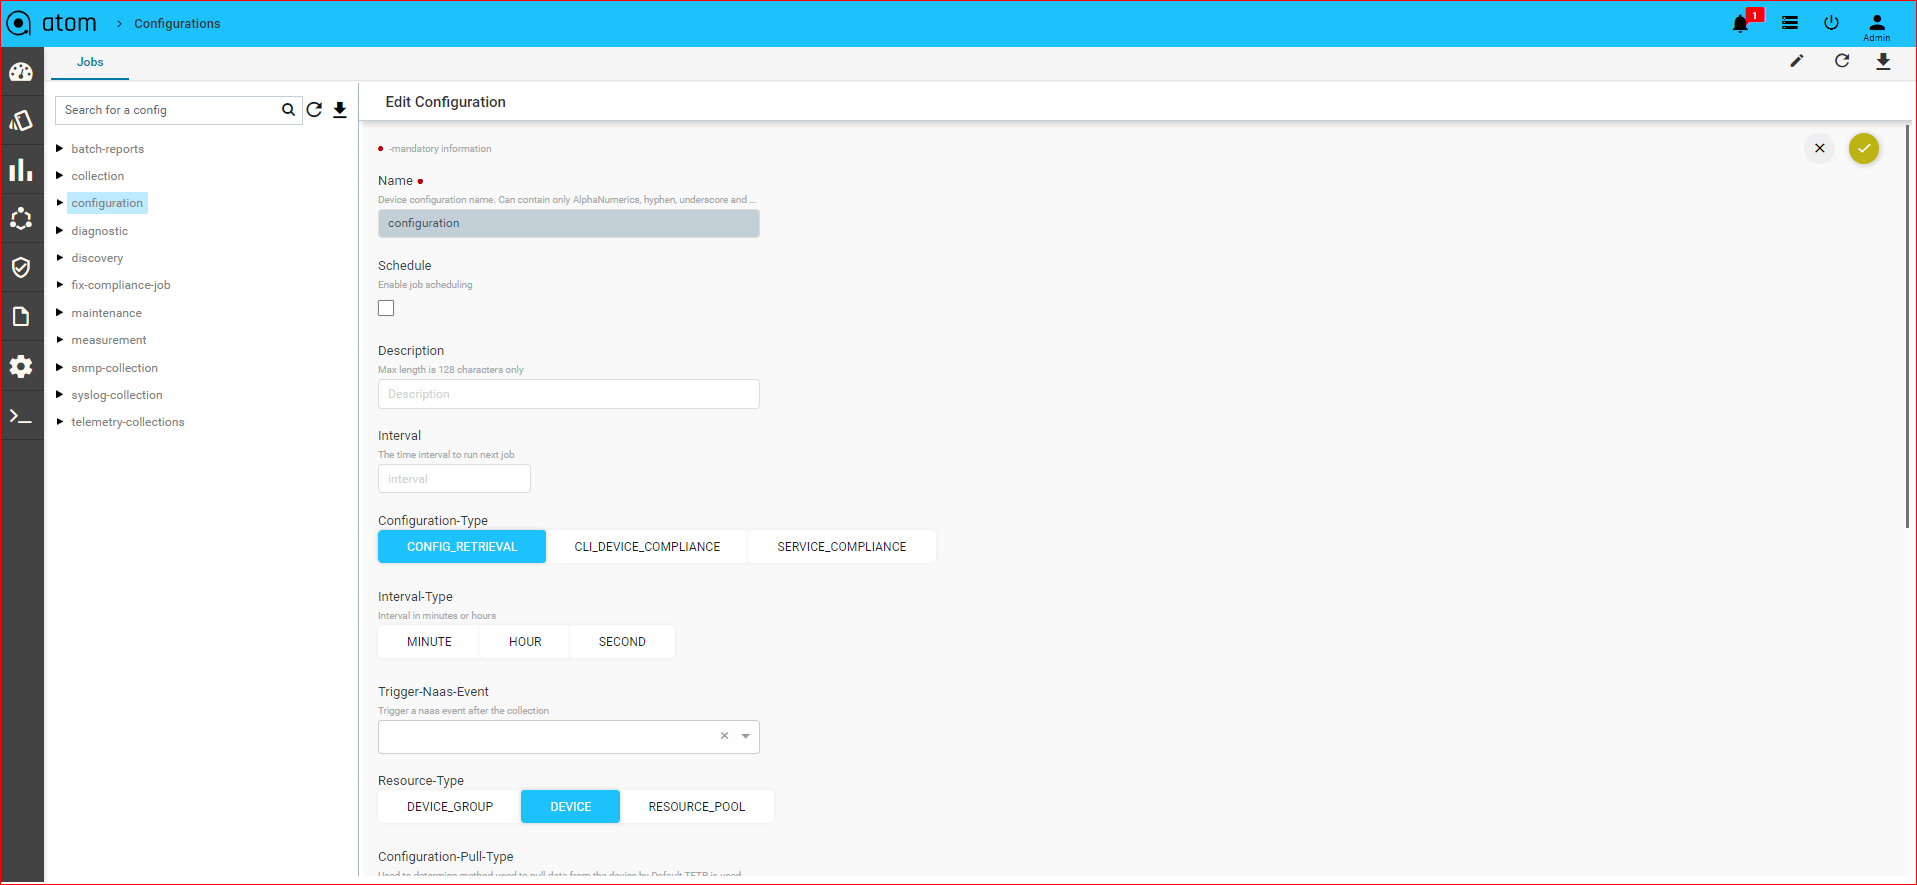
- Name: Enter the name of the Job
- Description: Enter an appropriate description for the Job
- Configuration Type: Select the type of Configuration Job from the menu:
- CONFIG_RETRIEVAL – Retrieves the basic device configuration. This option is the default value.
- DEVICE_COMPLIANCE ‐ The device compliance job is triggered when there is a violation of policy configured on the device or a set of devices. For information about the Device Compliance Policies, refer “Creating Compliance Templates”
- SERVICE_COMPLIANCE ‐ The service compliance job is triggered when there is a discrepancy in the service configurations available on ATOM and the device.
By default, ‘ServiceInventory’ Job of type Service Compliance is triggered every 5 minutes.
- Resource Type: Select one of the following resource entities where the job should be triggered:
- DEVICE: If the selected resource type is a Device, click Add to enter the IP address of the device for ATOM to communicate with it.
- DEVICE GROUP: If the selected resource type is Device Group, click Add to enter the device group for which the configuration jobs should be triggered.
- RESOURCE POOL: Click Add to select from the available resource pools where the job should be run.
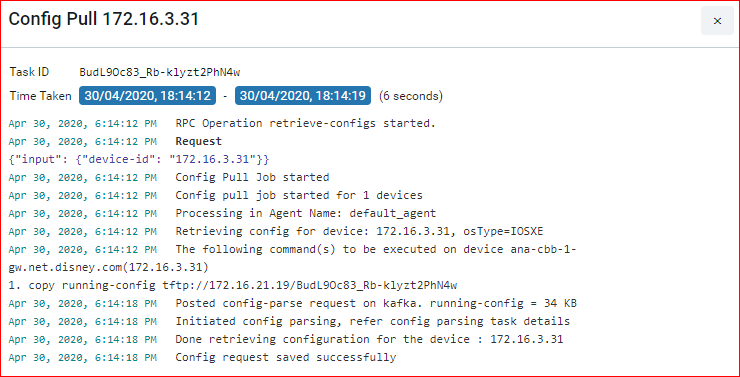
- Config Pull type: If the selected configuration type is Config Retrieval, you can opt for one of the following methods to be used while retrieving the configurations from the device:
- TFTP_EXPORT – Select this option when ATOM should retrieve configs from the TFTP server
- SHOW_COMMAND – Select this option if ATOM should retrieve configs from the running configuration of the device. This will be useful when in some customer environments where the TFTP port is disabled.
- Parse Config: Select this option if the parsing of the configurations should be enabled on the device/devices after the successful run of the config retrieval job.
| Note: Use this option if you want to override the value set in the global parameters of ATOM. By default, at the global level config parsing is enabled for all devices However, using this option you can disable config parsing at the device level. |
- Schedule: Select the checkbox and schedule the job to be run at intervals
- Interval: Enter the time period for which the job should be scheduled
- Interval Type: Select the units of time when the job should be scheduled (HOUR or MINUTE)
Click the Task viewer to check for the status of the executed job.
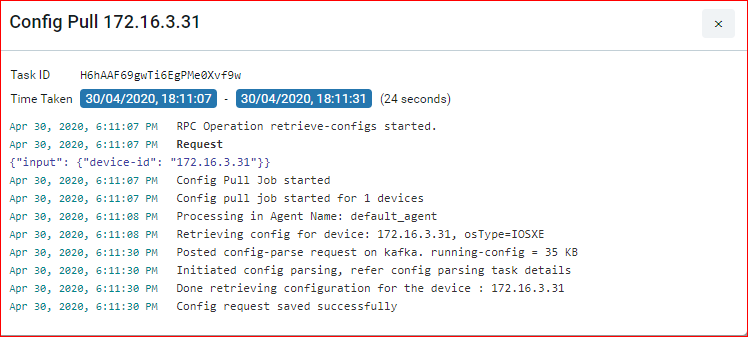
Option 1: A successful run of the Config Retrieval job, where ‘TFTP Export’ enabled, fetches the following details from the device:
Case 2: A successful run of the Config Retrieval Job, with ‘show run config’, is shown as below:
Diagnostics Job
Diagnostics job collects various CPU, memory utilization and interface performance data that is used to provision the service. By creating a Diagnostics Job, you can run the basic device Telnet or SNMP connections to the device and also perform module‐ level diagnostics.
Creating a Diagnostics Job
- Navigate to Monitoring > Jobs > Diagnostic
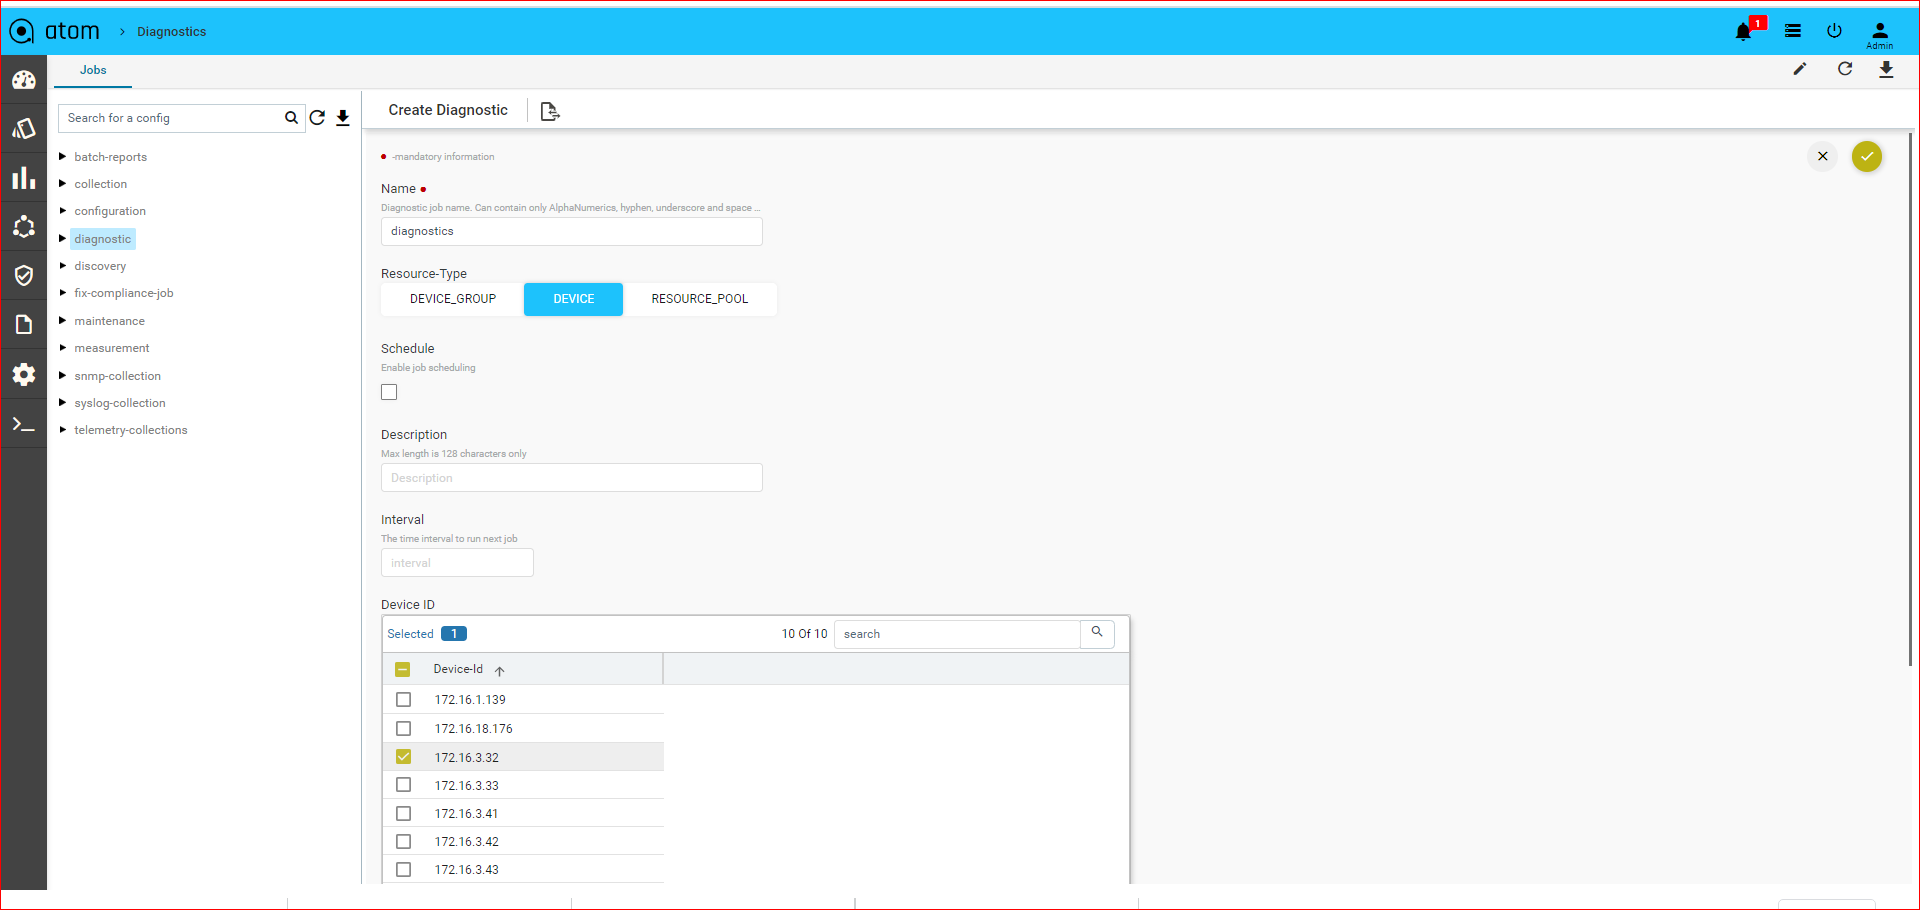
- Select Diagnostic and click Actions > Add Job
- In the Add Diagnostic screen, enter values in the following fields:
- Name: Enter a name not exceeding 64 characters
- Description: Type an appropriate description for the job.
- Resource Type: Select one of the entities where the job should be run
- Device: Enter the IP address of the device
- Device Group: Select a device group from the drop‐down list.
- Resource Pool: Select the resource pool from the available resource pools in ATOM.
- Schedule: Select this option to run the job in specific intervals of time
- Interval: Enter a number representing a span of time.
- Interval Type: Select the units of time (minute or hour)
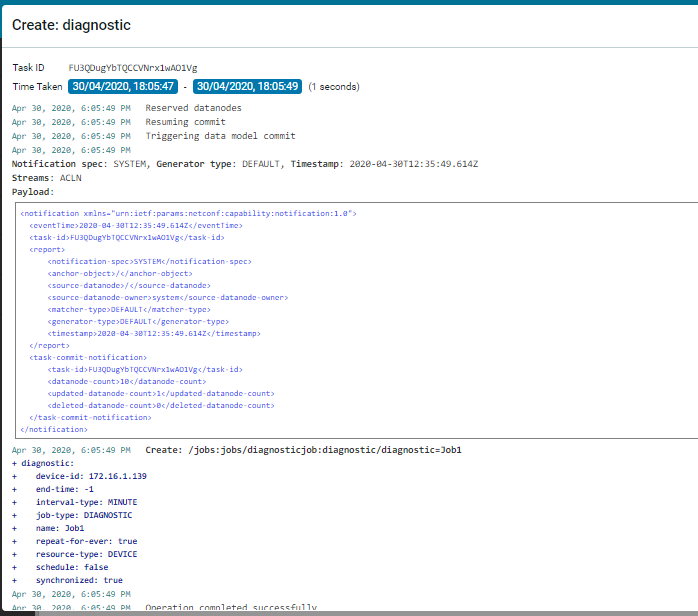
Click the Task Viewer pane and search for the Diagnostics job. A successful run of the Diagnostic Job displays the following information in the task details:
Discovery Job
Discovery job is used in discovery of the devices falling within a range of IP addresses.
The first step in provisioning a network is discovering the devices in the network. ATOM discovers the devices in the pod using either CDP or LLDP. Based on this discovery, ATOM automatically draws a network topology diagram.
If only SNMP is enabled, the topology diagram cannot be drawn as SNMP does just the sweep, which is not a methodical way of discovering device hierarchy. Therefore, it should be ensured that either CDP or LLDP is enabled on all the devices managed by ATOM.
A SEED device is the starting point from which ATOM discovers the network and its peers or neighbor devices. SEED discovery type should be selected when devices in a smaller range are required in the topology. This method of discovery is quicker, but fewer number of devices are discovered.
If the selected discovery type is SWEEP, the devices within a range of IP addresses are discovered.
Creating a Discovery Job
- Navigate to Monitoring > Jobs > Discovery > Add Discovery
- In the Create Discovery screen, enter values for the mandatory fields:
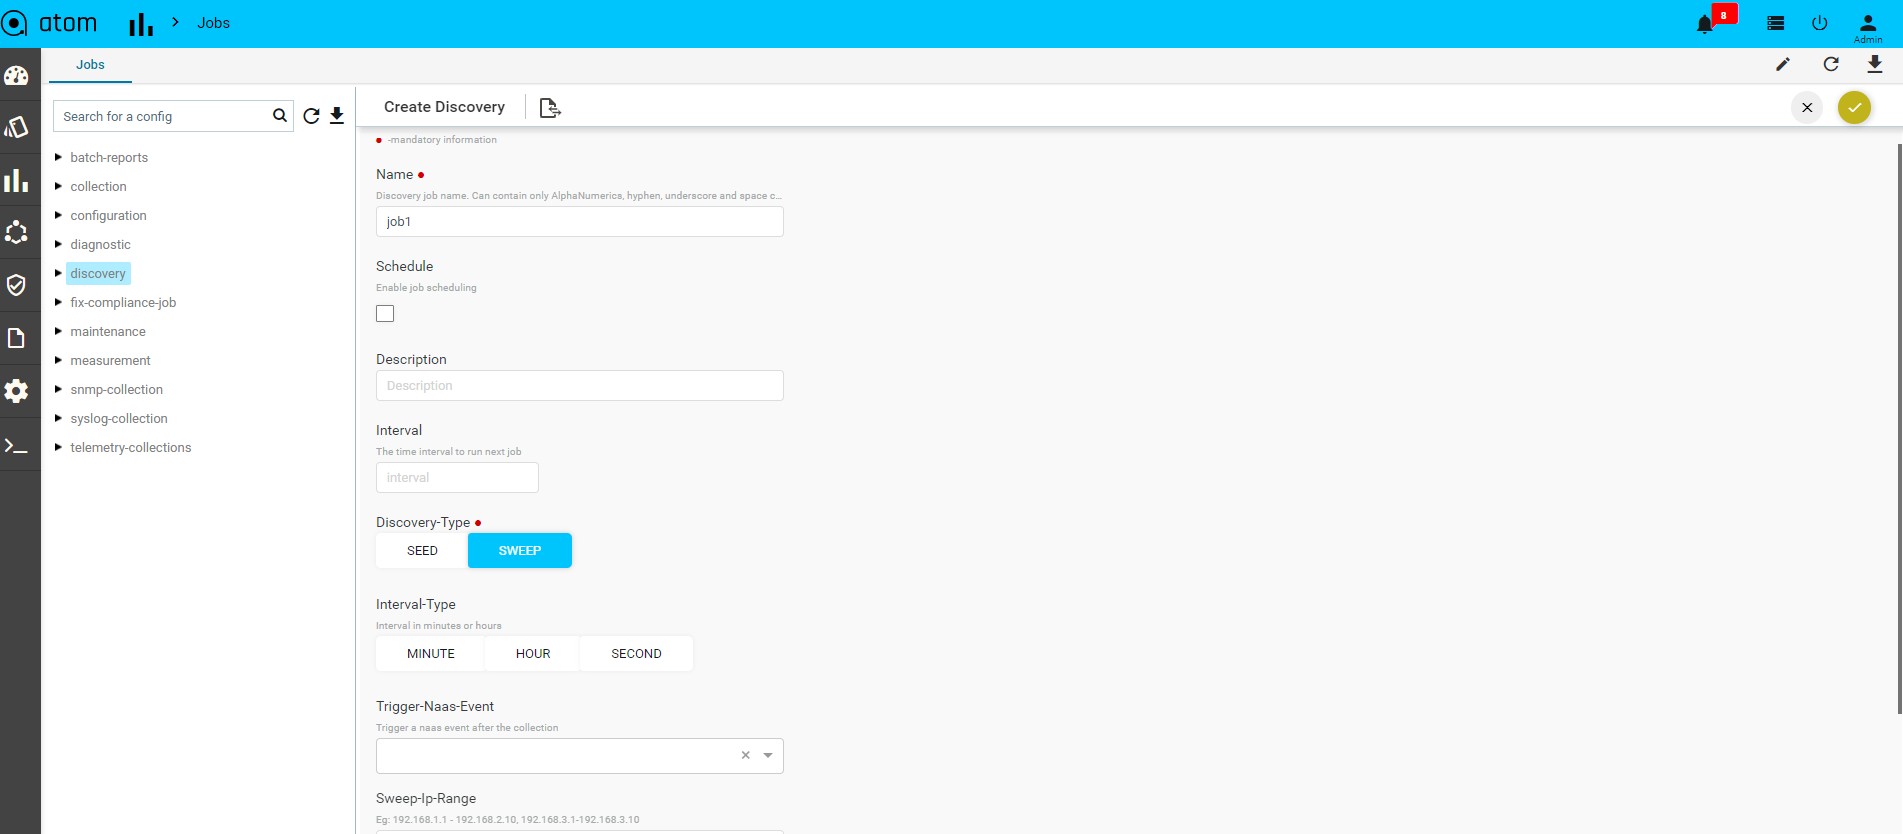
- Name: Enter an alphanumeric string to identify the created discovery job
- Description: Enter some text that describes the Job
- Discovery Type: Select one of the discovery protocols that used for discovering devices:
- SEED – By default, the discovery type is SEED.
- SWEEP – Change the value to SWEEP, if you want more devices to be discovered.
- Seed Type: Select the type of the seed protocol, either CDP or LLDP. In case the Discovery type is selected as SWEEP, enter the SWEEP IP range in the field.
| NOTE: This IP range should be the same or a subset of the range of IP addresses defined in the Credential Map. IP addresses can be expressed in CIDR notation as well. |
- Hop Count: Enter the number of hops (devices)that ATOM should discover from the seed device while using CDP.
- Seed IP Address: Enter the IP Address of the seed device from which the discovery of the neighbouring devices should be initiated.
- Auto manage: Select this option to add the discovered devices to ATOM automatically. If this option is selected, a Managed Task is generated after the successful run of the discovery job.
- Schedule: Select this option if this job should be scheduled at prescribed time intervals.
- Interval: Enter the period of time within which the job should be scheduled
- Interval Type: Enter the units of time (HOUR or MINUTE)
A successful run of the Discovery Job with the SWEEP protocol is as shown as below:
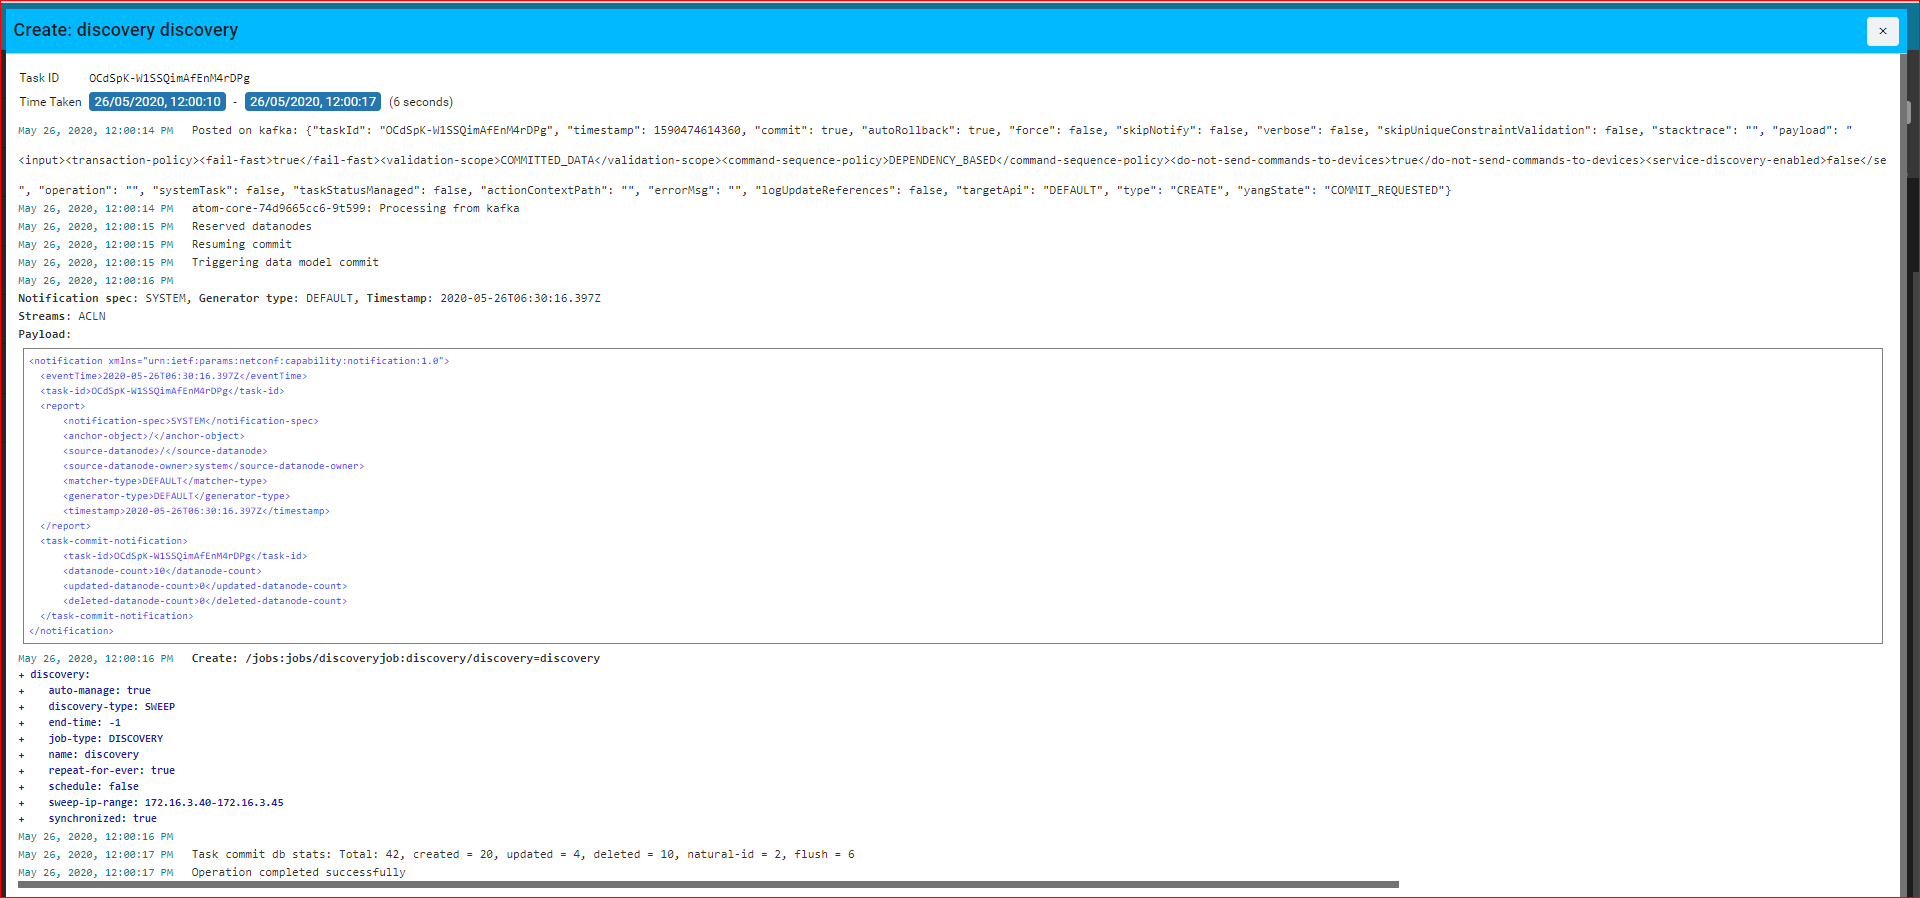
Details of the Executed Job along with the devices that are discovered by ATOM in this job are displayed as follows:
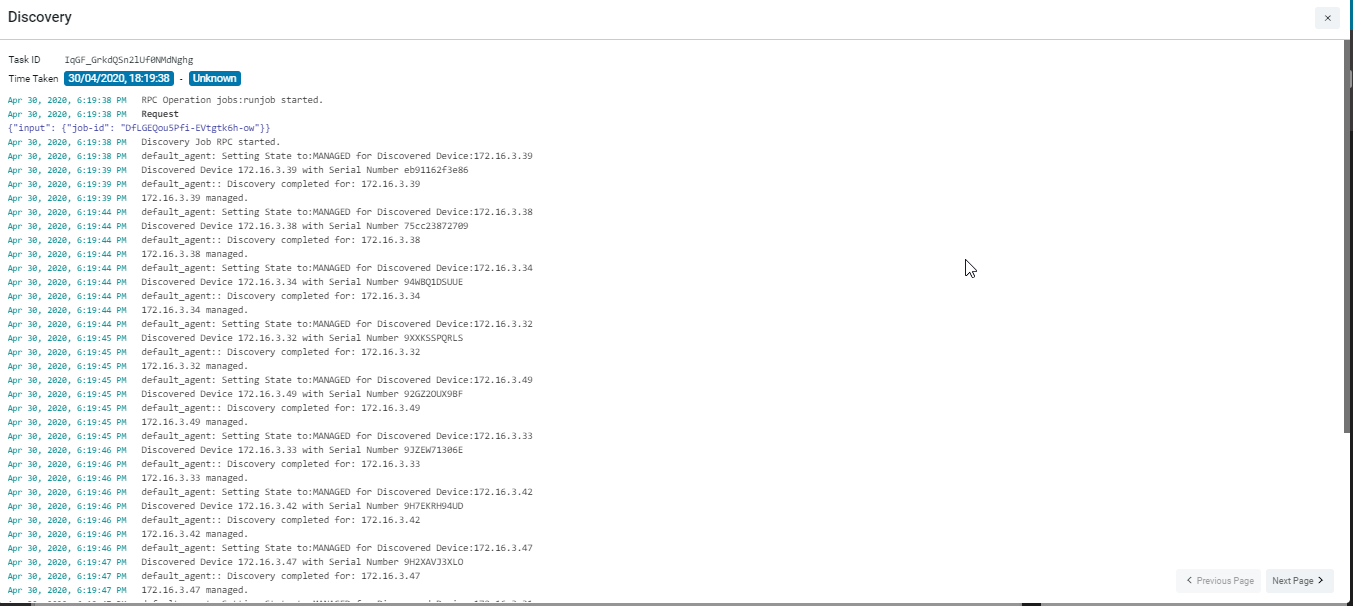

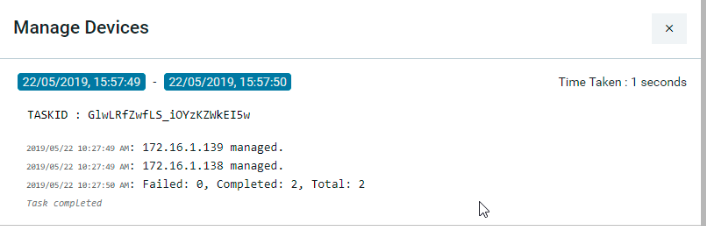
Managed Task
This task will be triggered in ATOM after the successful run of the discovery job. All the discovered devices are added to the device table maintained in the ATOM inventory are marked as “Managed” devices
Inventory Job
Inventory job is used for detecting and adding device Interfaces, interface capabilities, and interface addresses.
Extended Inventory: Retrieves the lost network connections, establishes the new network connections between the devices, retrieves the configurations from the device, By default, this job is scheduled to run every 12 hours.
Maintenance Job
You can configure the maintenance jobs to remove unwanted records of the tasks or the alarms in ATOM. The maintenance jobs can be scheduled on a one-time basis or run
Periodically.
Purge Older Alarm Records
You can remove unwanted, older records of the Alarms generated in ATOM.
Creating a Purge Older Alarm Records Job
1. Navigate to Resource Manager > Jobs
2. In the left pane, navigate to the MAINTENANCE folder
3. Click the MAINTENANCE folder > Actions > Add Job
4. In the Create MAINTENANCE screen, enter the values for each field described below:
- Maintenance Job Name: Enter a name for the maintenance job to be created.
- Description: Enter a suitable description for the job
- Maintenance Type: Select the type as ” PURGE_OLDER_ALARM_RECORDS” to create a job to clean all the old Alarms from ATOM
- Threshold (in days): Enter a number of days, of which the records for which history should be maintained. All the records before the prescribed days will be deleted.
- Schedule: In order to schedule the job to run periodically at specified intervals of time, select the Schedule option.
- Interval: Enter the number for the interval
- Interval Type: Select either Hour or Minute as units of time.
Example:
If 30, 24, and HOUR are entered as values in the fields – Threshold, Interval, and Interval Type respectively, a maintenance job is executed every 24 hours that will remove all the Alarm records older than 30 days. That is, all the records of the previous month before the 30th day will be deleted..
Purge Older Task Details Records
You can schedule a maintenance job that can be run to remove all the details of the tasks run before a specified period in time.
Creating a Purge Older Task Details Records
1. Navigate to Monitoring> Jobs
2. In the left pane, navigate to the maintenance folder
3. Click the maintenance folder > Actions > Add Job
4. In the Create maintenance screen, enter the values for each field described below:
- Maintenance Job Name: Enter a name for the maintenance job to be created.
- Description: Enter a suitable description for the job
- Maintenance Type: Select the type as ” PURGE_OLDER_TASK_RECORDS” to create a job to clean all the details of the tasks
- Threshold (in days): Enter a number of days, of which the records for which history should be maintained. All the records before the prescribed days will be deleted.
- Schedule: In order to schedule the job to run periodically at specified intervals of time, select the Schedule option.
- Interval: Enter the number for the interval
- Interval Type: Select either Hour or Minute as units of time.
Example
If 30, 24, and HOUR are entered as values in the fields – Threshold, Interval, and Interval Type respectively, a maintenance job is executed every 24 hours that will remove all the details of the tasks older than 30 days. That is, all those task details of the previous month before the 30th day will be deleted.
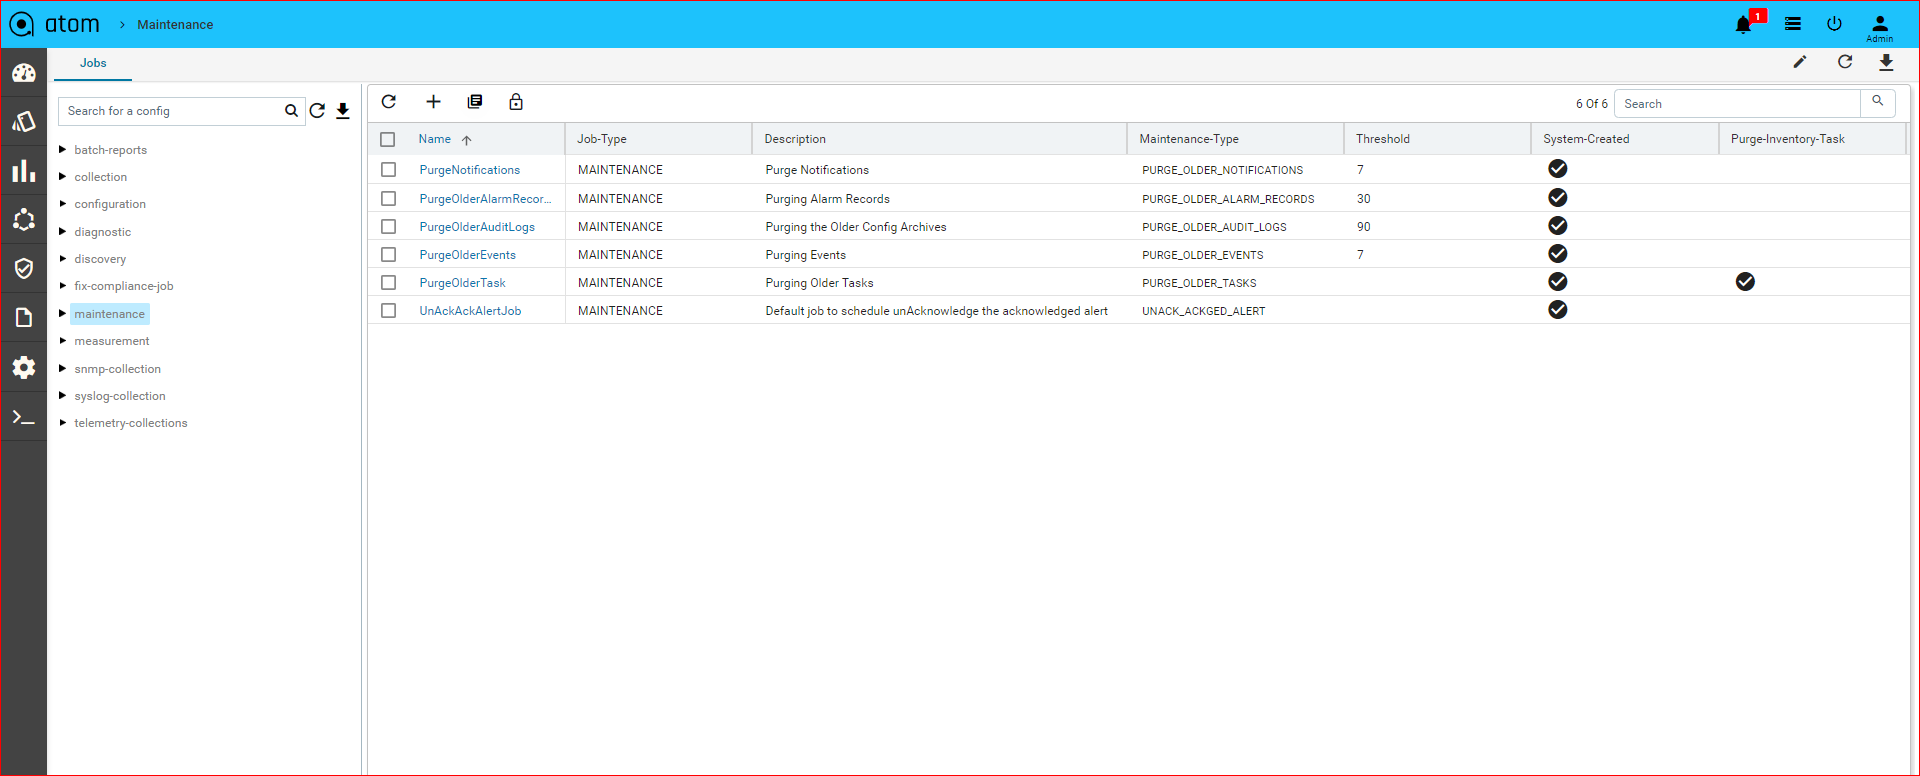
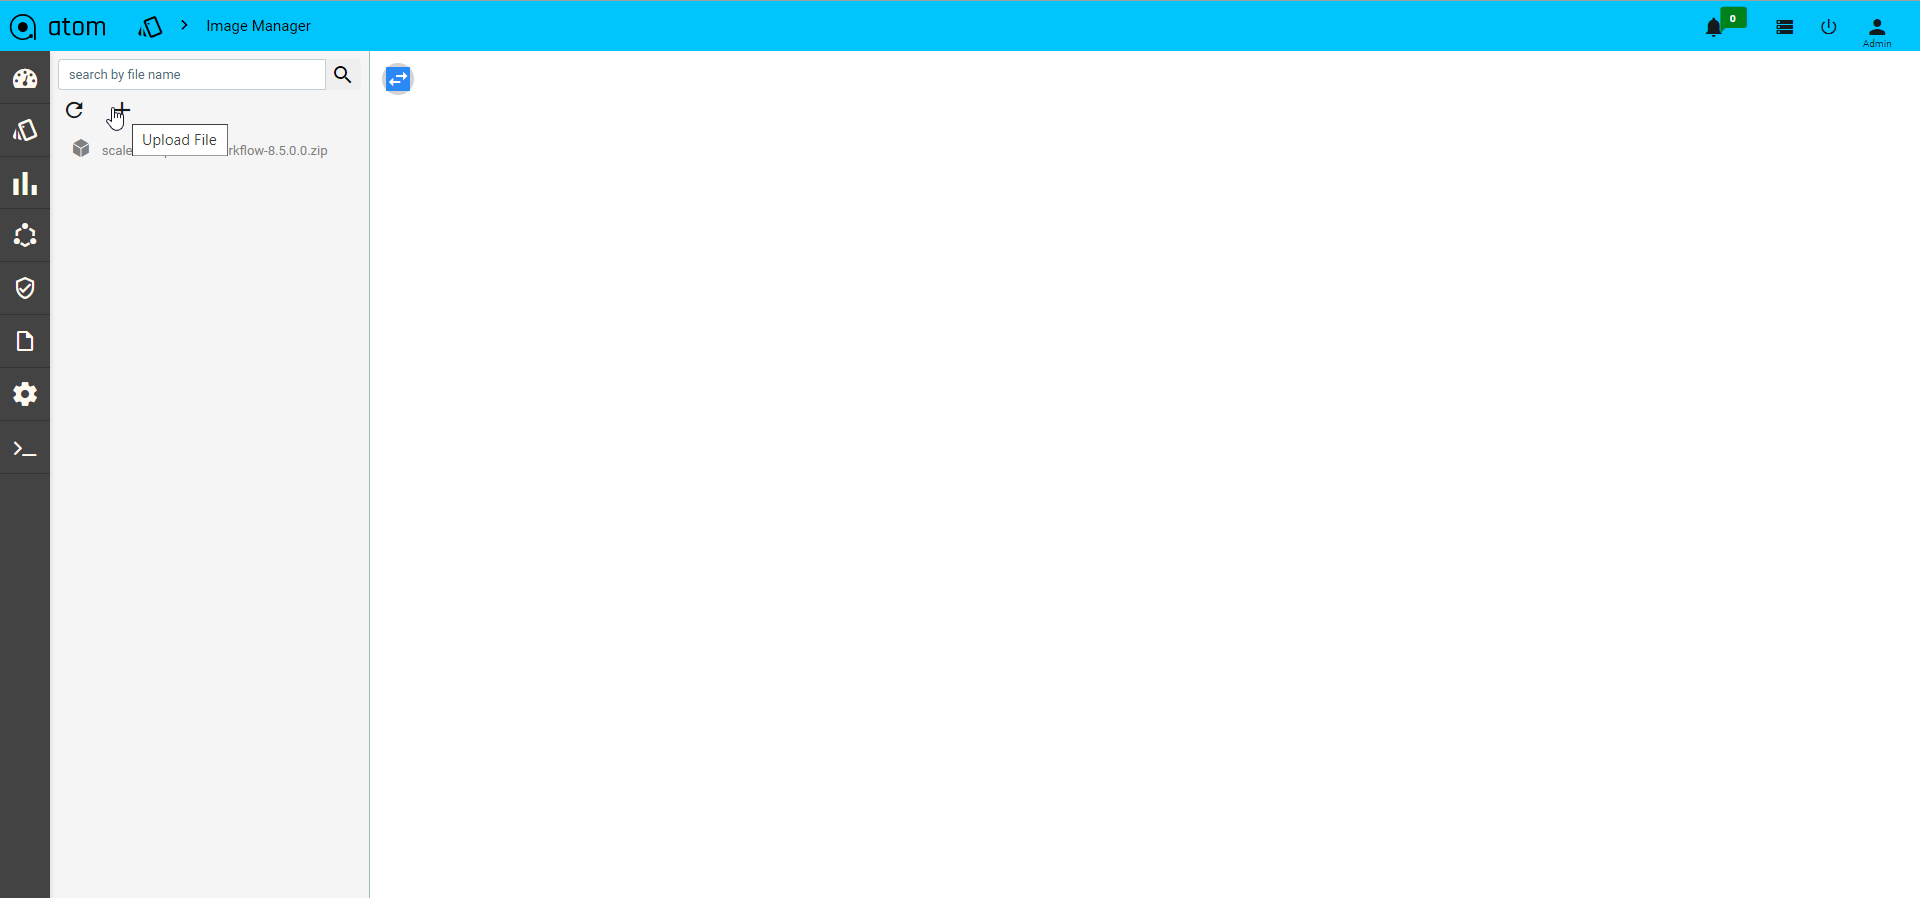
Image Manager
ATOM acts as Network Element Image Repository (Image Server). Devices can boot an Image from ATOM Image Server manually or through ATOM Network Element Software Image Upgrade Workflow. Image Transfer is supported through SFTP.
Following steps enable SFTP on ATOM & Upload Images:
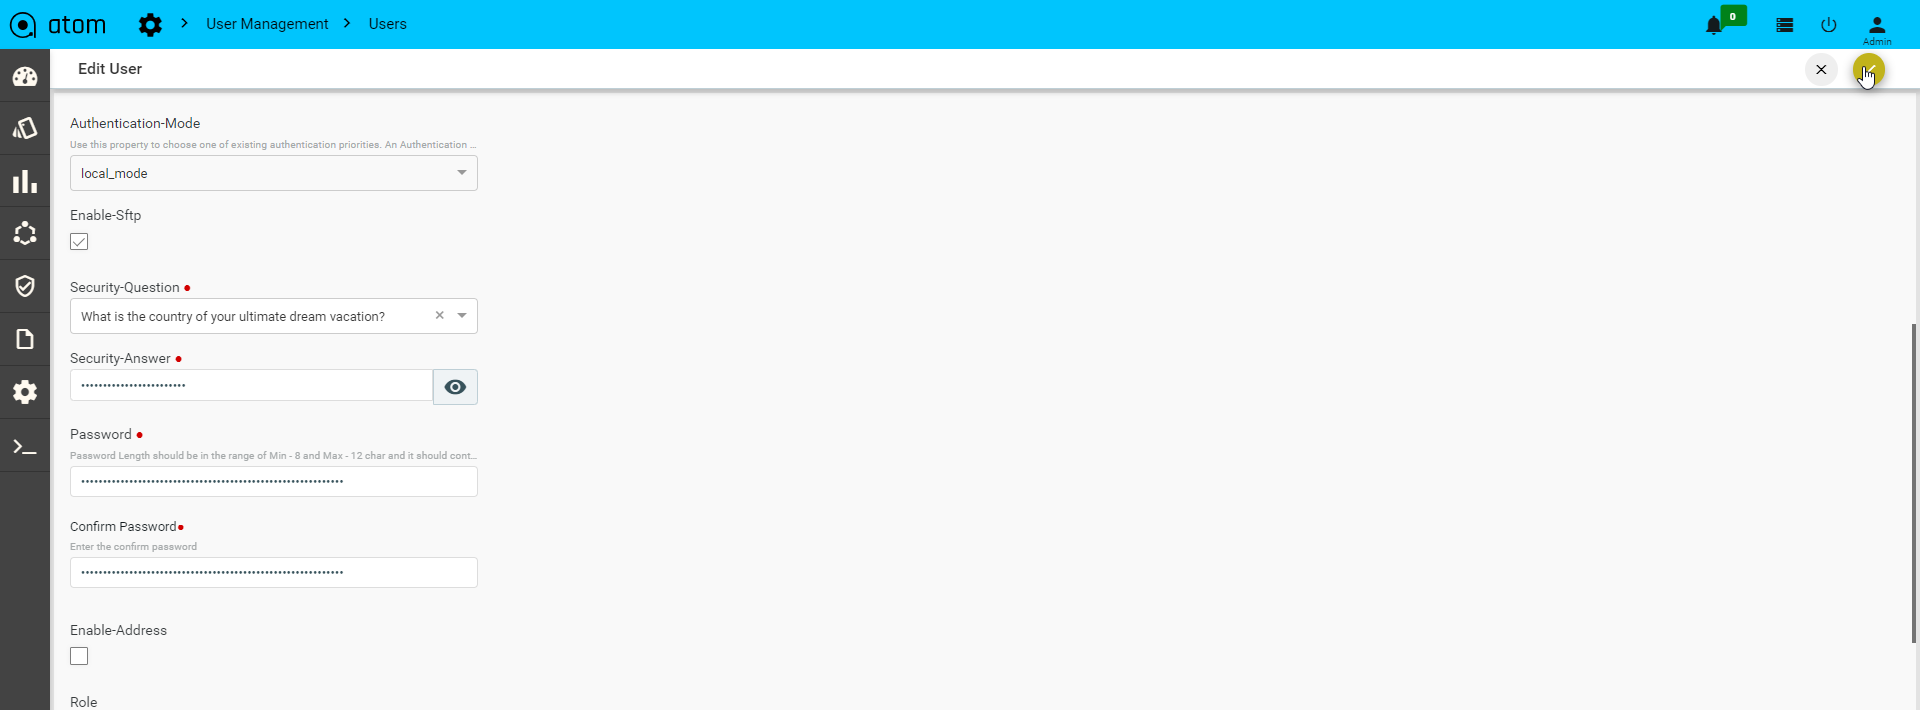
- Navigate to Administration > User Management > Users and select the target user and click on edit.
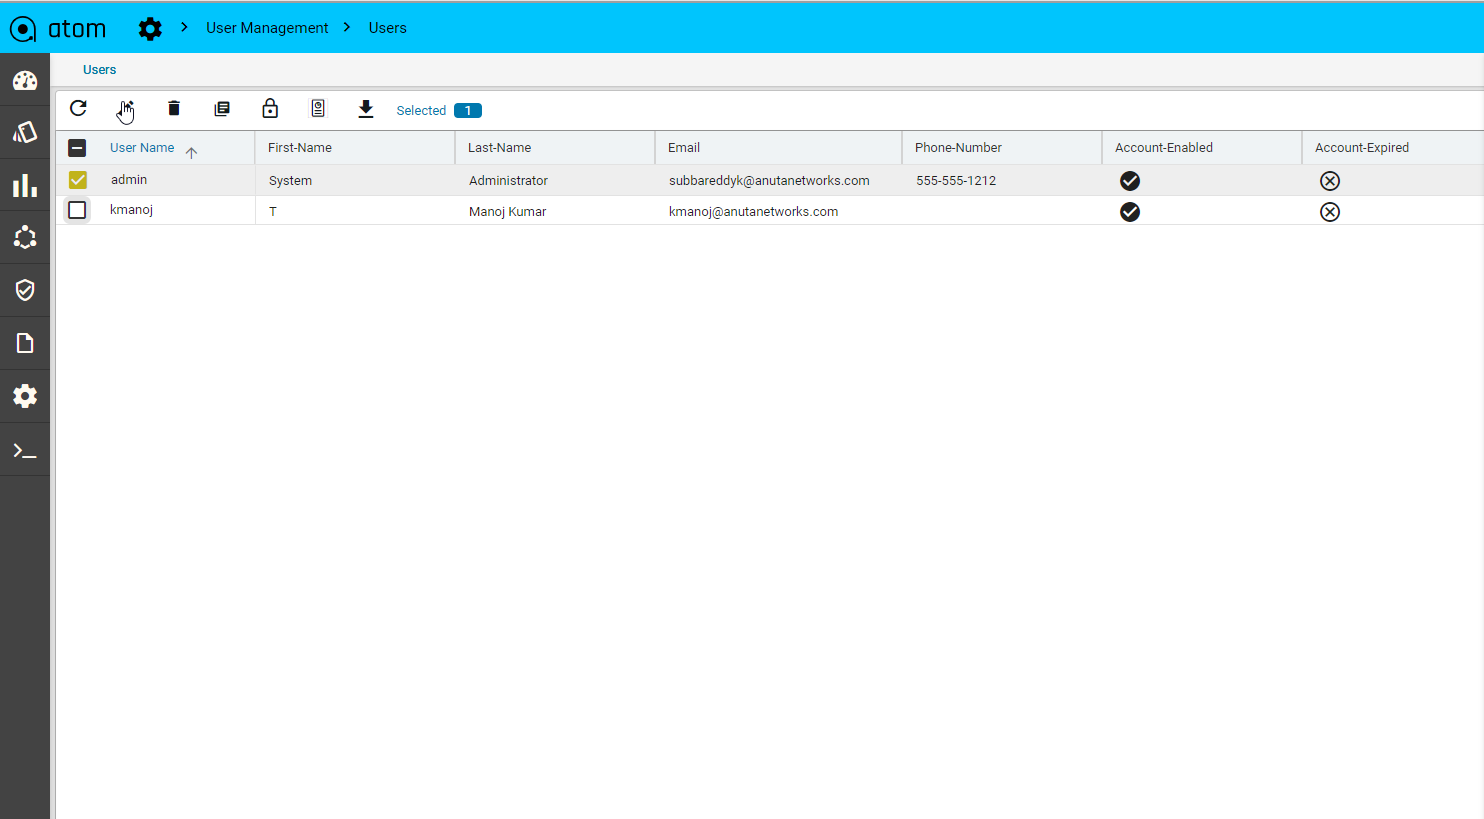
- Enable SFTP in the user and click on save option.
- To upload a file to the Image Manager navigate to Resource Manager > Image Manager
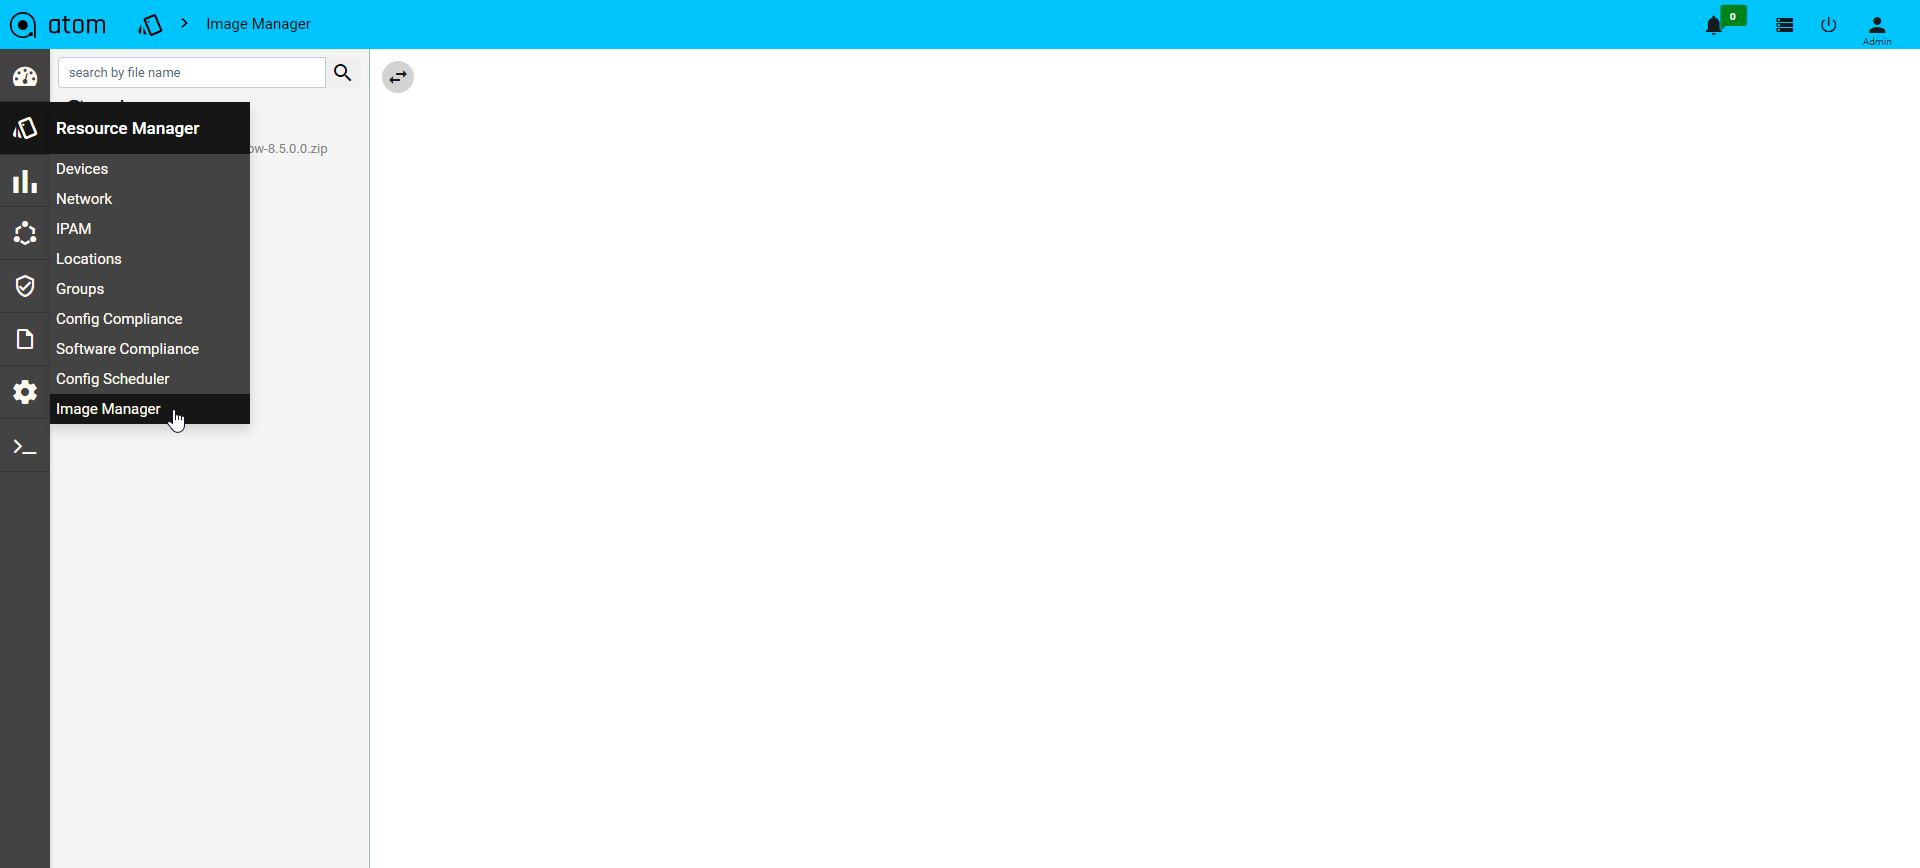
- Click on the upload option
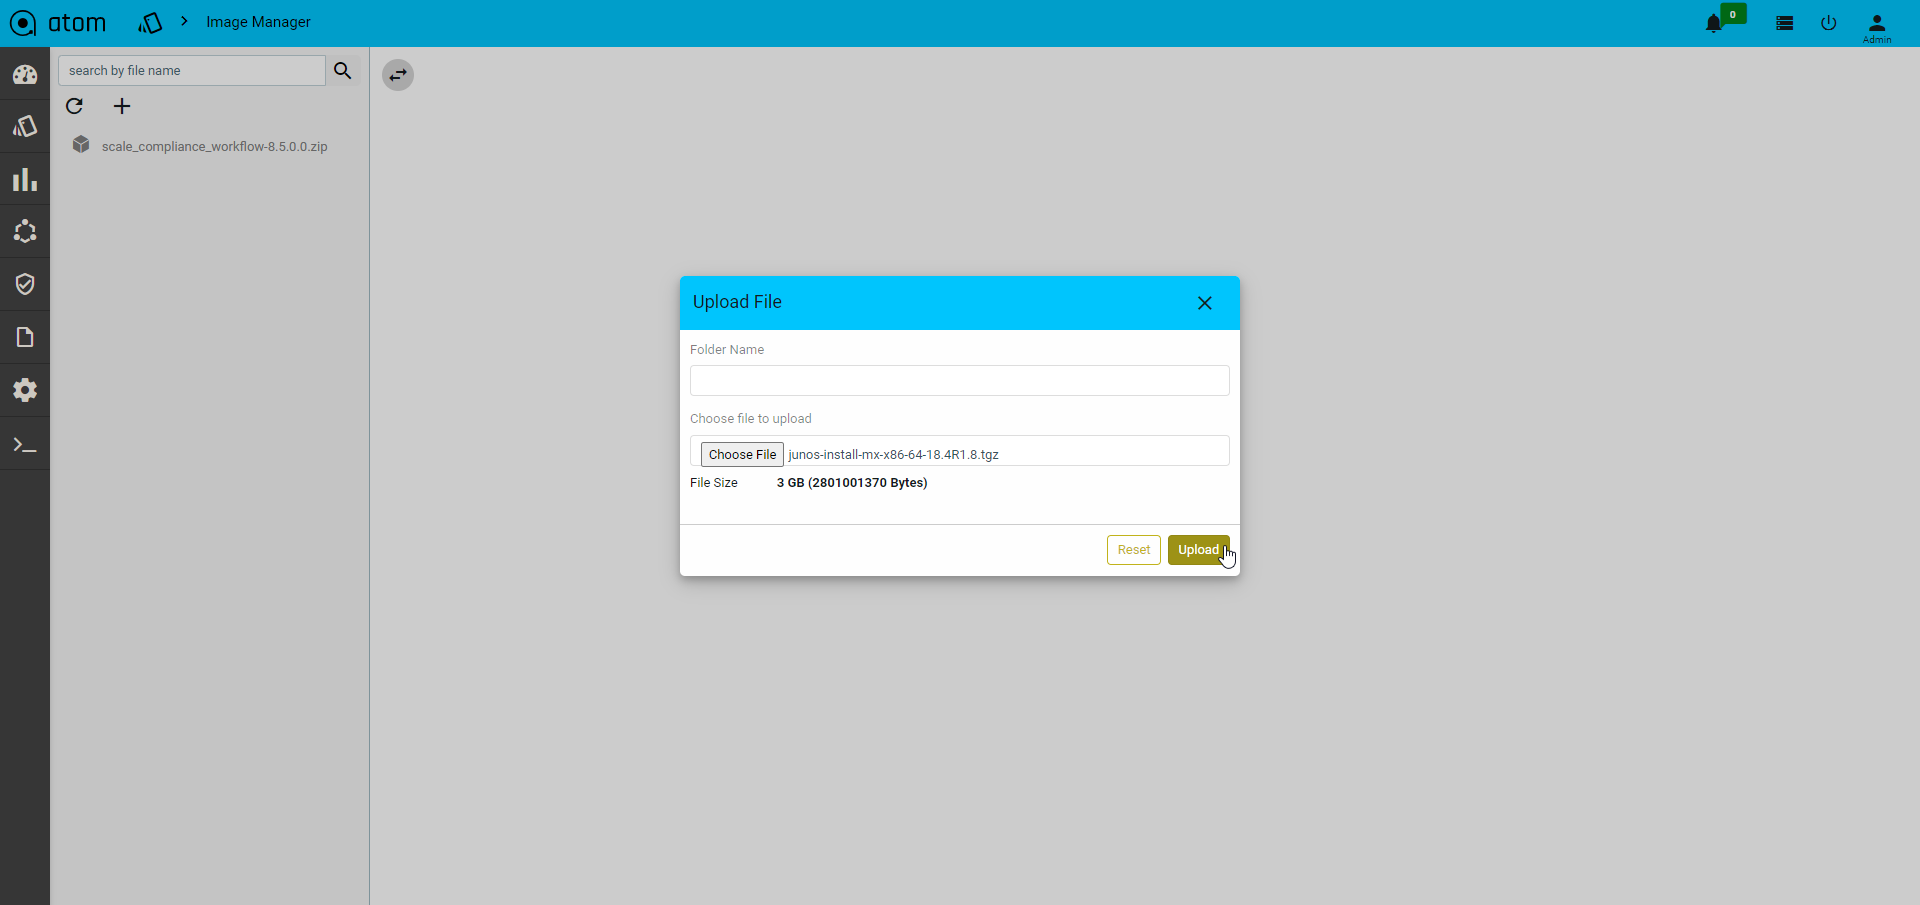
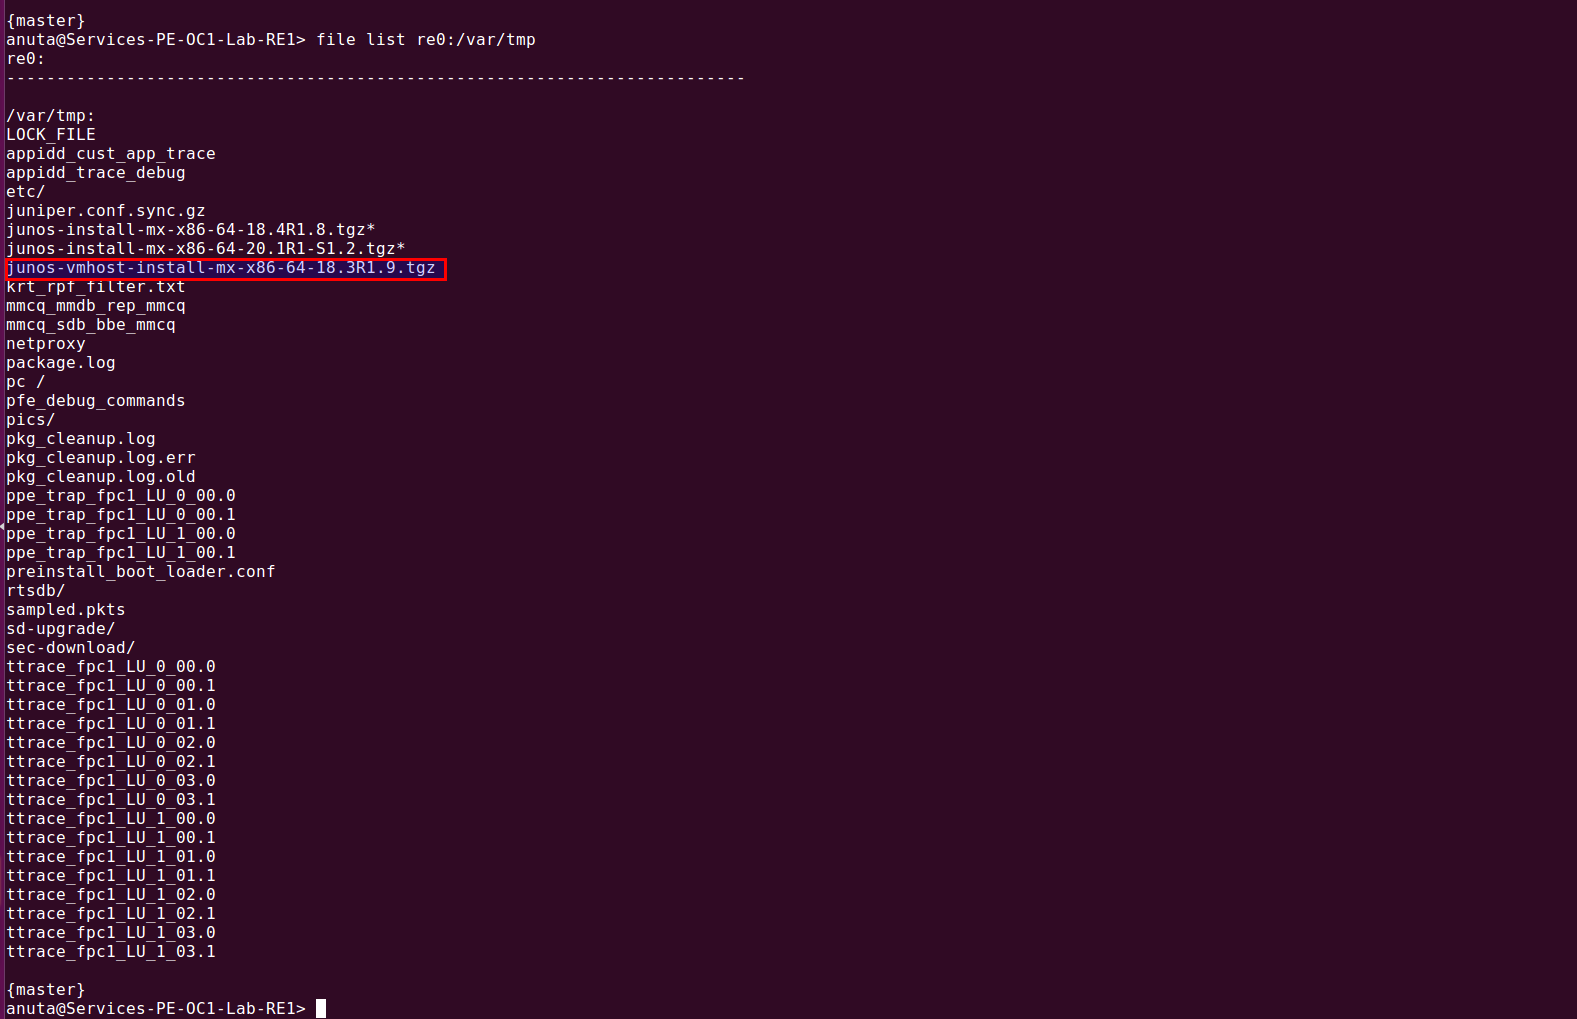
Once files got uploaded to the image-manager then login to the client device, then transfer the files to a particular location on device by using scp protocol..Syntax : file copy scp://{user-name}@{file-server IP}:{file-server node port}:/{path}/{file-name} {Destination path}/{file-name}
Example : file copy scp://admin@10.113.10.44:32222:/pub/images/junos-vmhost-install-mx-x86-64-18.3R1.9.tgz re0:/var/tmp/junos-vmhost-install-mx-x86-64-18.3R1.9.tgz
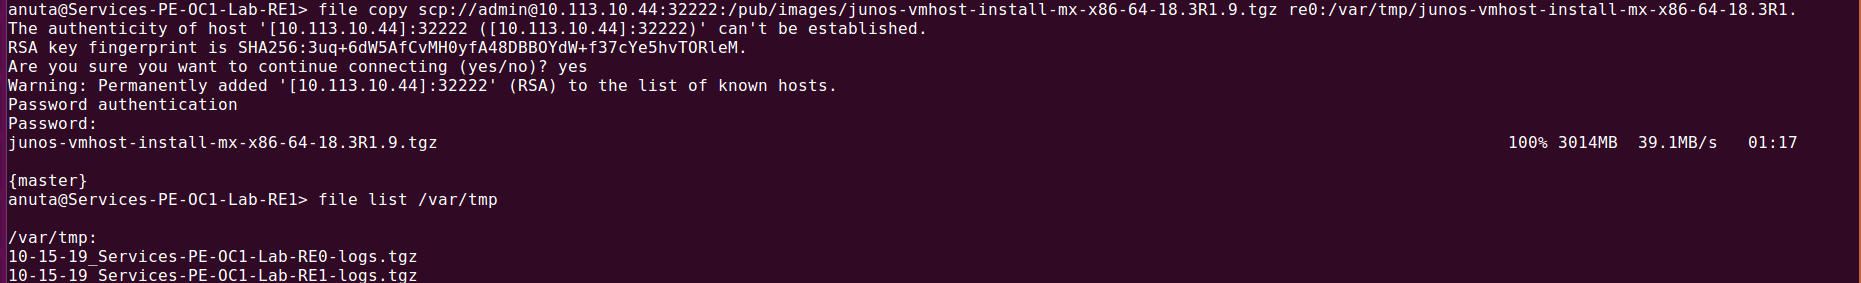
| Note: When you try to copy the file from the file server to the client then service atom-file-server-node ports should be running. |
Network Automation
ATOM provides stateful or Service and stateless (MOP) automation framework.
Stateless, Low Code or MOP automation – Low Code Workflow automation enables network administrators to perform method-of-procedures involving different actions configuration, operations including show & exec commands on the device. Multiple actions can be stitched together to form a flow. Such flow is executed on one more device with appropriate user inputs.
Example:
- Device Software Image Upgrade
- Protocol Migration [IPV4 TO V6, OSPF to ISIS]
- Hardware RMA/ Refresh [Moving from one vendor to another]
MOP Automation can be a combination of Stateless Action and Staful actions as well. In such scenarios MOP will contain stateless actions like pre-checks while performing API invocations against Device or Service Models to perform stateful transactional action.
Such tasks have no requirement for statefulness and can be best developed using Workflow Automation.
Example:
- Application Deployment in Data Center with Pre-checks and Post-Checks
- Branch Config Deployment with Pre-Checks & Post-Checks
Stateful, Service Automation – ATOM Service automation helps administrators develop stateful and atomic transactions. Admins can create service models that enable Create, Update and Delete operations (CRUD). Such operations can be carried out throughout the life of the service. Brownfield service discovery is also supported.
Example:
- Application Deployment in Data Center
- Layer-3 VPN
- Layer-2 VPN
- Private Cloud to Public Cloud Interconnect
Network Workflow & Low Code Automation
Workflow breaks down an activity into subtasks and ties them together with network events, provisioning actions, show-commands, pre-checks, post-checks, user forms and approvals, timed background tasks, inventory checks etc.
Workflow Automation offers an intuitive graphical designer to automate network provisioning and maintenance activities.
Administrators can create simple or complex flows using ATOM Workflow’s drag and drop interface. ATOM Workflow has prebuilt adaptors to enable integration with ticketing, billing, OSS, BSS and many other network elements. Workflow can also automate multi-level approval sequences. Use workflows for a one time project or for repetitive tasks. Workflow development is covered in “Workflow Modelling” section in the ATOM Platform Guide guide. For automation of tasks that require stateful and atomic transactions it is advised to use ATOM Service Models discussed in ATOM Platform Guide.
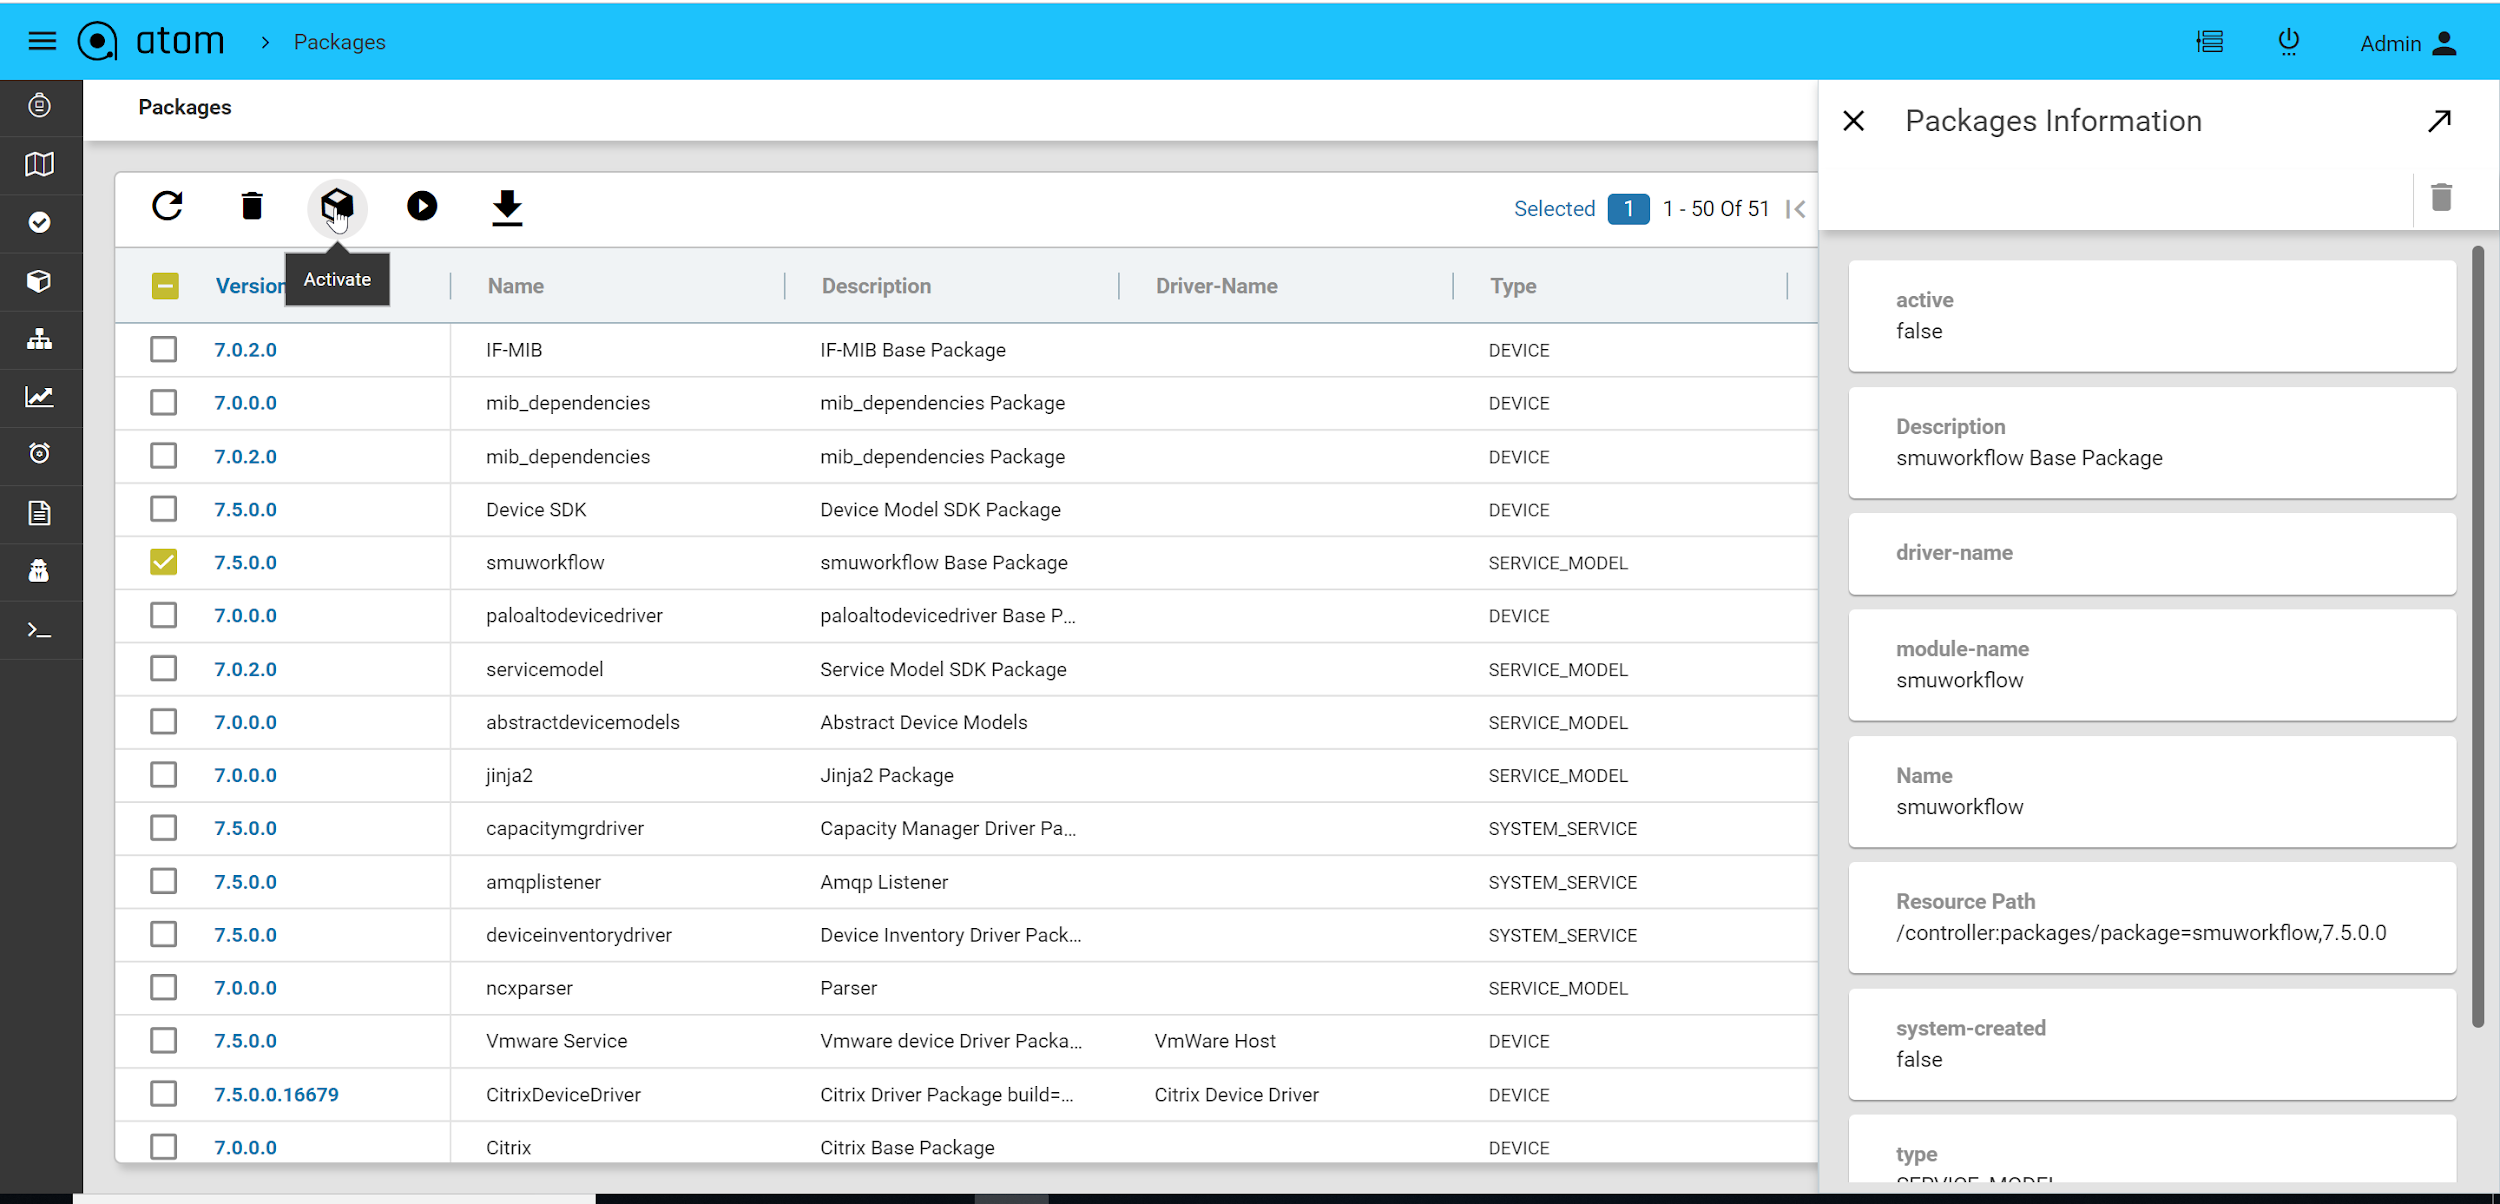
Uploading Workflow Package
Navigate to Administration > Plugins & Extensions > Packages
- Click on Add at the top bar to upload the packages.
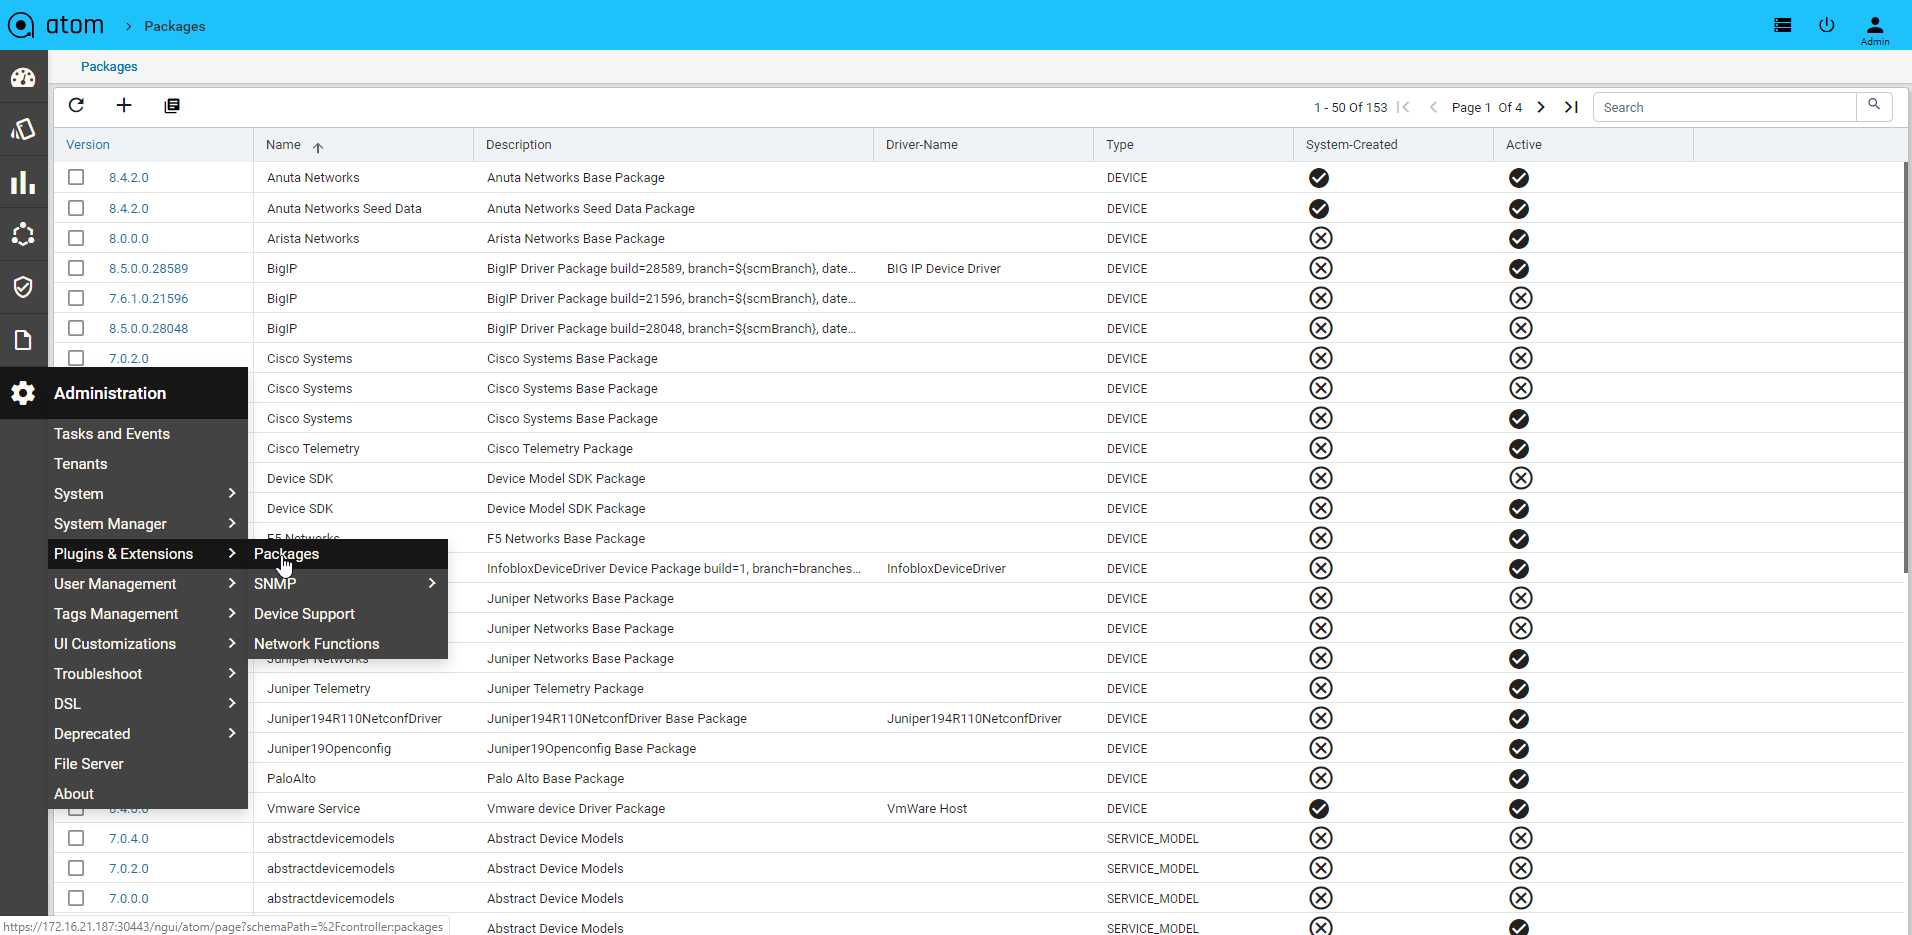
- Upload workflow package and click on the tick mark
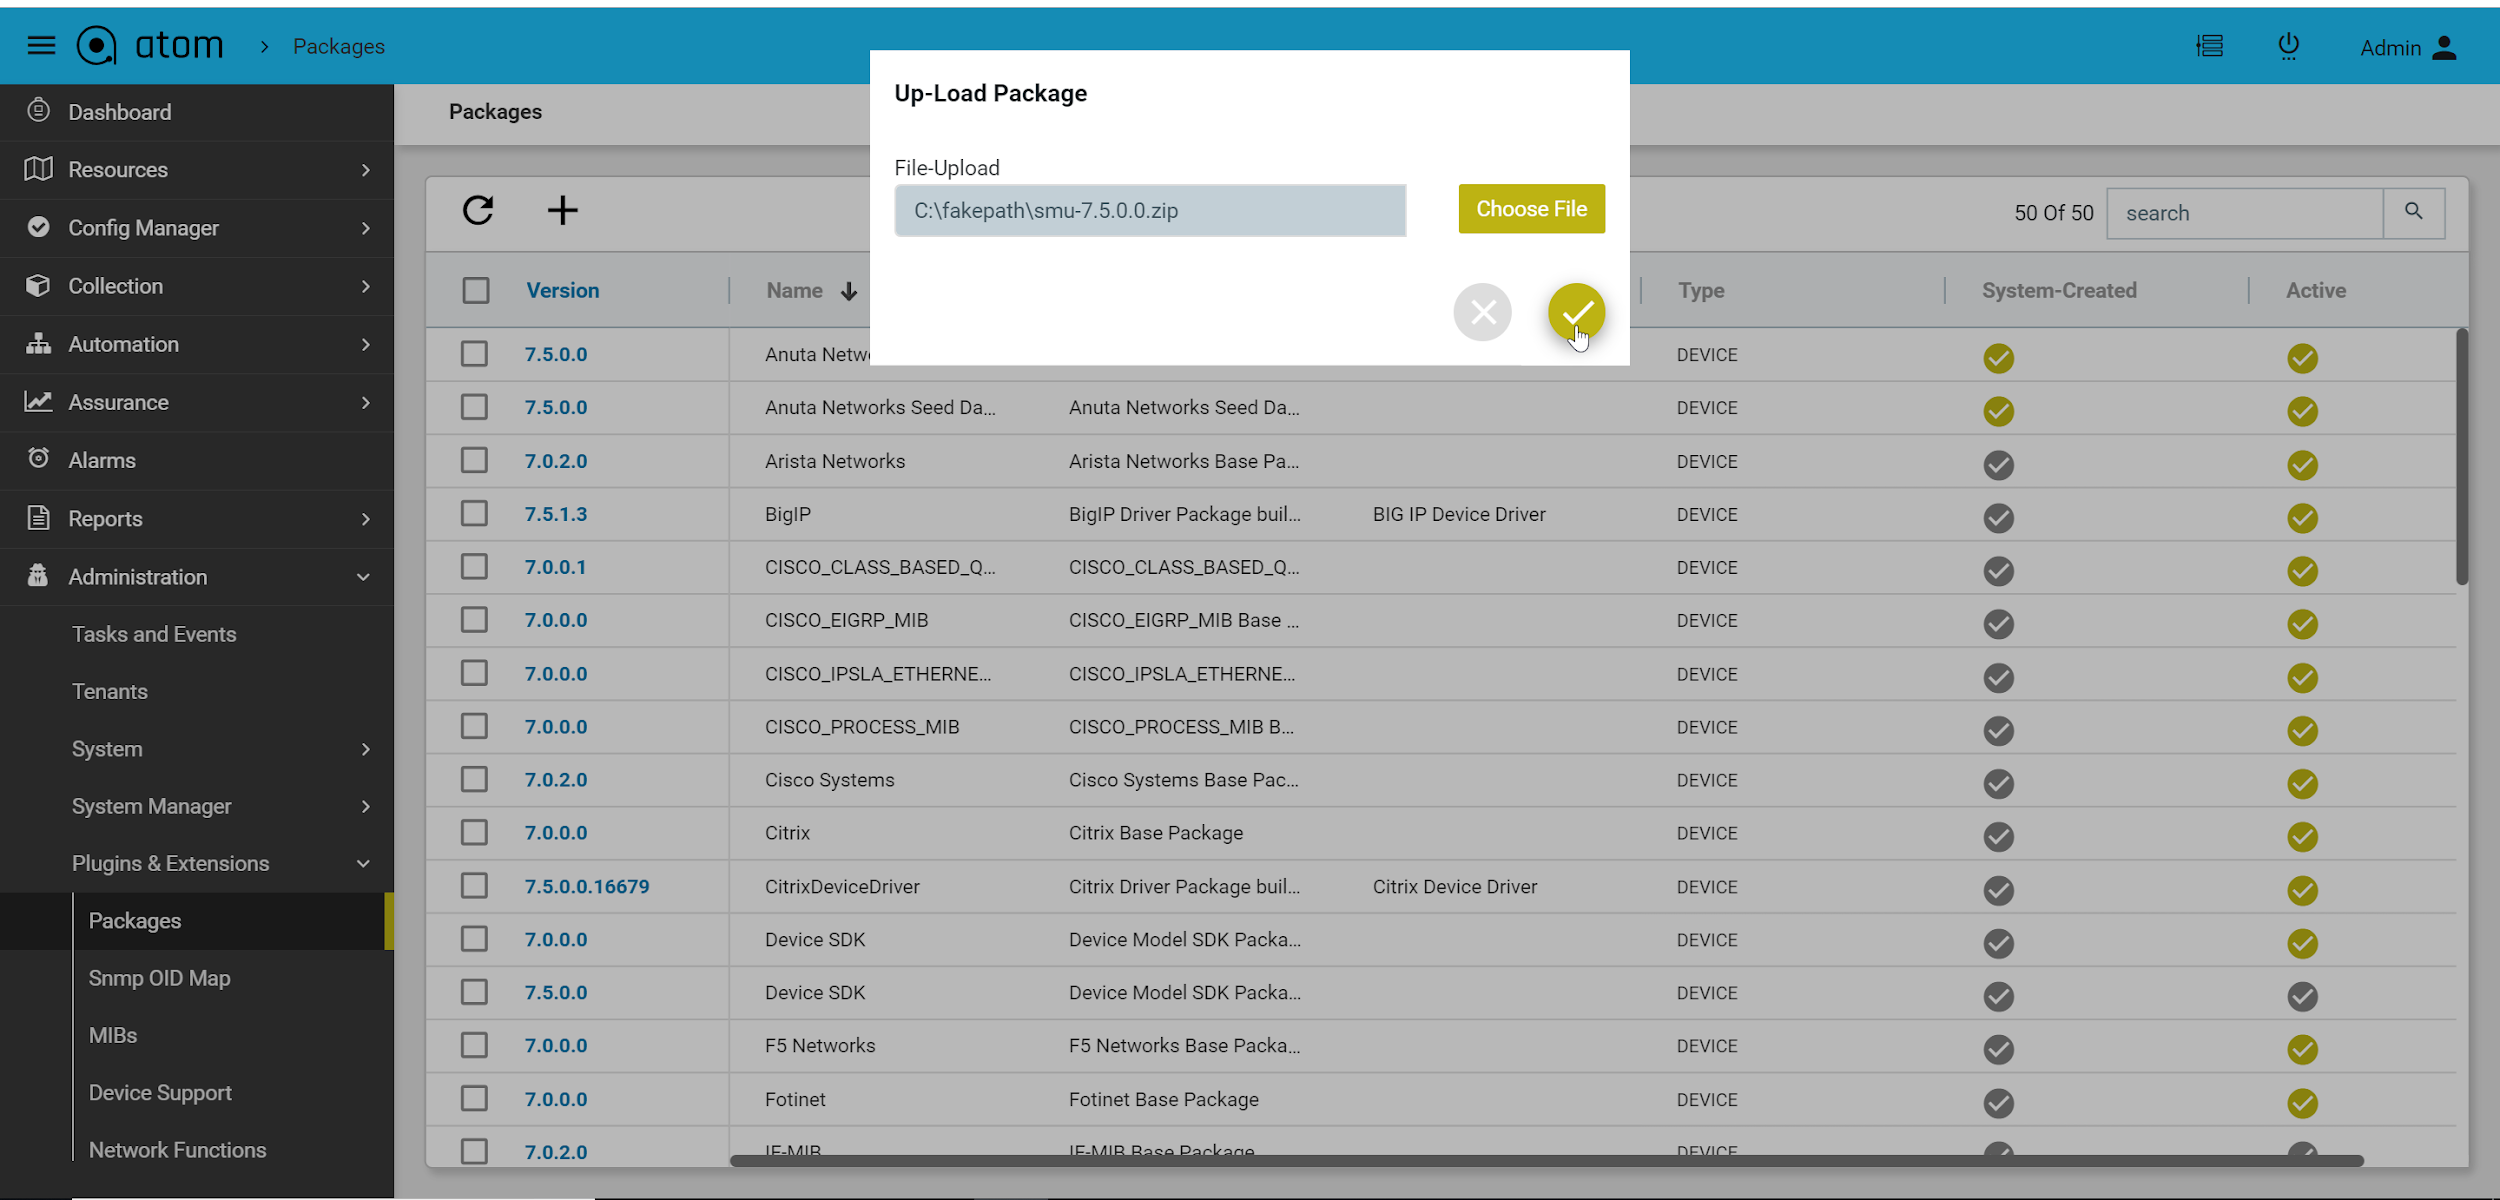
- Select the package and click on Activate
Workflow Lifecycle Management
A workflow definition defines the structure of a workflow. A workflow instance is an individual execution of a workflow definition.The relation of the workflow instance to the workflow definition is the same as the relation between Object and Class in Object Oriented Programming.The workflow engine is responsible for creating workflow instances and managing their state.
Workflow Instances traverse different states as they progress from the start to end.The various states are as listed below:
- Active : Once the workflow is started it gets into an active state. Through-out the different tasks , workflow continues to be in an active state and indicates an error free execution.
- Error State : If there are unhandled exceptions in the scripts and programmatic/syntactic errors in inline scripts the workflow execution goes to an error state.
- Internally Terminated : If there are any errors in communication with the device or any custom RPCs throw exceptions which don’t have explicit error handling defined in the workflow they are internally terminated by ATOM and state is updated accordingly.
- Externally Terminated: If the Network Administrator finds any unexpected behavior during any point in the workflow execution he has an option of manually terminating the workflow instance. This is the only state which the end user can manually state to terminate the flow.
- Completed:Once the workflow is terminated and has reached the stop event, the workflow goes to a completed stage and indicates a successful positive flow execution.
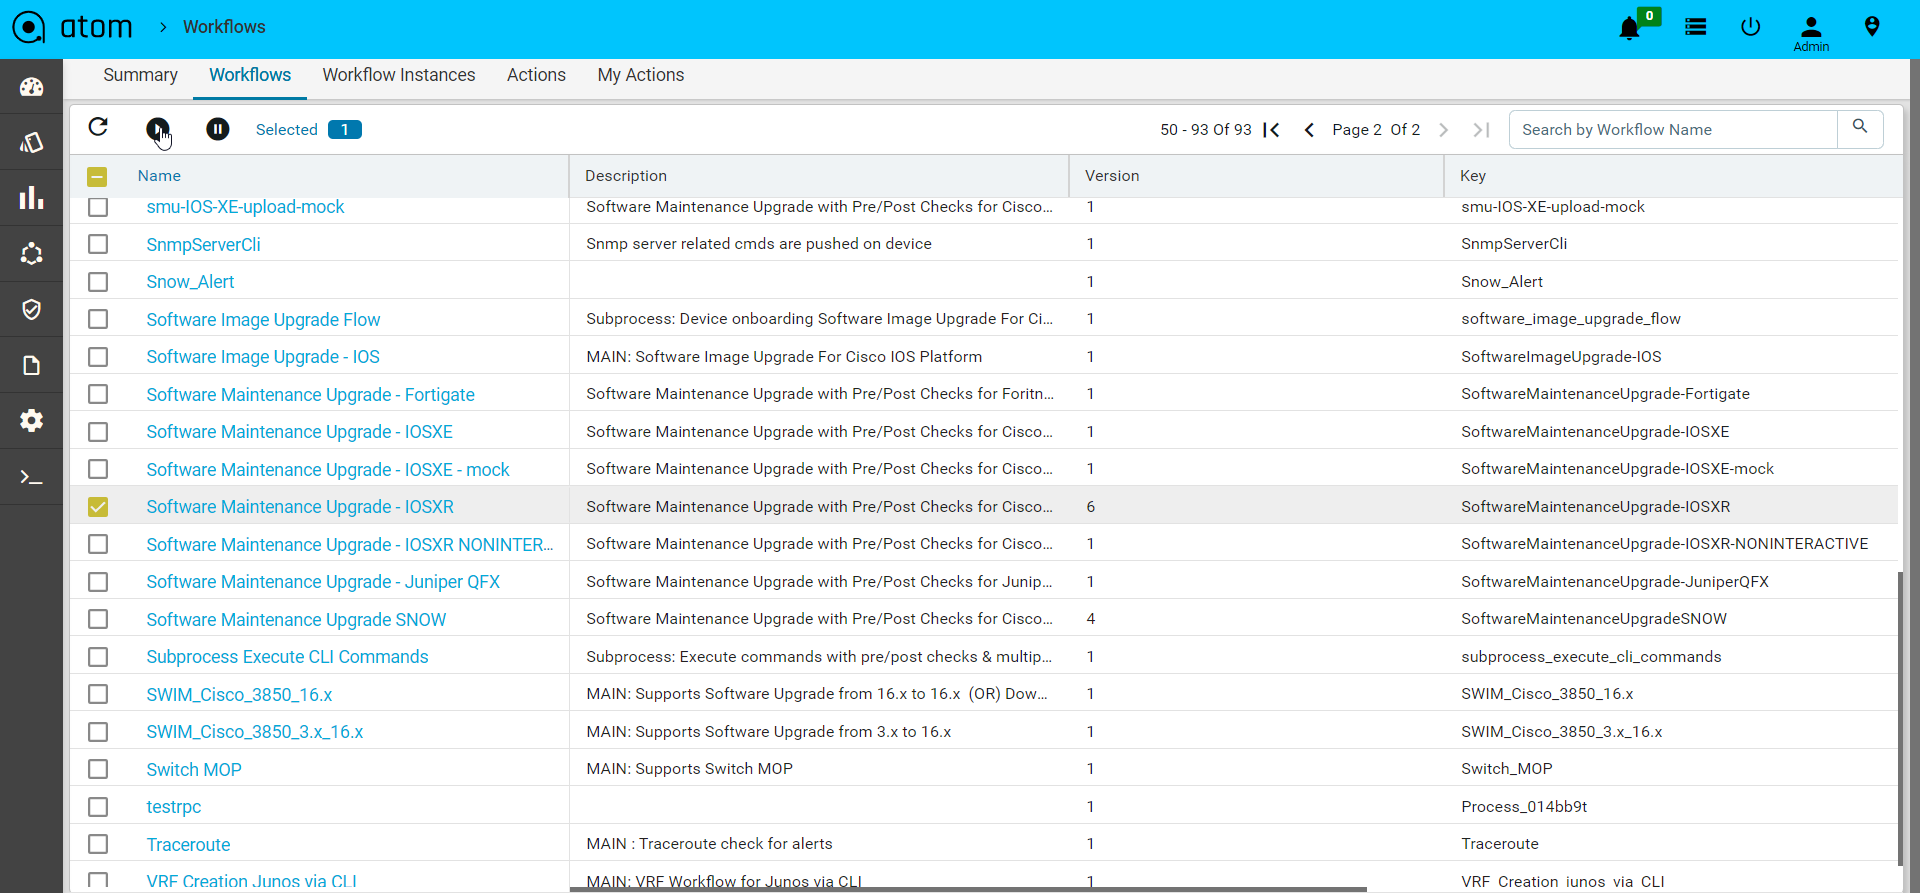
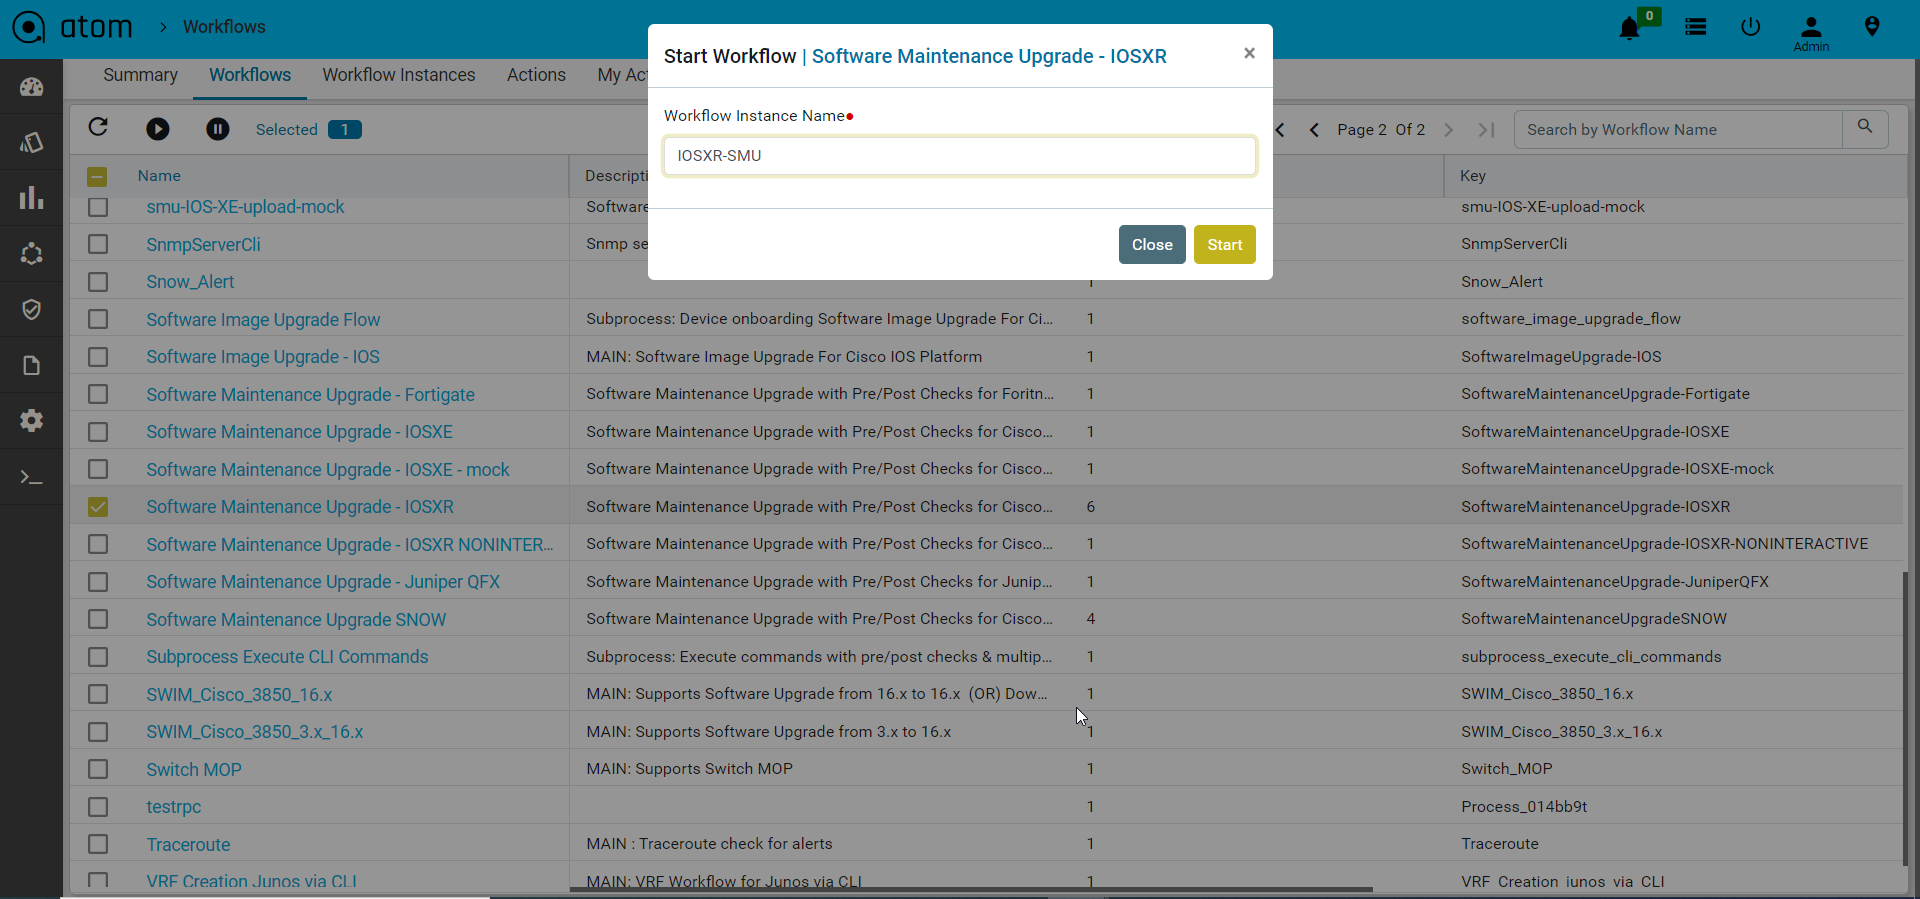
Start Workflows
To start a workflow instance follow the steps below.
- Navigate to Automation > Workflows > Workflows
- Select the workflow package from the list
- Click on Start to start an instance of the workflow and provide valid Instance Name
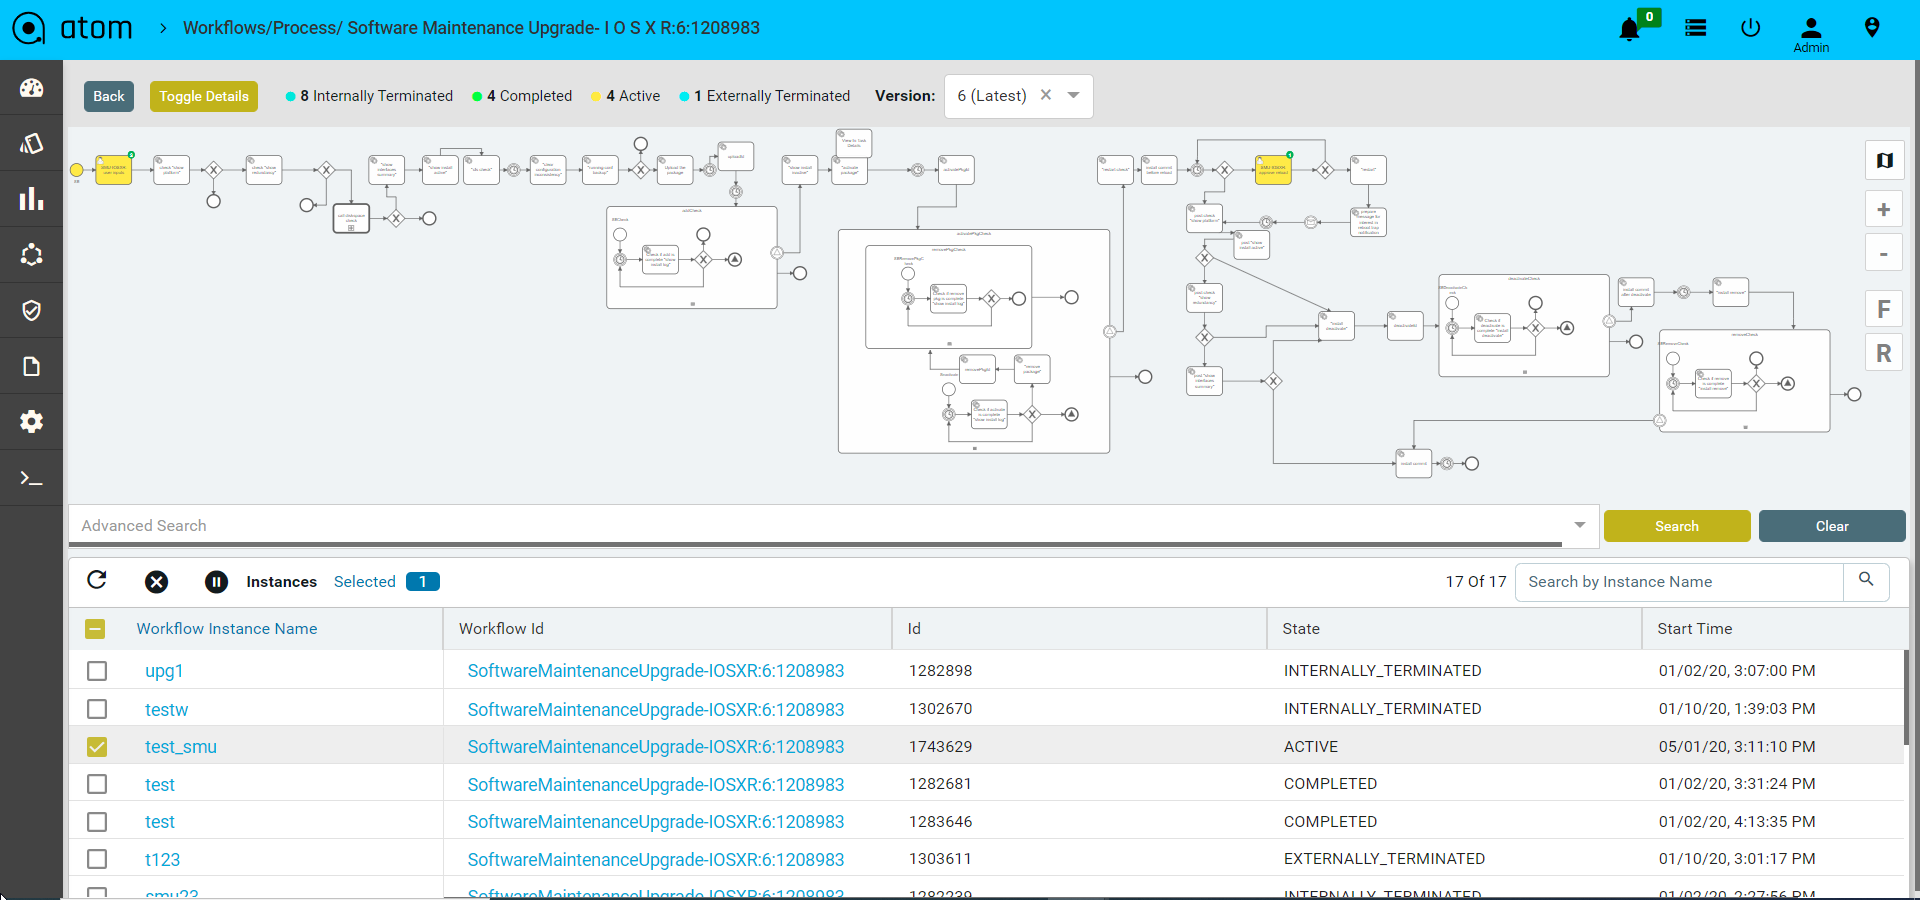
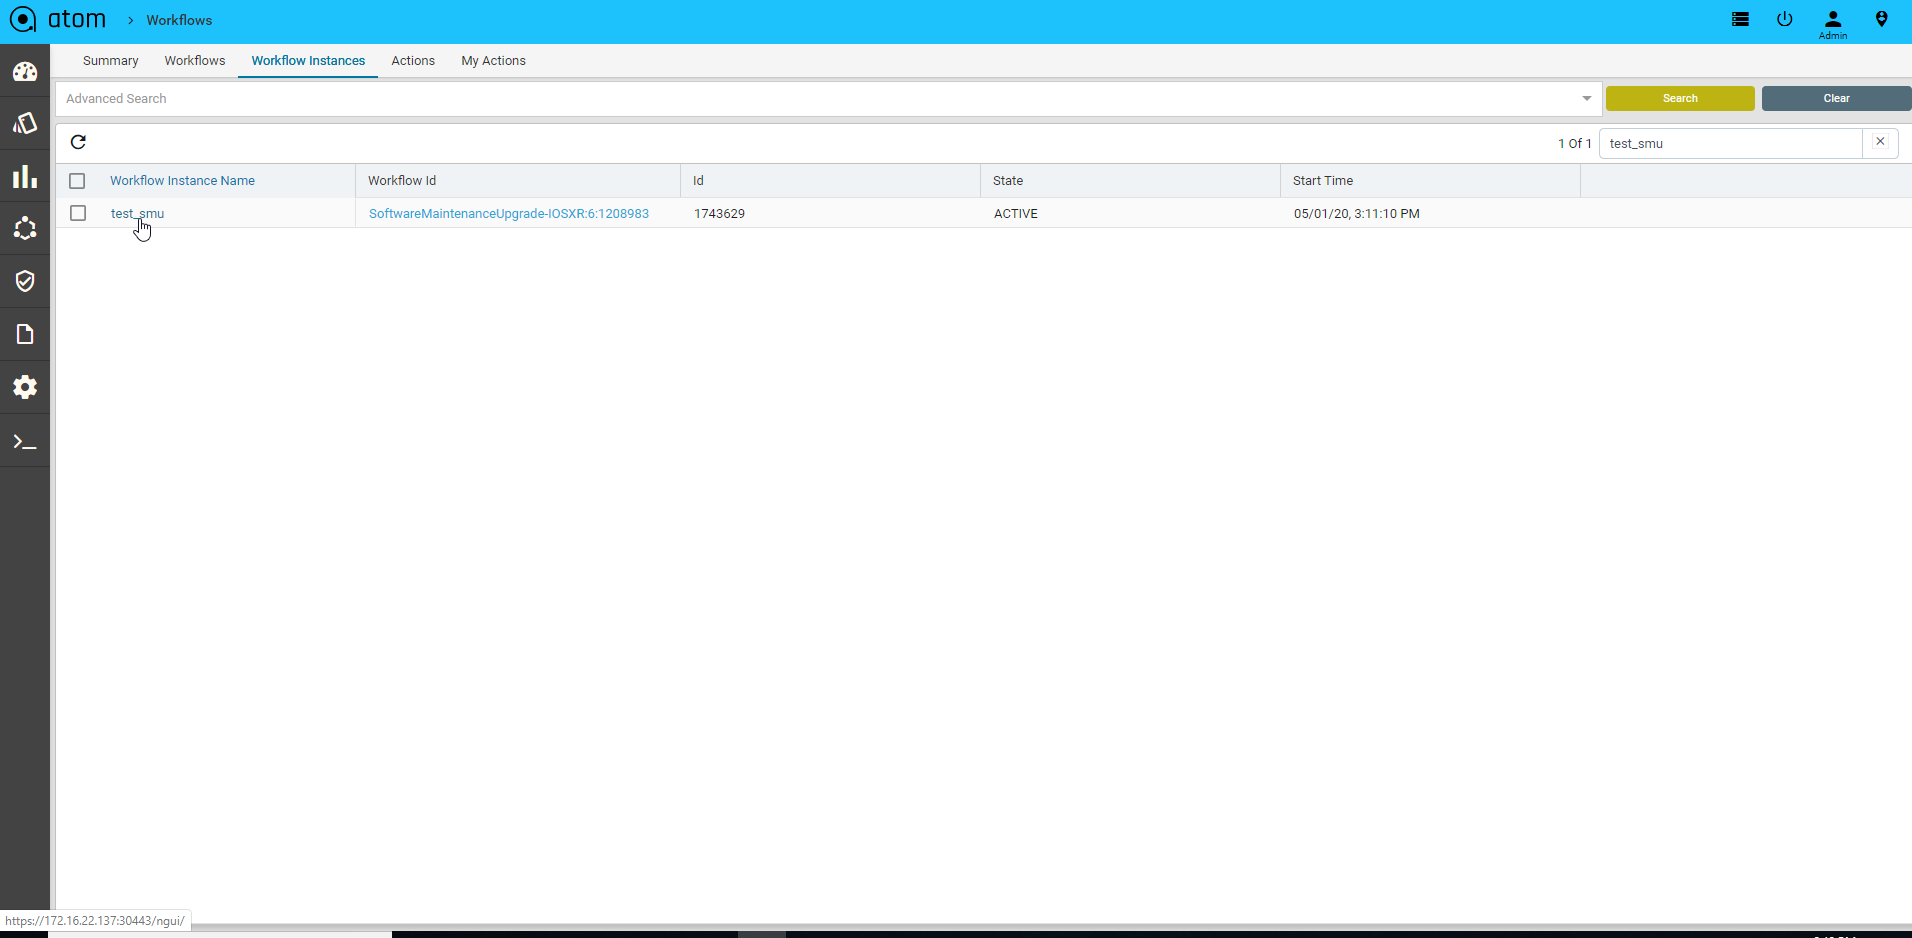
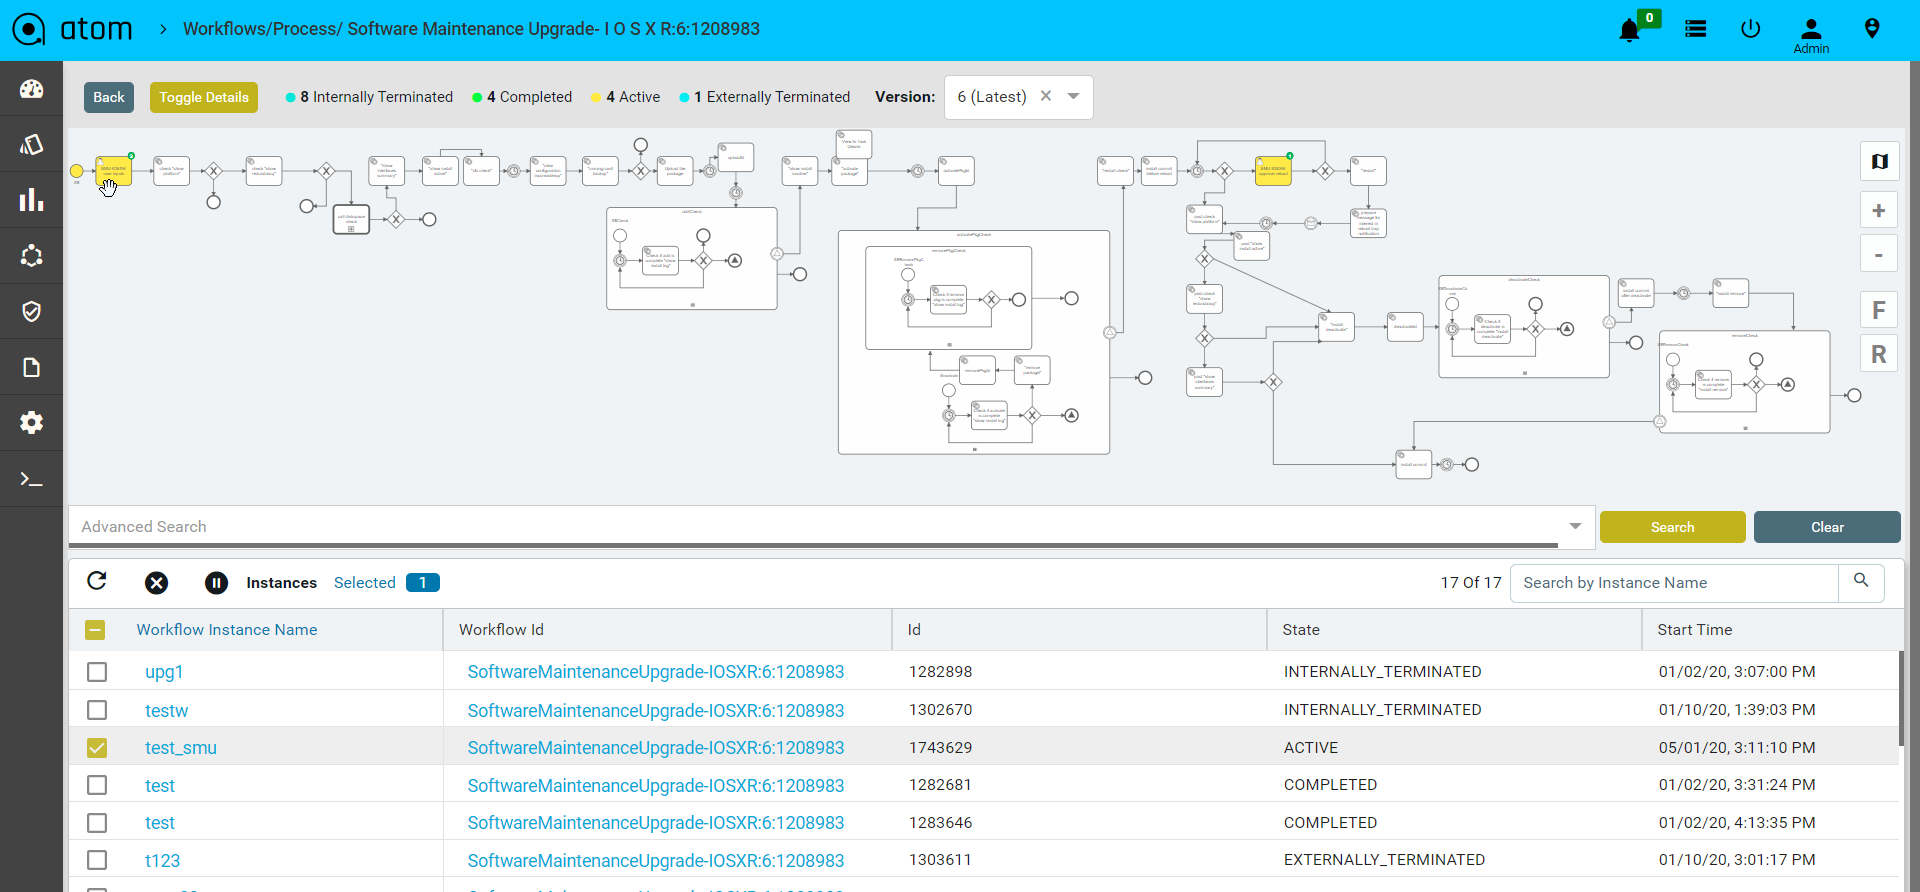
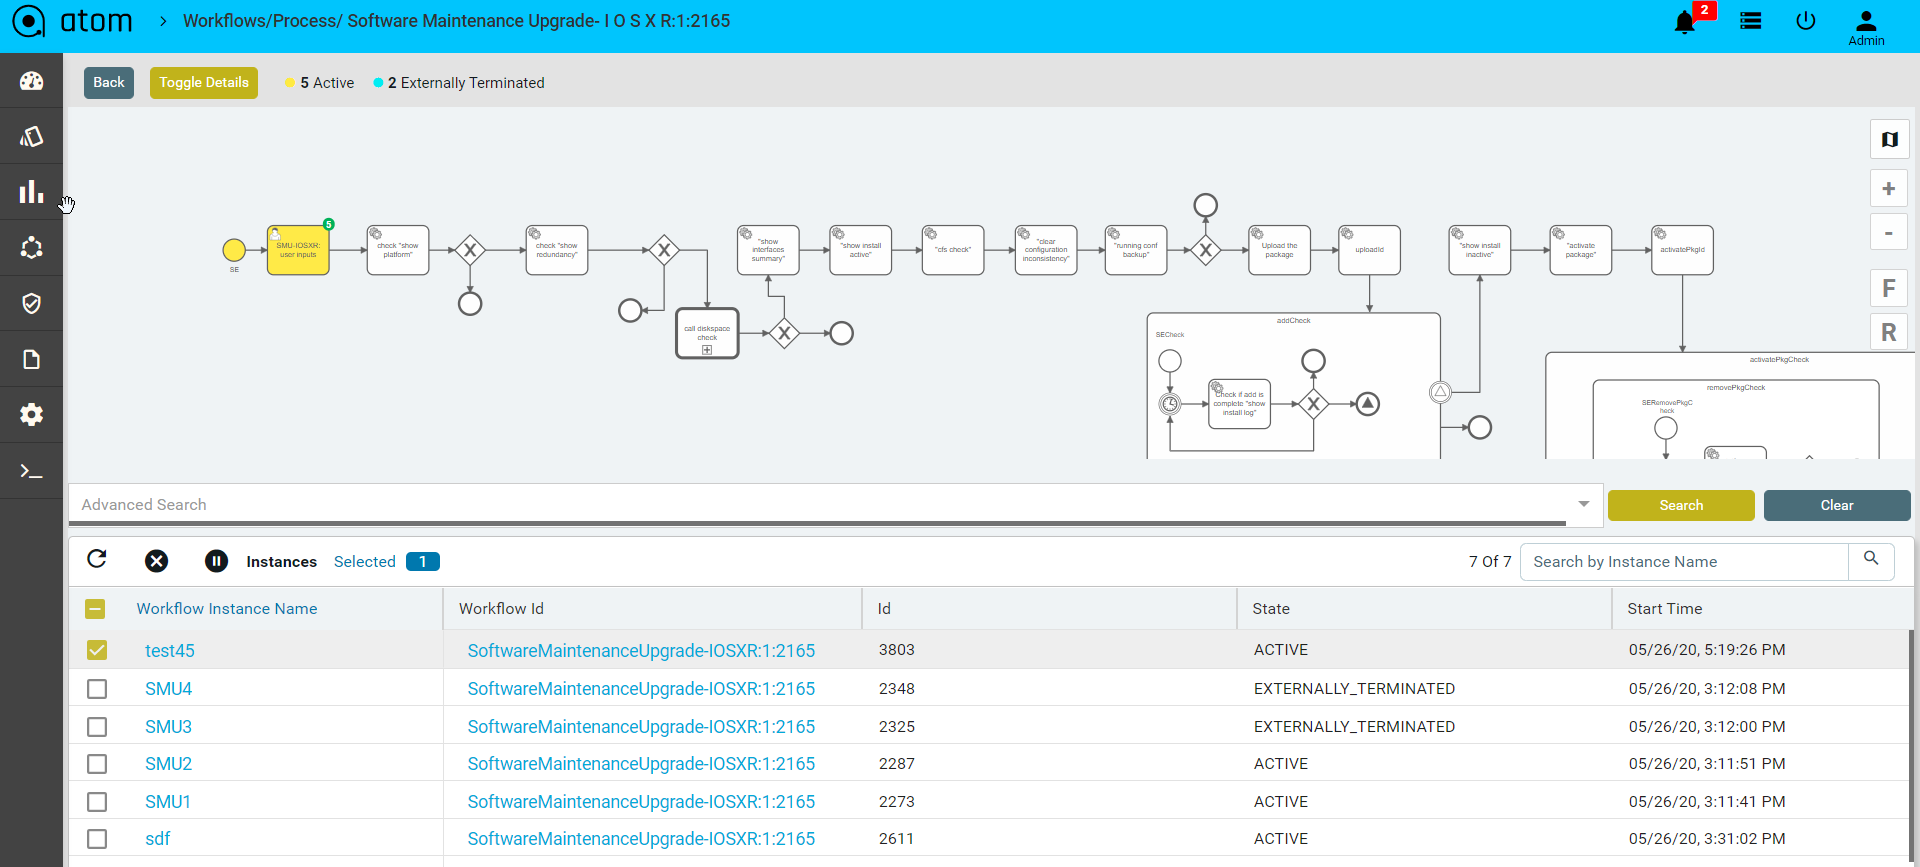
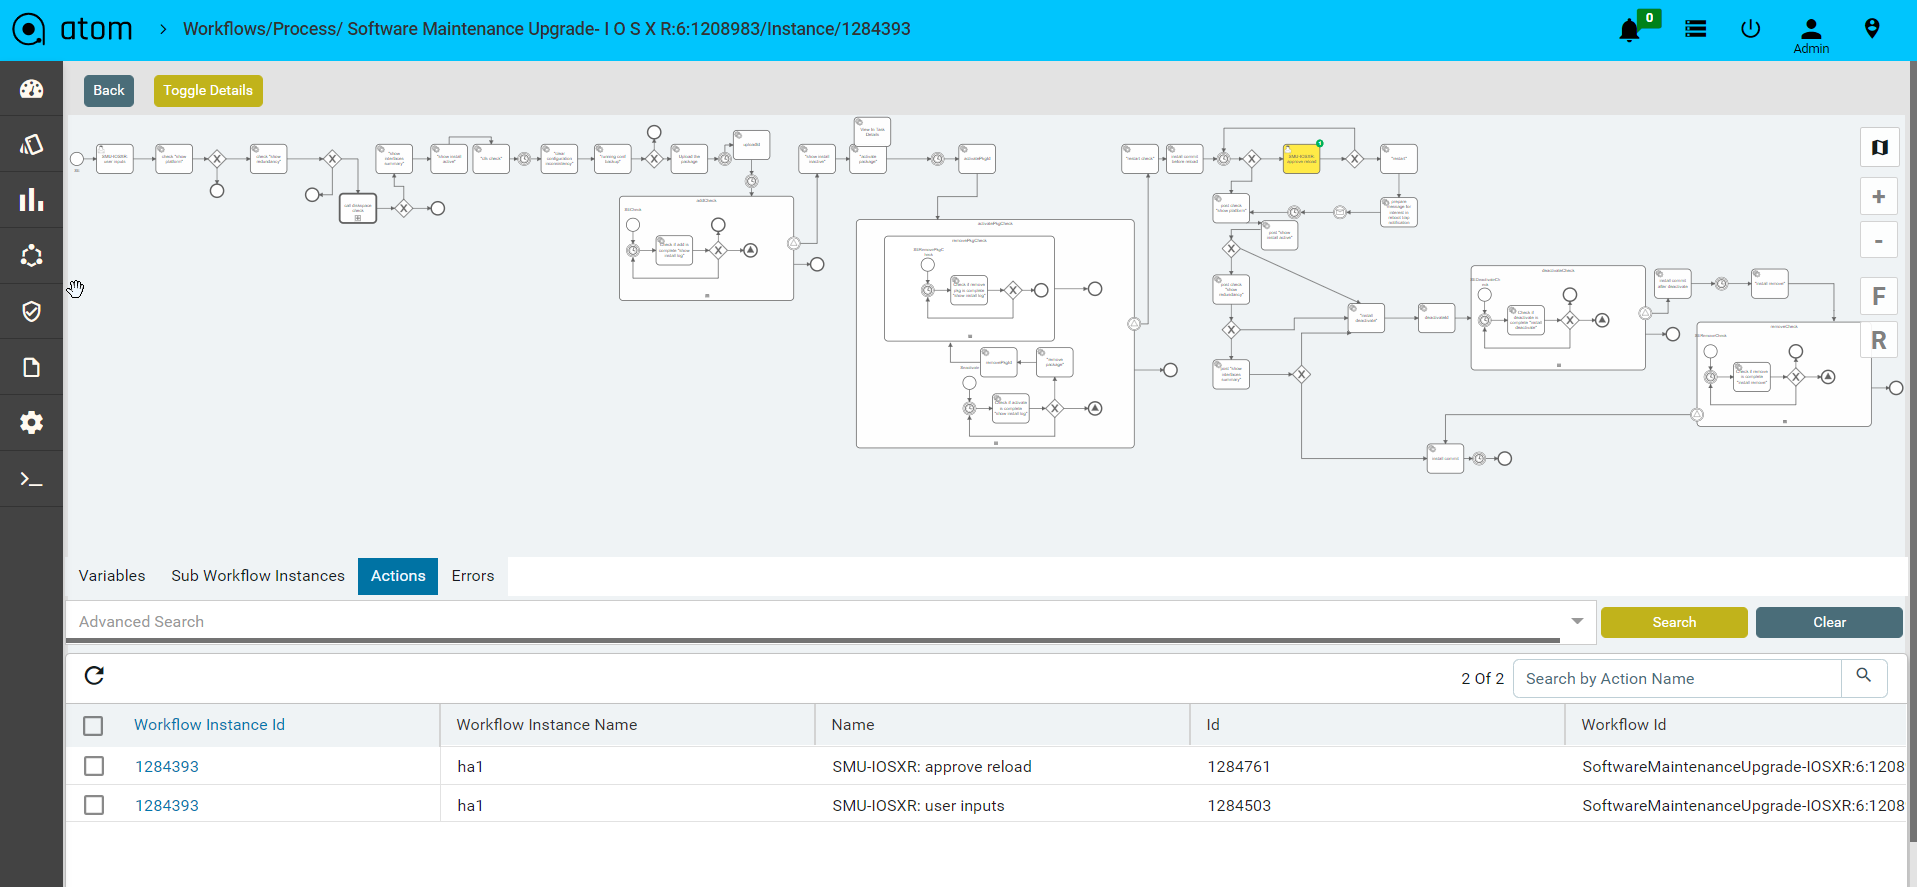
Inspecting Workflows
To view the current running stage of the workflow
- Navigate to Workflows > Instances
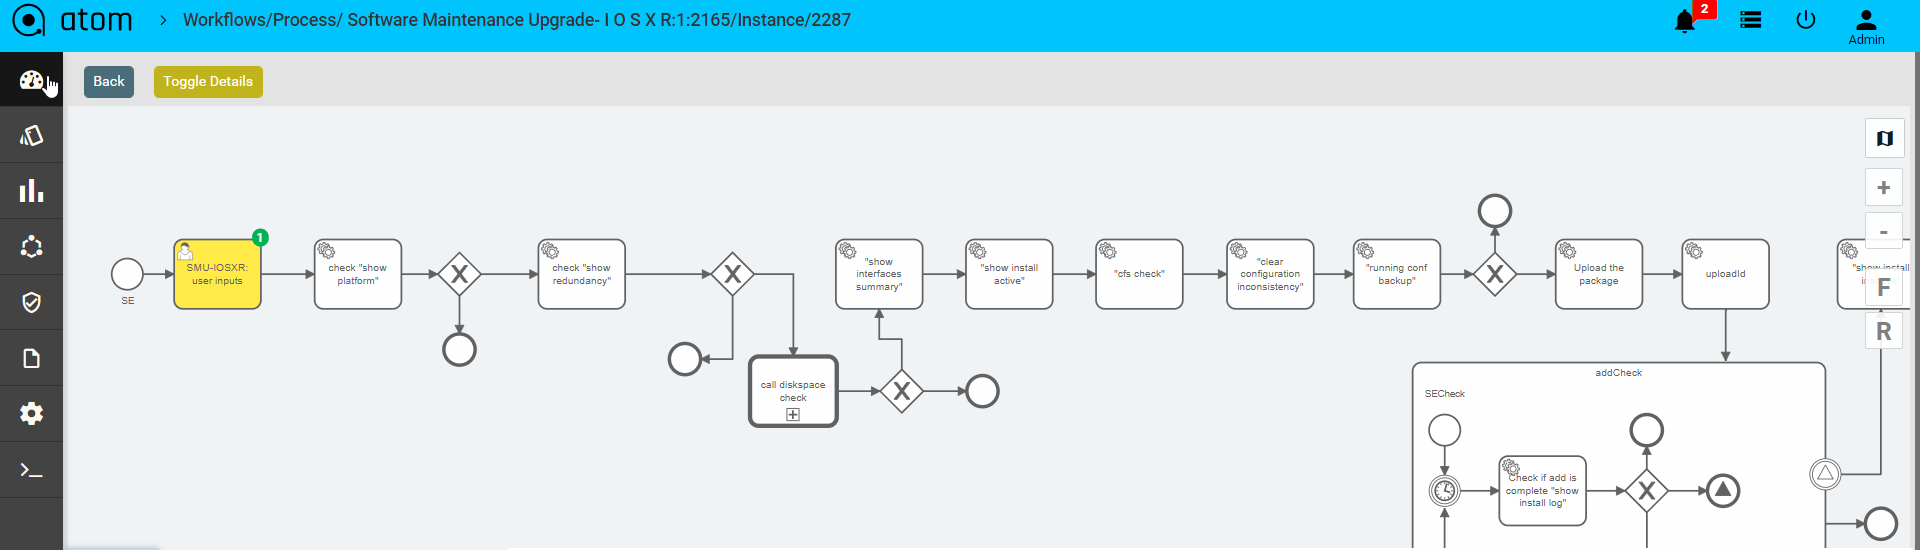
- Click on Inspect
This opens a window with the workflow elements. Green indicates successfully completed tasks. Yellow indicates the current task being executed
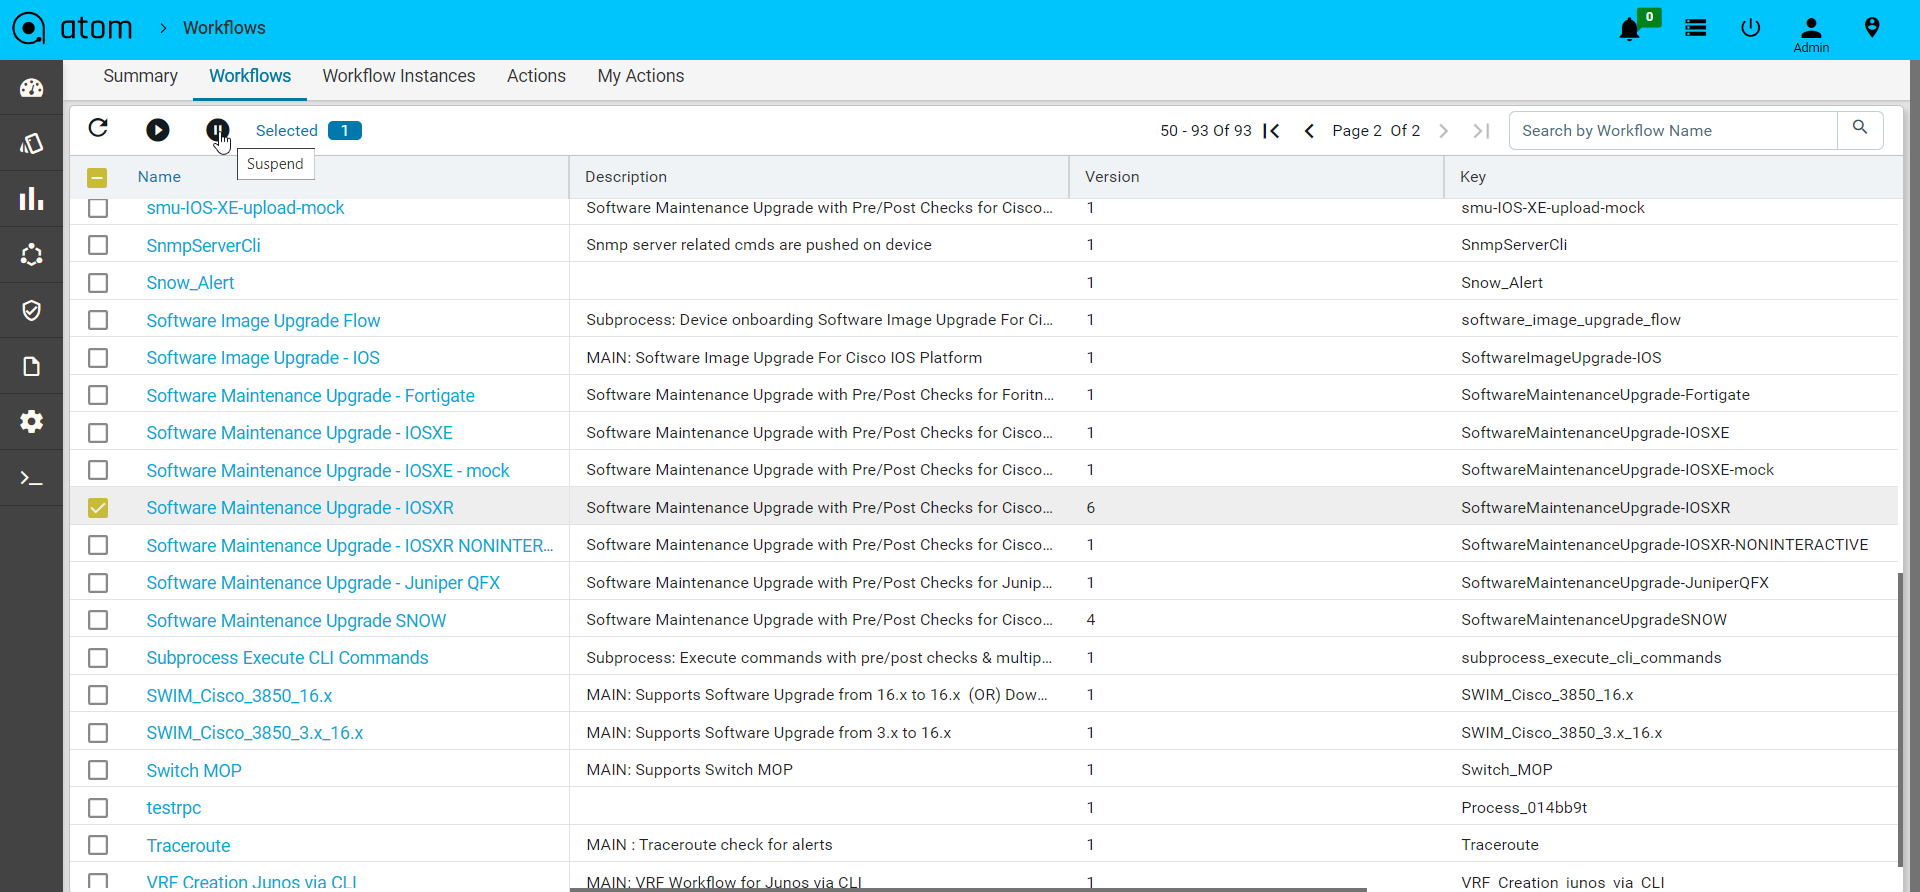
Suspend/Pause Workflows
In the workflow definition view and in the workflow instance view, can suspend the selected workflow definition or workflow instance by using the suspend button on the panel.
Workflow Definition Suspension
If you suspend the workflow definition, you prevent the workflow definition from being instantiated. No further operations can be done while the workflow definition is in the suspended state. You can simply re-activate the workflow definition .
Workflow Instance Suspension
If you suspend the workflow instance, you can prevent the workflow instance from being executed any further. This includes suspending all tasks included in the process instance. You can re-activate the process instance at any later point of time.
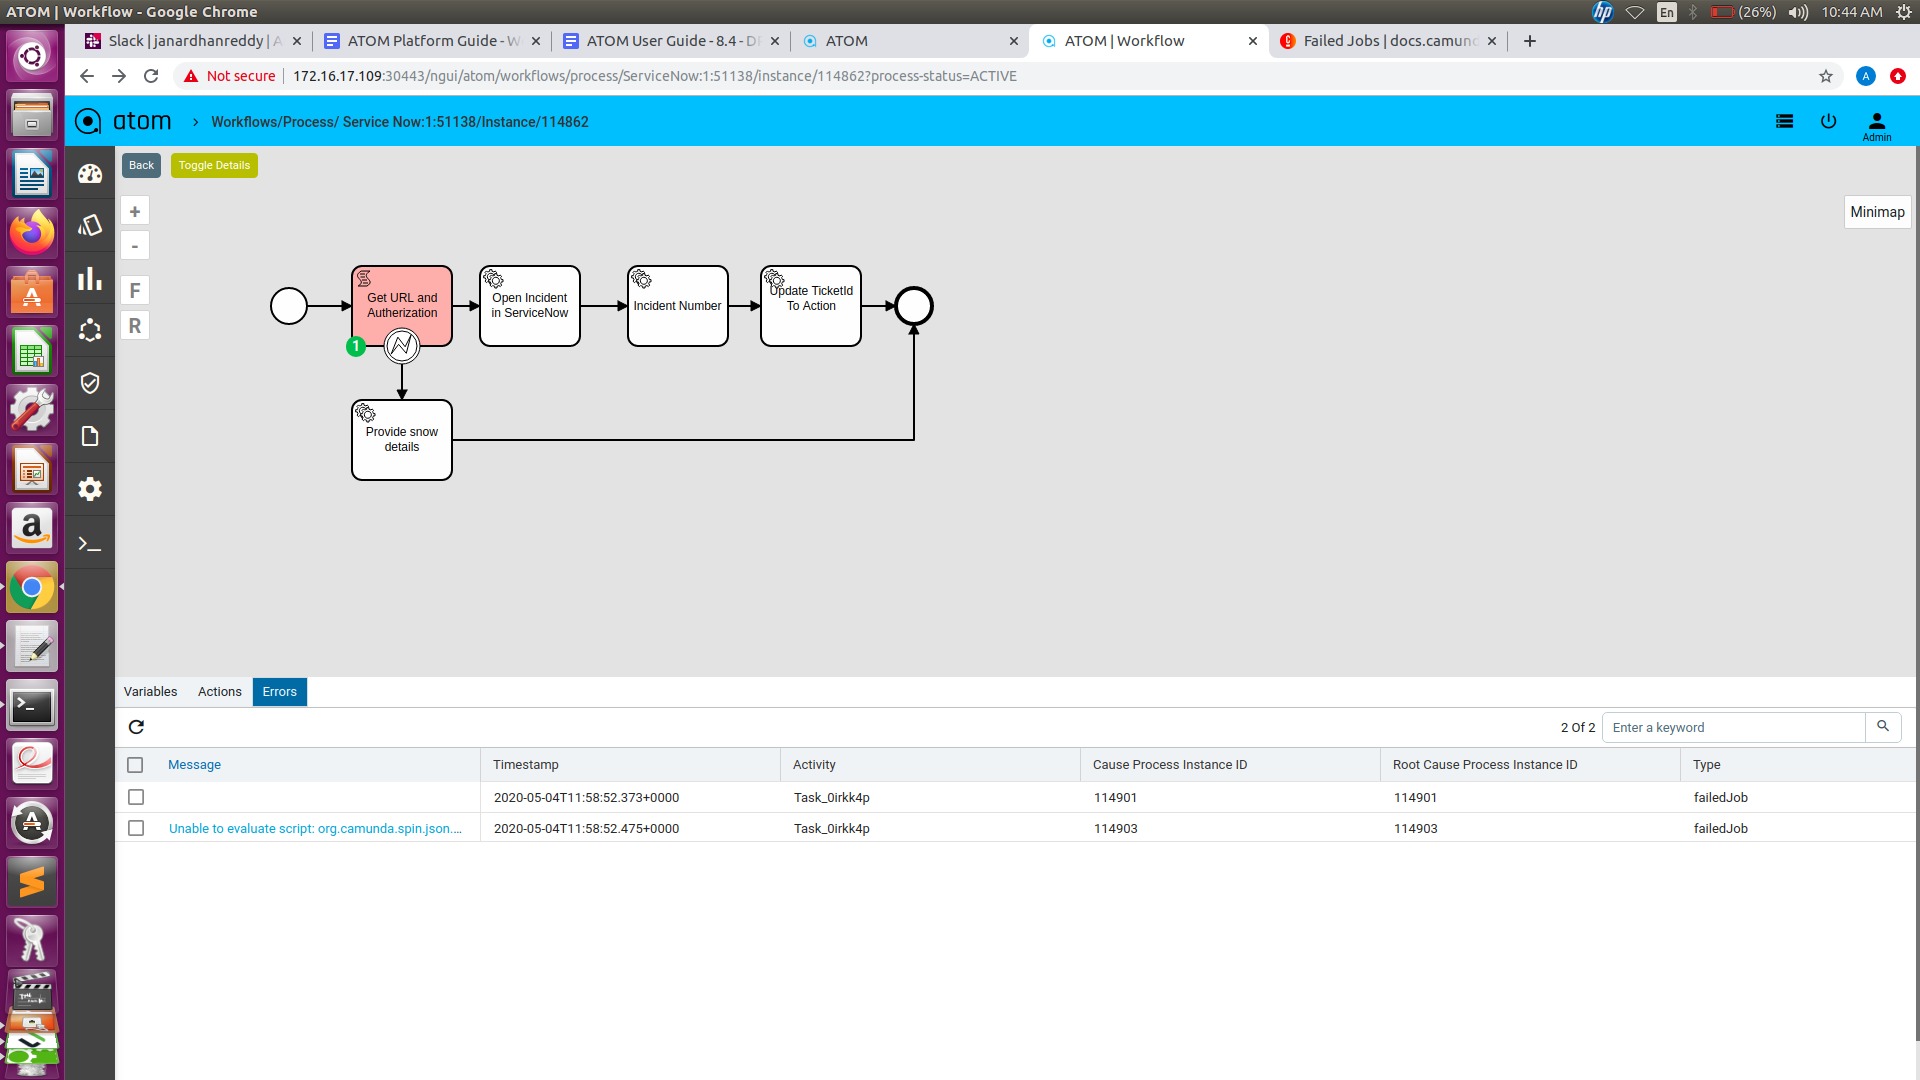
Workflow Instance Error:
Unresolved programmatic/syntactic errors of a process instance or a sub process instance are indicated by Atom workflow engine as errors. The Errors tab in the workflow instance view lists the failed activities with additional information.
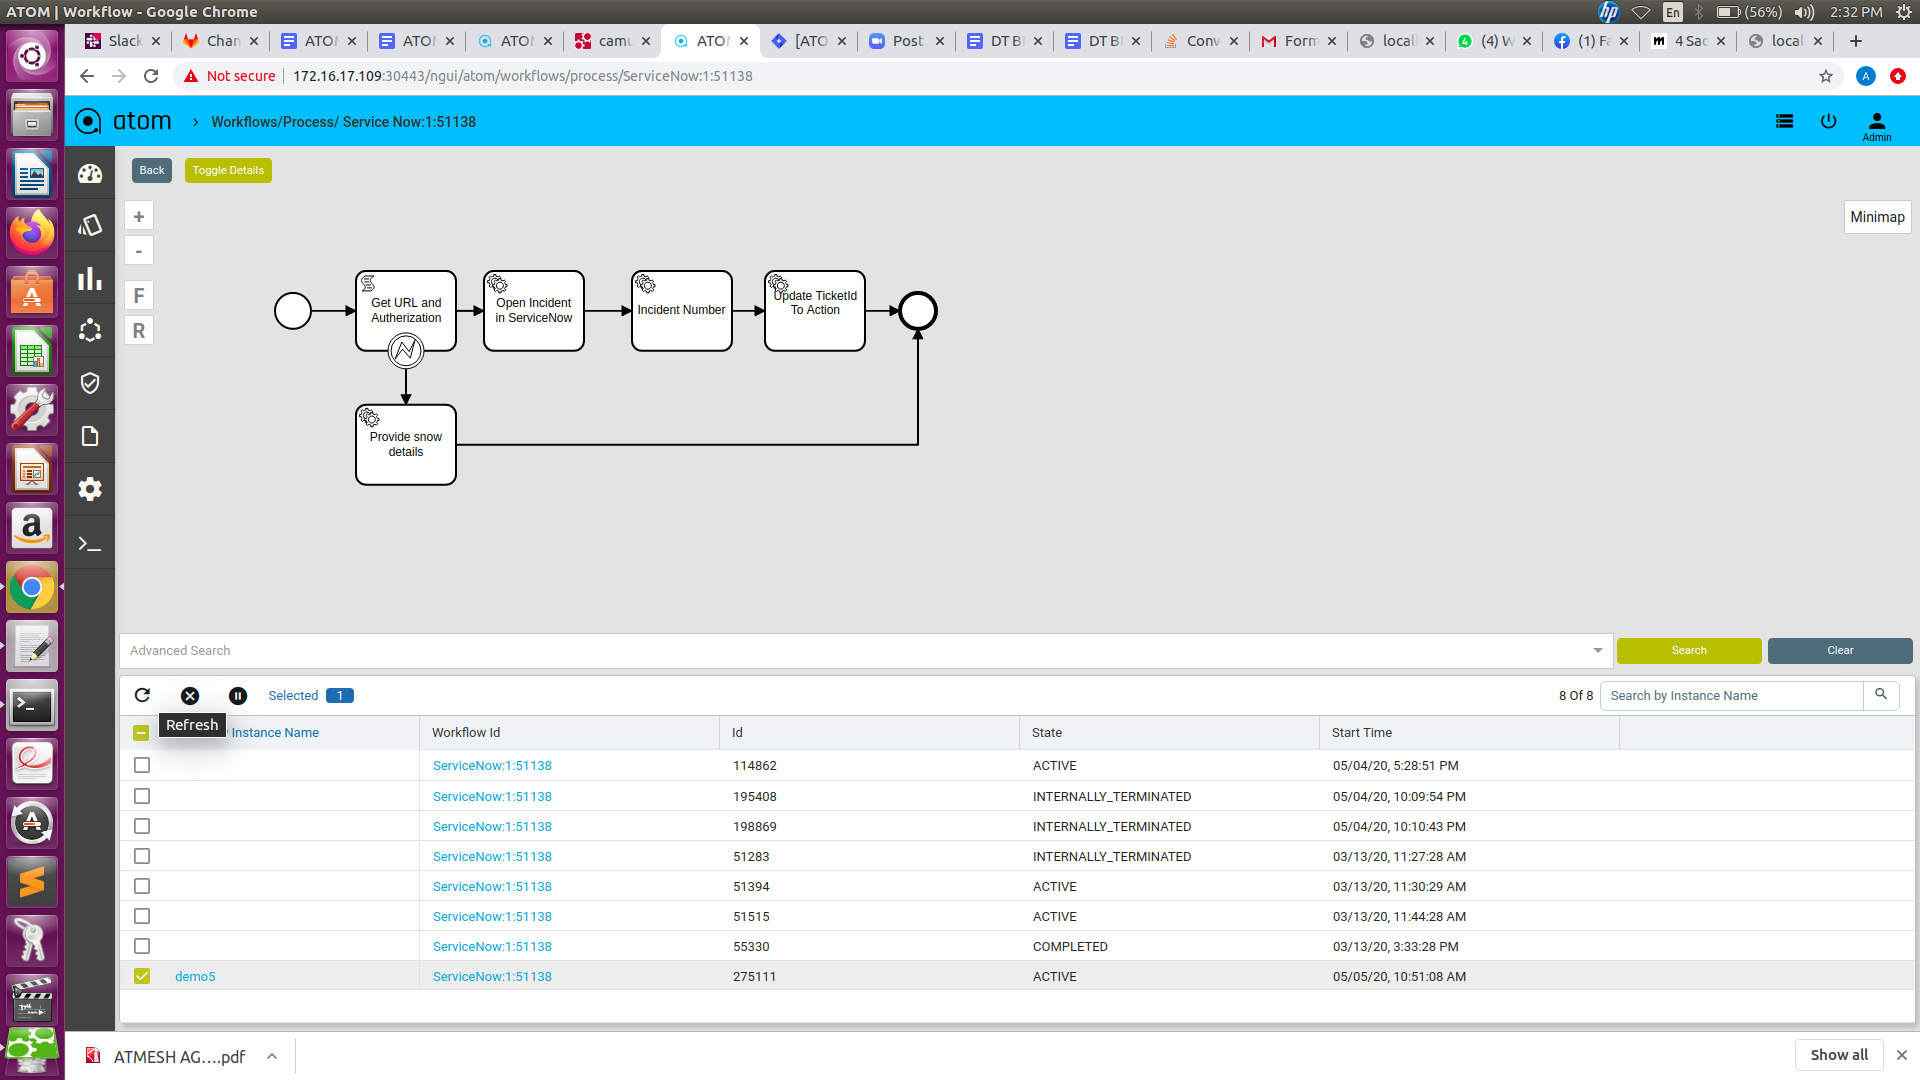
Retry a Failed Job
To resolve an error you can use the Retry button on the top panel. Select the corresponding instance, so the atom-engine will re-trigger this job and increment its retry value in the database.
Workflow Variables
Workflow Instance Variables can be used to add data to workflow runtime state. Various API methods/Service Tasks that change the state of these entities allow updating of the attached variables. In general, a variable consists of a name and a value. The name is used for identification across workflow constructs. For example, if one activity sets a variable named var, a follow-up activity can access it by using this name. The value of a variable is the value held by that particular named variable in the Atom engine for that particular workflow instance context.
To view the workflow variables
- Select the particular workflow instance that is active.

- View the workflow variables in the bottom panel.
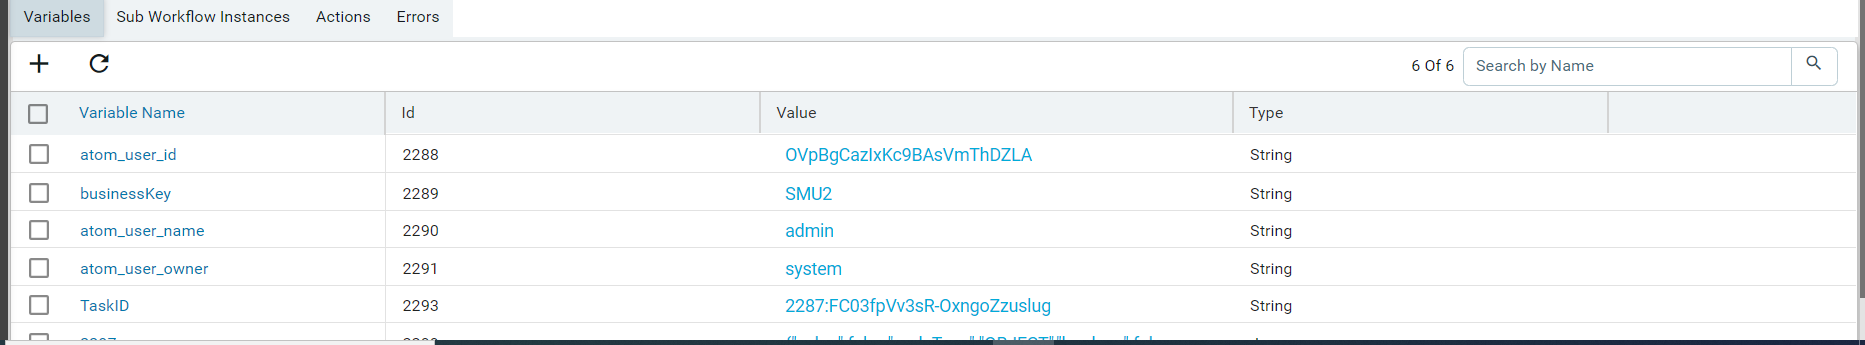
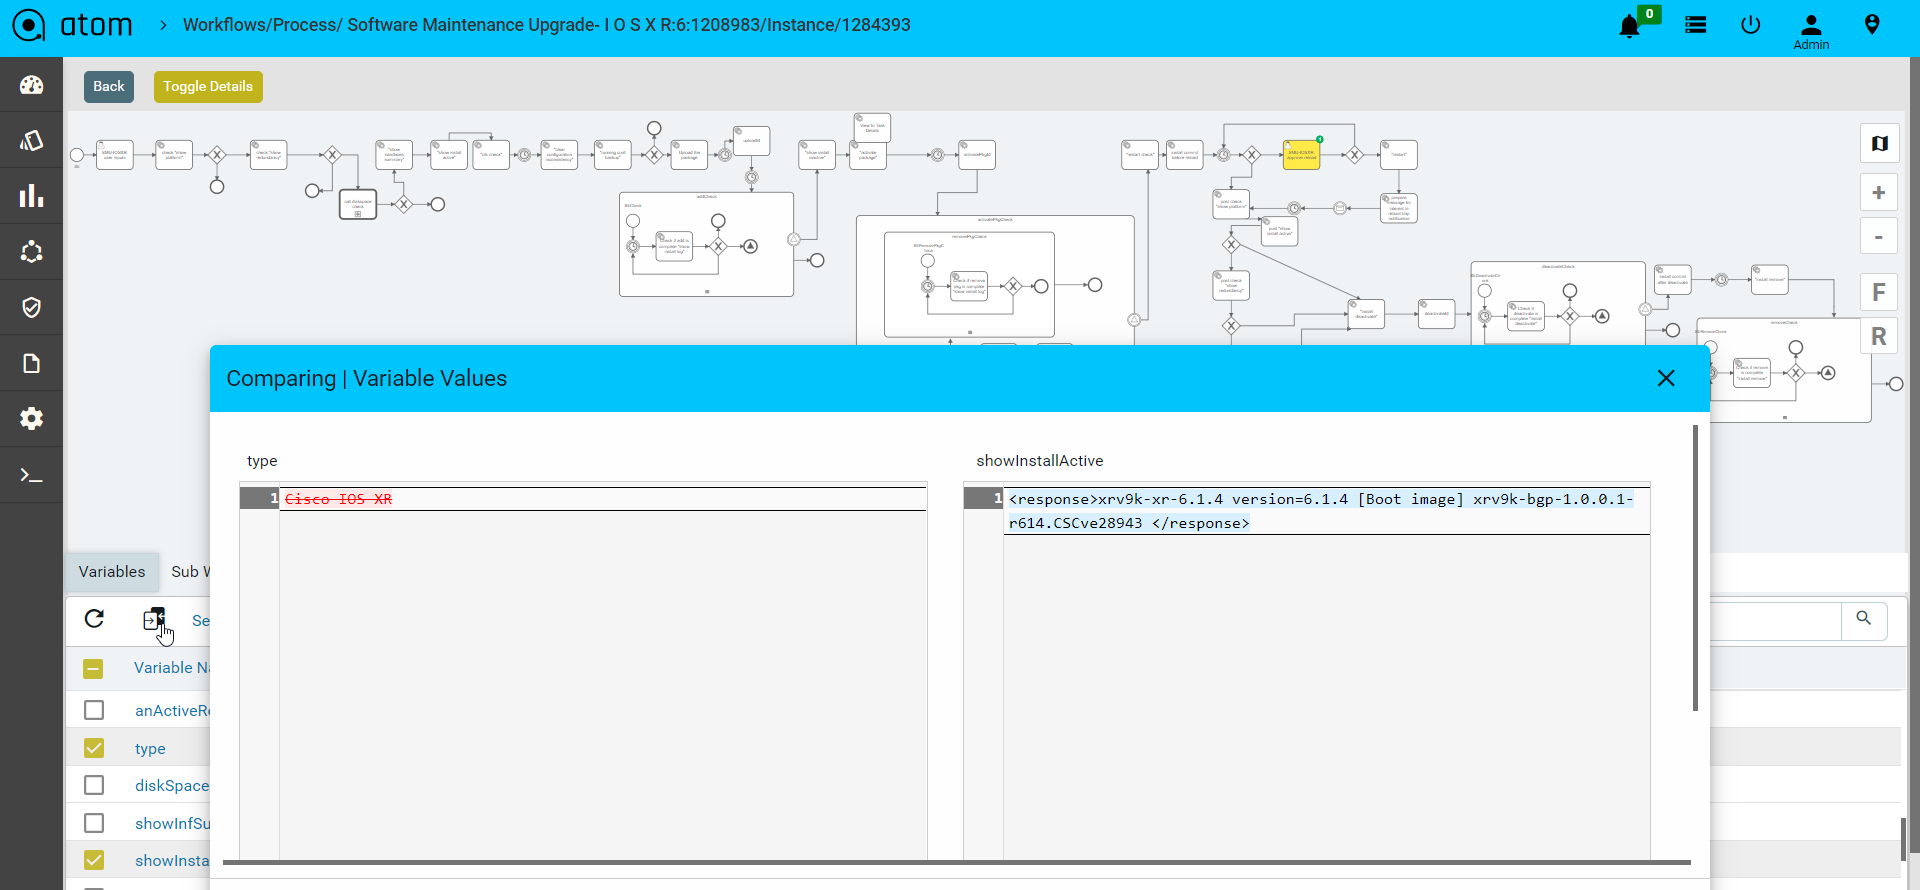
- Users can also edit the variable values during runtime.
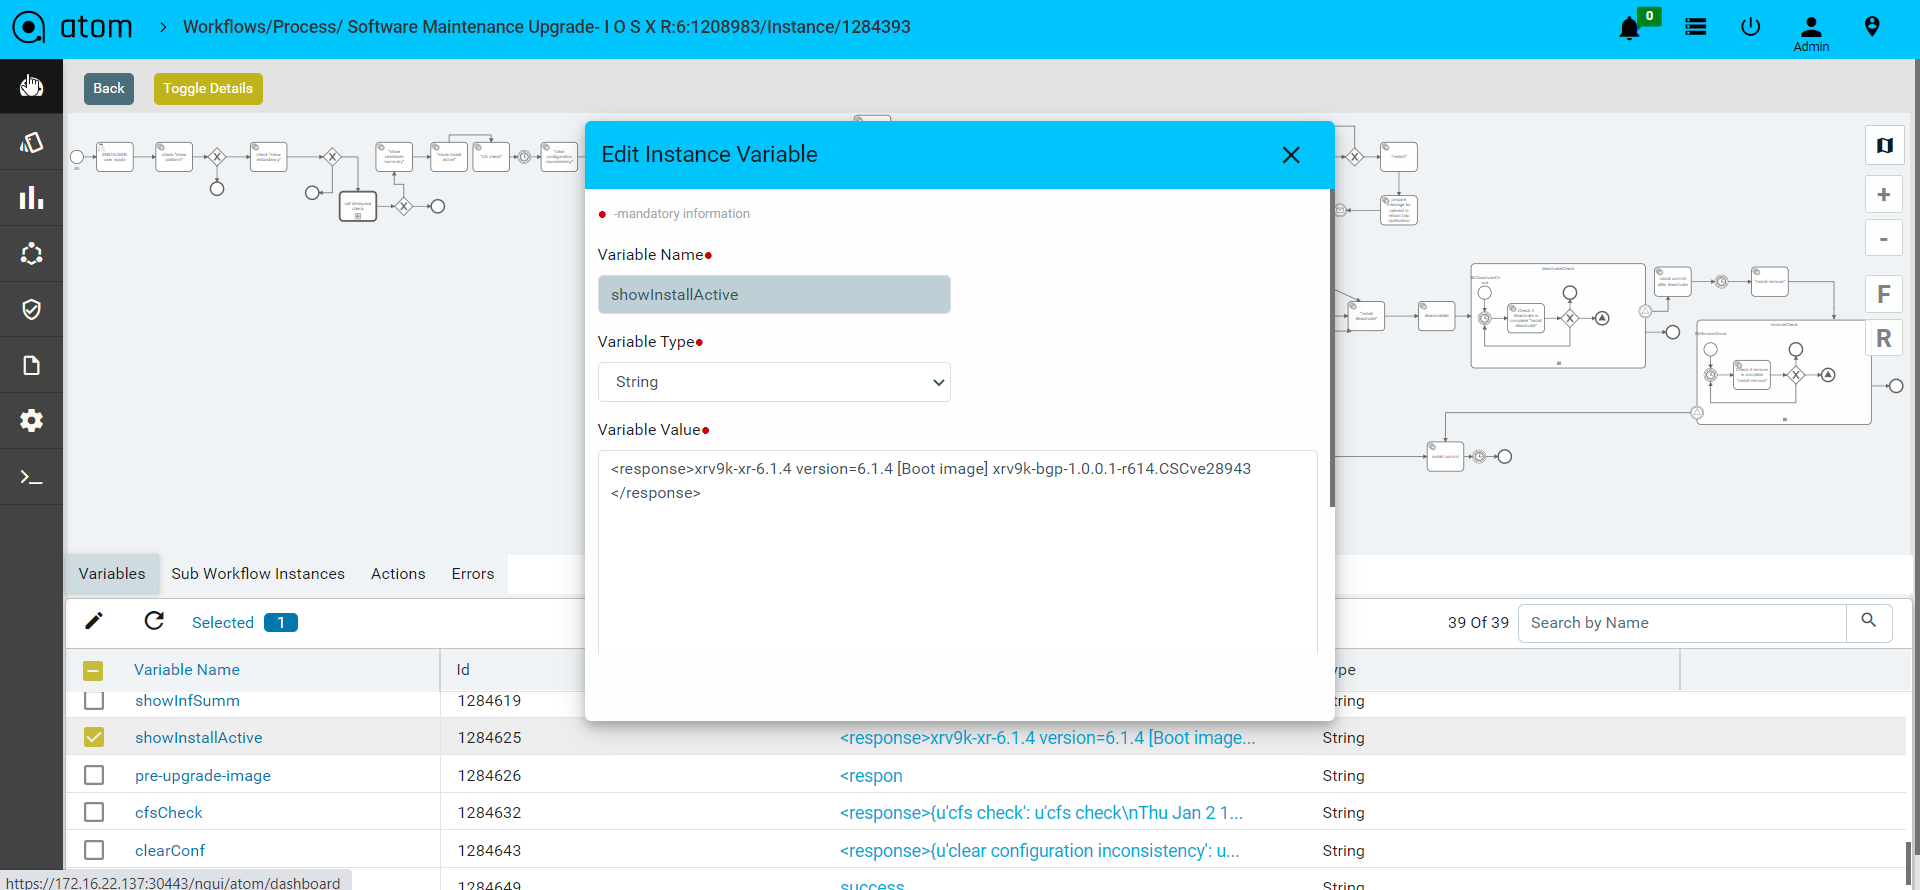
- Alternatively User can compare two variable values and see the difference on the screen.
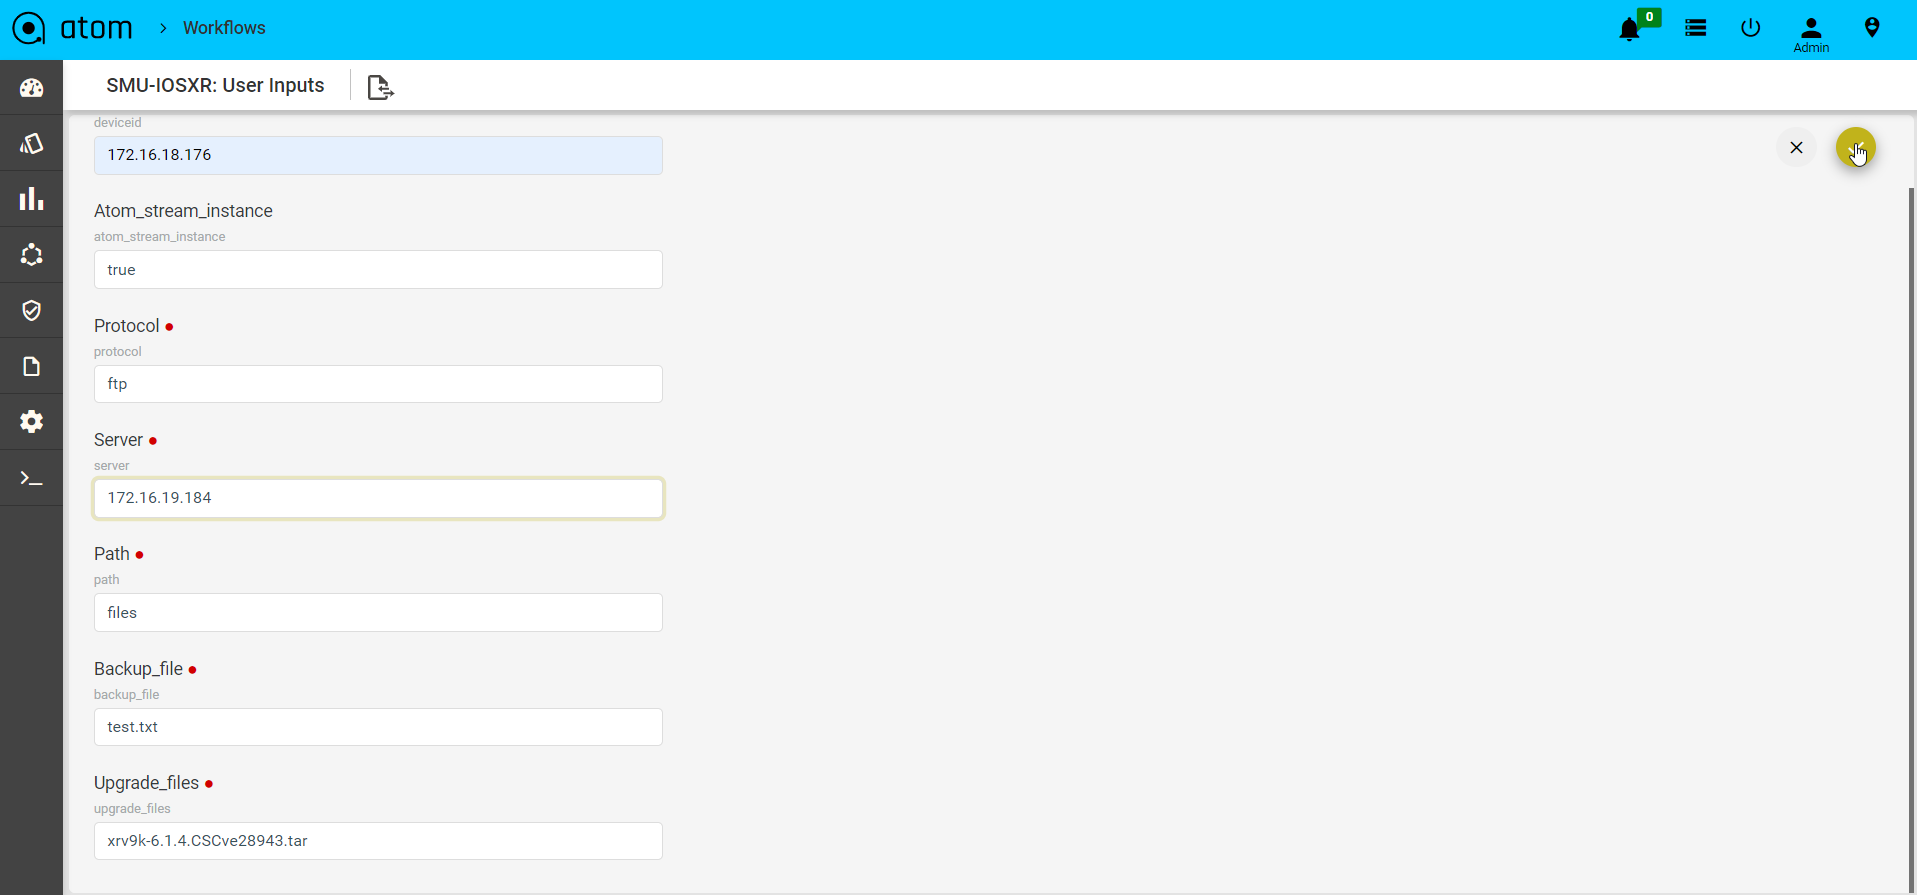
User Inputs
Some workflows may require the administrator to enter some values at particular stages. Workflow execution will be stalled until the values are entered.
To view if any Action items are pending against a particular workflow instance we can view it under the specific workflow instance view :
For viewing such tasks:
- Select the particular workflow instance that is active.
- Once Selected navigate to the action tabs to view all pending action items against this particular workflow instance.
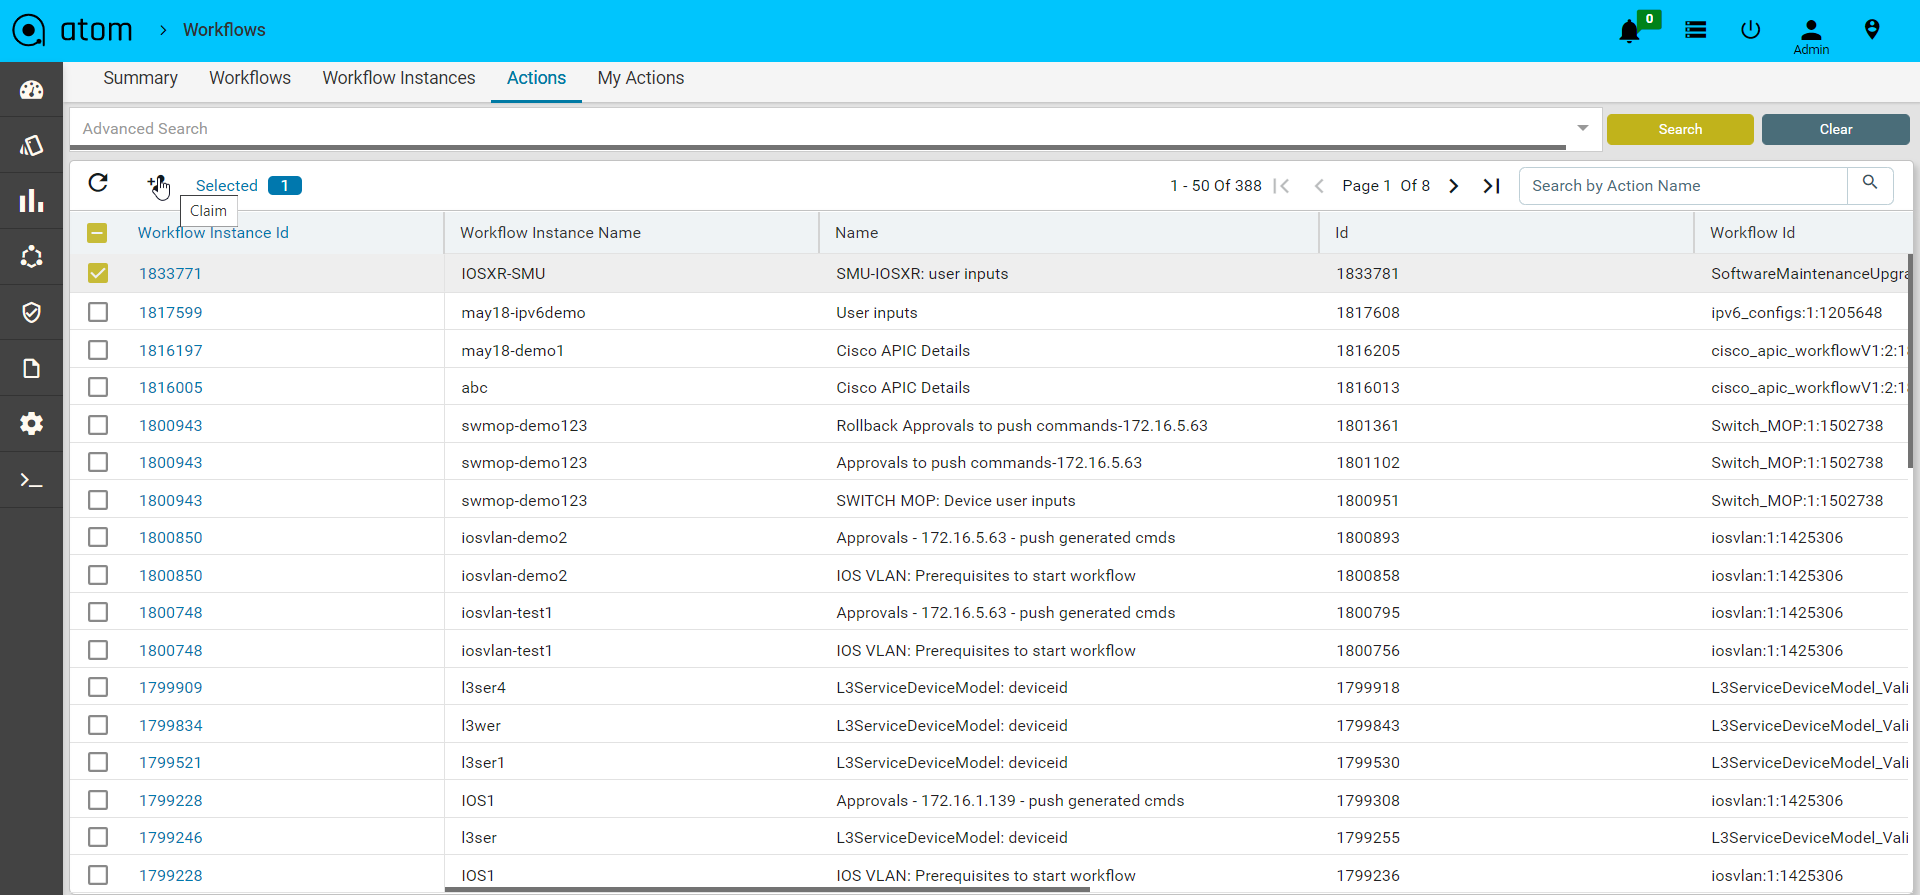
For completing such tasks
- Navigate to Workflows > Actions
- Select the workflow task and click on Claim to claim the task
- Navigate to Workflow > My Actions
- Select the task claimed at step 2 and click on Complete
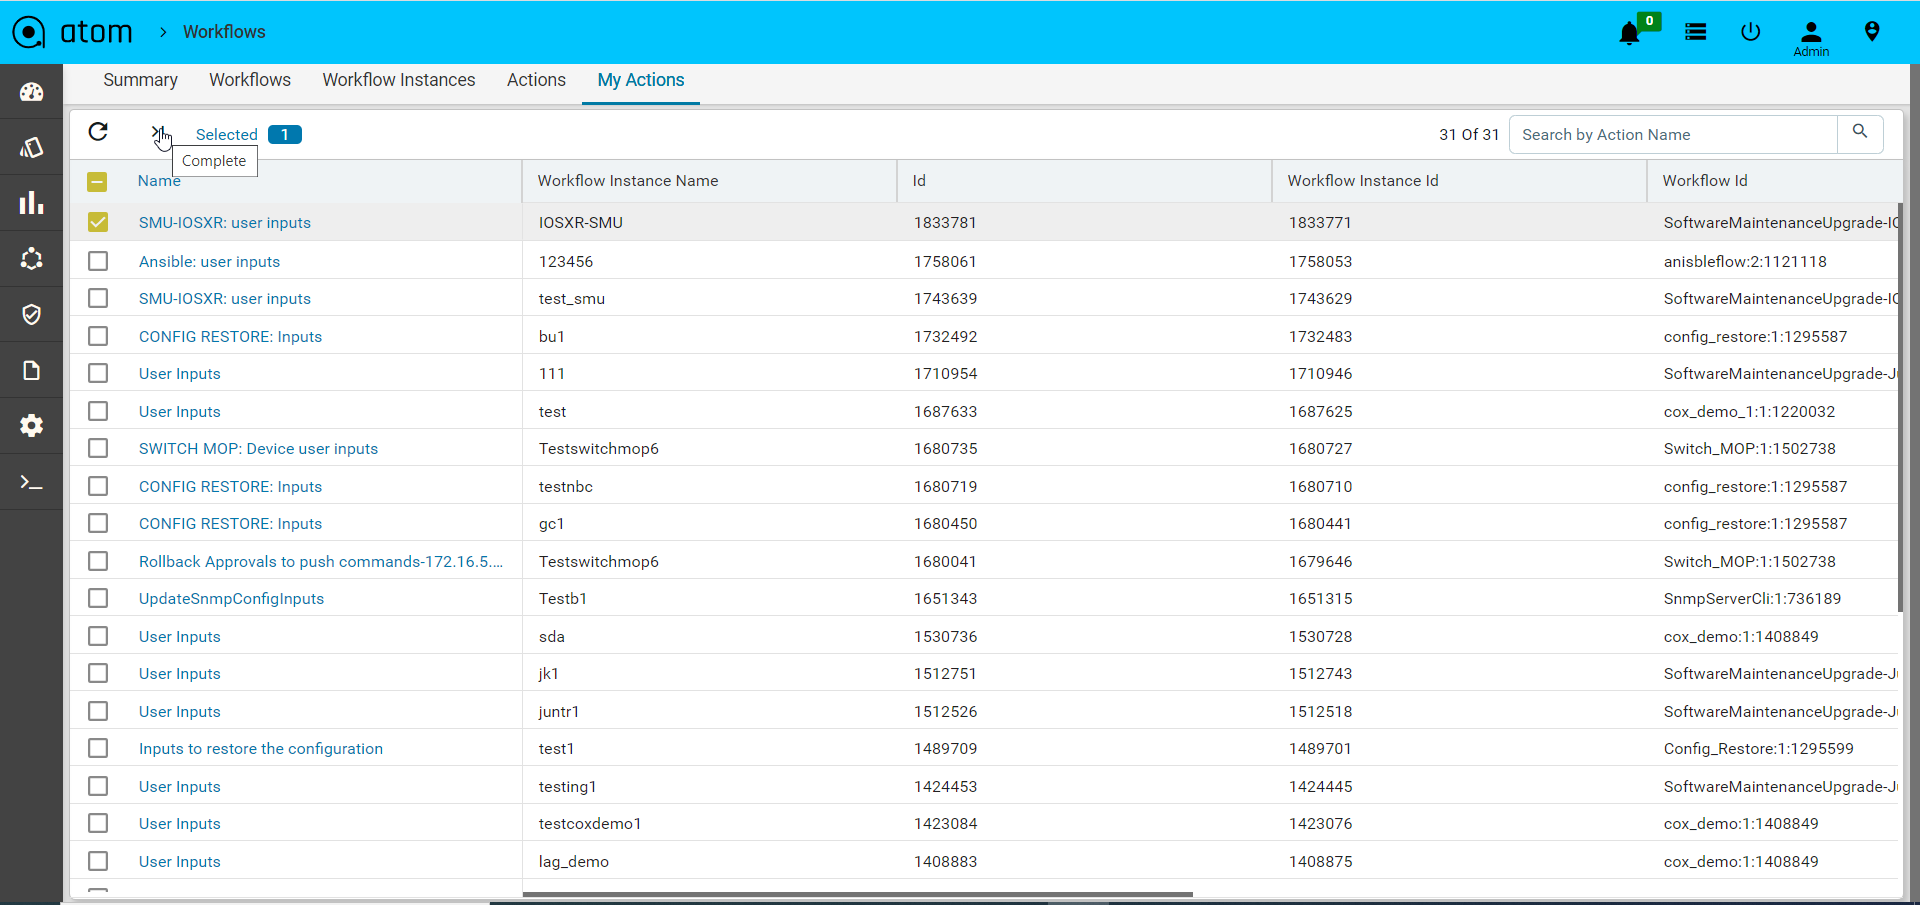
- Enter values and click on the tick mark
Network Service Automation
Stateful services are developed using ATOM SDK and involve Service model developed in YANG and optional business logic in Python. Such services have a continuous life cycle and undergo multiple changes over a period.
Services can be deployed in two modes –
Greenfield Mode – A user can instantiate the service, a set of network configurations, using the service template. These service templates are rendered from schema files that have been developed as a part of the Service package. ATOM automatically generates and applies relevant configurations on to the devices.
Brownfield Mode – ATOM automatically discovers services running on the device and maps it to the service template. For detailed information about service packages and how to write your own service models, and usage of “maps-to” extension, refer to the “ATOM Platform Guide”.
Ordering Greenfield Services in ATOM
To order a service, that was modelled earlier, do the following:
- Navigate to Automation > Services
- In the right pane, click Add
- In the ensuing form, enter values for the fields that are displayed.
- Click OK
ATOM automatically generates relevant network configurations.
Note: If “Dry Run” is enabled in the Administration tab, the generated configurations will not be applied to the devices.
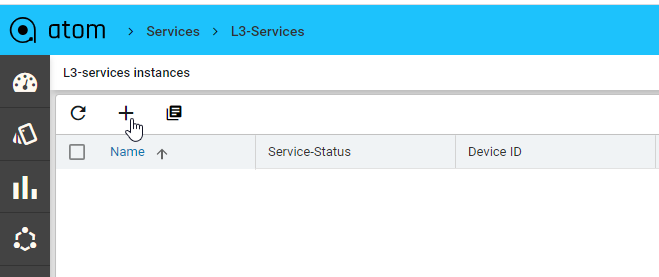
Let us take an example of creating an instance of the “L3 Services” in ATOM. The schematic representation of the service is defined in the .yang file (in this case, l3service.yang file). This file is contained in the model folder of the corresponding service package (l3 service package) uploaded as a plugin to ATOM.
- Navigate to Administration > Plugins & Extensions
- Navigate to Automation > Services > l3-services and click on Add
Deploying BSD services in ATOM
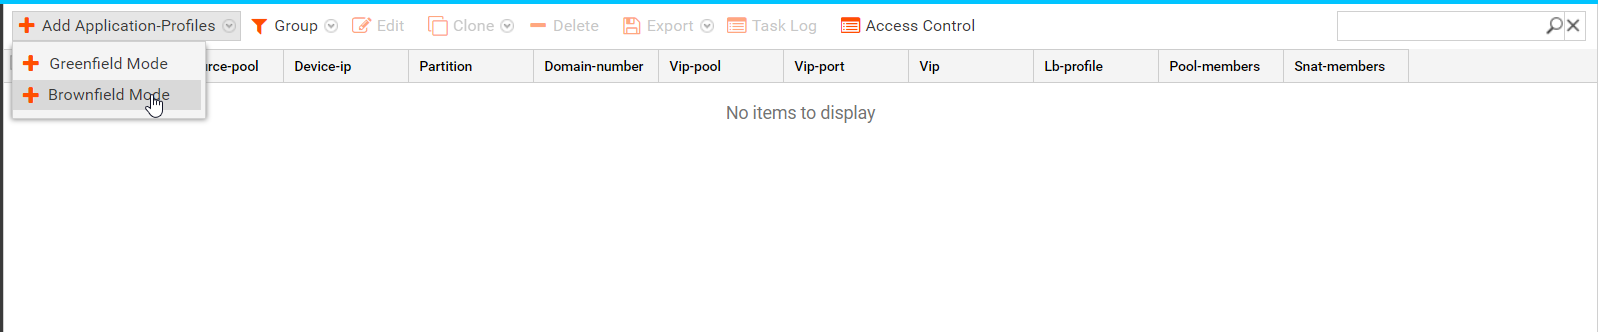
Let us take an example of the deploying the “Application Profiles” service in Brownfield deployment mode:
- Obtain the appropriate service package from Anuta Networks
- Upload the service package into ATOM.
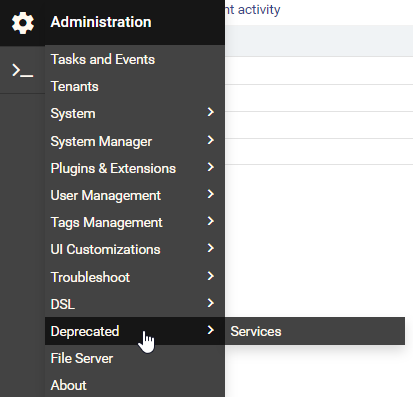
- Navigate to Administration > Deprecated > Services to view the uploaded service package.
- In the Add Application Profiles pane, select the Brownfield Mode as shown below:
- In the Create Application Services form, all the values discovered from the device are populated in the parameters shown below:
Enter values in the fields that have been marked mandatory.
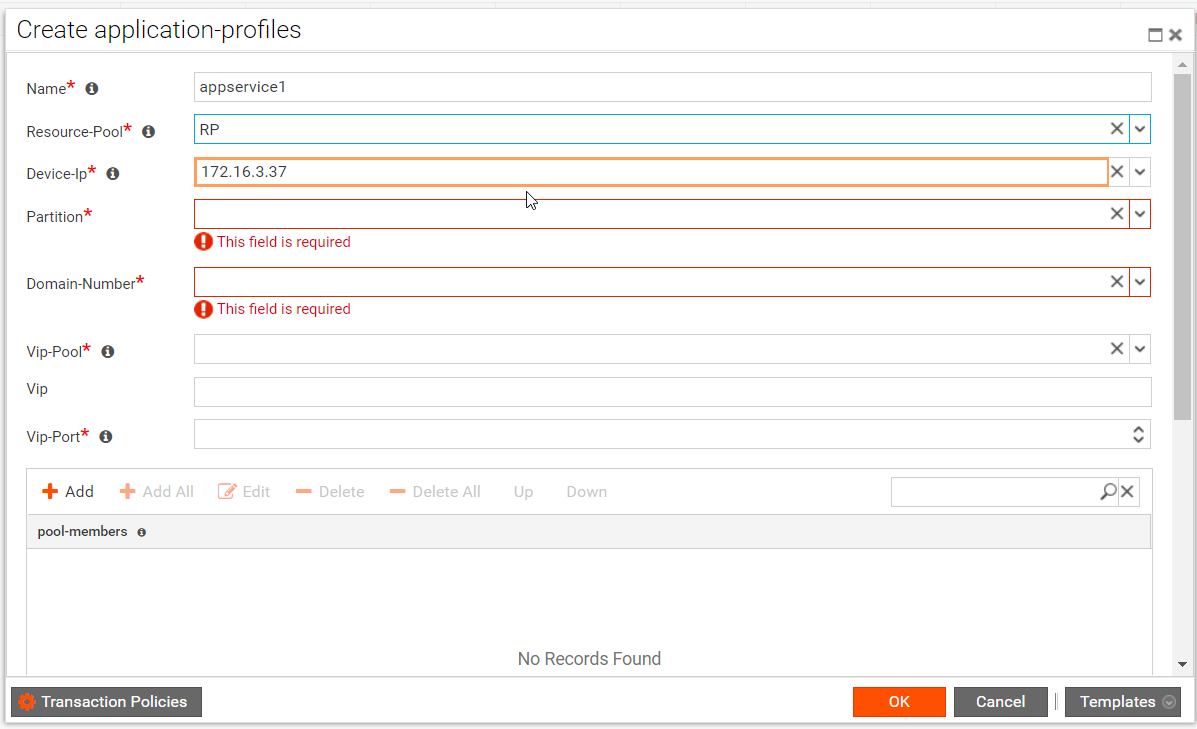
| Note: The borders of the fields that contain the auto discovered values are coloured in brown color. |
- Click OK after selecting the requisite values in each of the fields.
The commands that are generated in ATOM are not pushed to the device because of the mode of Brownfield deployment.
Transactional control at the Service level
For every service, the admin can control whether the corresponding configurations, generated by ATOM, should be pushed to the device. This gives an admin a granular level of control wherein some services can be sent to the device and a few can be retained on ATOM.
- Navigate to Automation > Services
- Click the service that you want to configure the transaction policies.
- You can either enter the values of the fields or import the values from a template to fill the form.
- In the Create service template,click Transaction Policies > Transaction Policy Configs screen to set the control at the transaction level as shown:
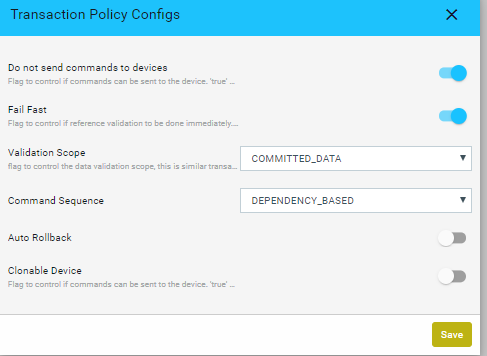
| Option | Type | Description |
| do-not- send-commands- to -devices | boolean | Controls whether commands can be sent to the device. devices Select this option to commit the data to ATOM datastore, but no configuration changes will be applied on the device. Useful for testing or in the case of a brown‐field environment to create services. Note: The value set for this option at the transaction policy overrides the value at the global level (in the General Settings) |
| fail-fast | boolean | Controls whether the reference validation should be done immediately. False: Defers the validation to after ‘commit-task’ state of the transaction |
validation‐scope‐type
| enum | Controls whether data validation scope is across transactions. This flag is similar to isolation control in traditional RDBMS, but limited to just data validation. Allowed values are “COMMITTED_DATA” and “UNCOMMITTED_DATA”. Validation will be done only using the committed data. Current transaction will not see changes done by other parallel transactions Data validation will be done using the uncommitted data. Current transaction will see changes done by other parallel transactions |
| enum | Controls whether the generated commands need to be ordered according to the dependencies specified in the model. Generated commands will be re-ordered based on the dependencies specified in the data model. Generated commands reflect the order of the requests sent from the client, no re-ordering is done |
The values for following options can be cross-verified before creation of each service
- Fail Fast
- Validation Scope
- Command Sequence Policy
- Click the task created for the created service to view the commands generated by ATOM in the Task Details.
In the Task details, click Commands to view the generated commands by ATOM. As the commands should not be sent to the device, (if do-not-send-commands-to-device option is selected), the status of the commands is set to “TO_BE_PROVISIONED” as shown below:
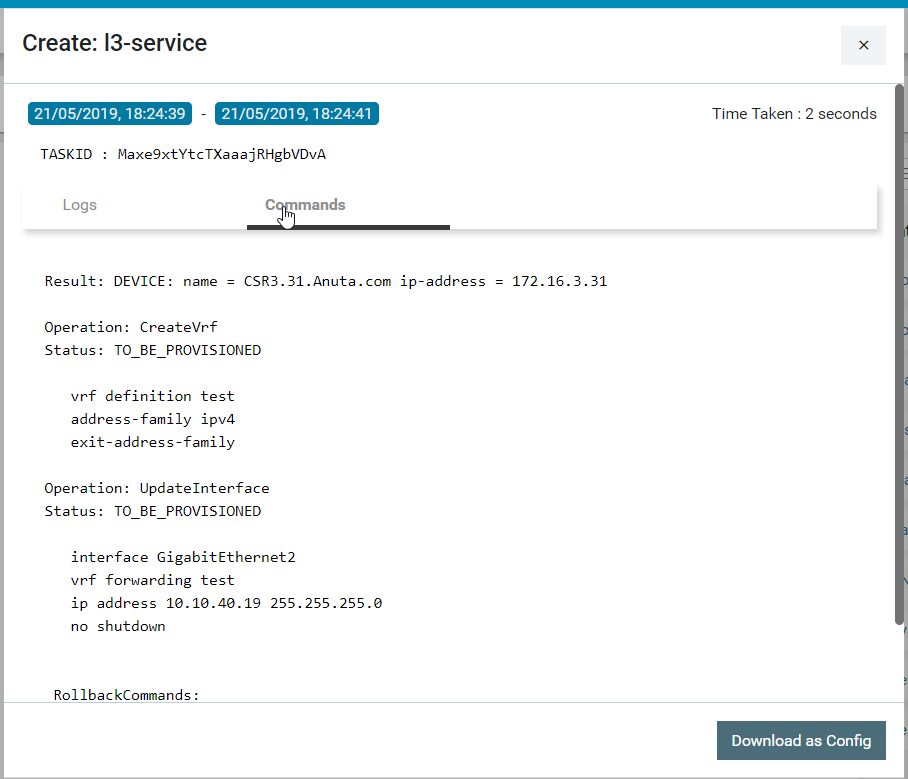
The generated commands can be downloaded and verified with the expected configurations for that service.
Cancelling an ordered Service
- Select the service and click Delete.
- In the Confirmation window, before selecting the Yes button, click the Transaction Policies.
- Select the option , “Do‐not‐send‐commands‐to‐devices” in the policy
In the corresponding task generated, in the Task Details pane, click Commands to view the generated commands by ATOM. As the commands should not be sent to the device (if “do not send commands to the device” option selected in the transaction policy config), the status of the command is set to “TO_BE_PROVISIONED”.
| IMPORTANT: If this option is not selected properly as per create behavior, the service deletion might fail. |
Service Approvals
You can create policies for approving creation, deletion or updation of the service configurations on devices. In addition, you can add approvers who must approve the operations defined in the service approval policy. Apart from seeking approvals for services, you can set approvers for any of the operations for any entity in ATOM.
- Navigate to Automation ->Services-> Approvals
- In the right pane, click Add Policy to create the details as shown below:
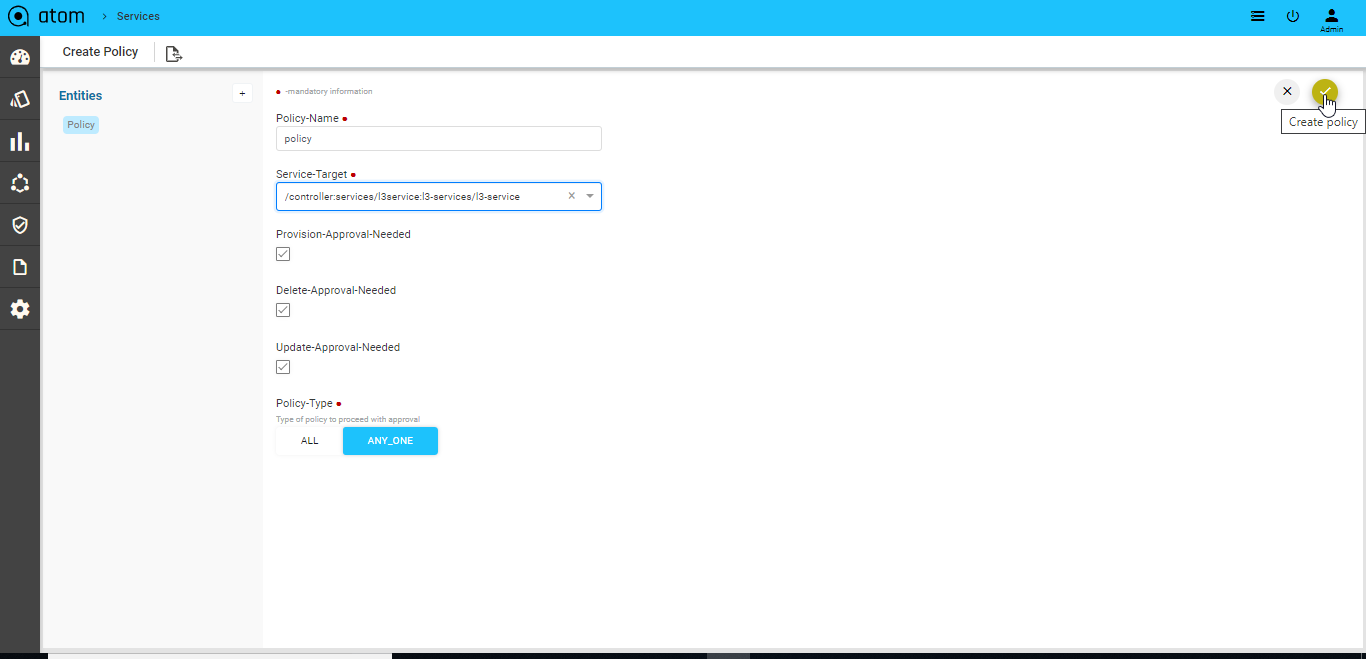
- Navigate to the right pane to add details as described below:
- Policy Name: Enter a name for the approval policy
- Service Target: Enter the path for the object in the data model tree for which approval is required.
For example: If the object of interest is a service, enter the path of the service.
/controller:services/l3service:l3-services, which means that the operation of interest on this managed-cpe -service will be sent to the approver or approvers for their perusal before being pushed to the device.
- Provision Approval Needed: Check this option if the user selected as the approver should approve the configurations before they are pushed to the respective device or devices.
- Delete Approval Needed: Check this option if the approver should approve the configurations that are required for deletion of the service configurations from the device or devices.
- Update Approval Needed: Check this option if the admin should approve the configurations that are required to update the service configurations on the device or devices.
- Policy Type: This option enables you to set if approvals are required from a single approver or multiple approvers.
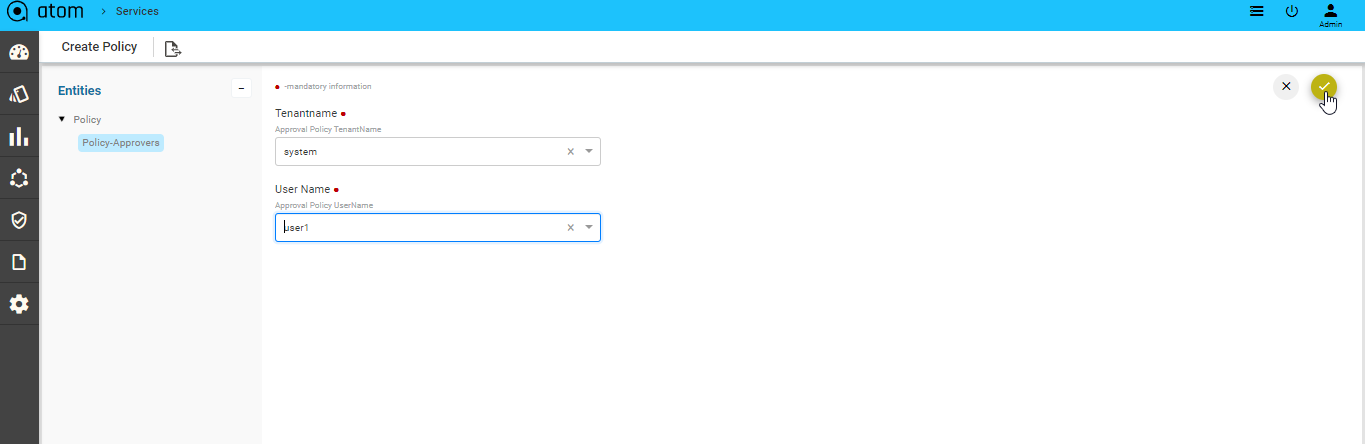
- ALL: The task that is generated as a result of a service operation awaits the approval of all the approvers who have been added for that service .
In the following example, the operation of creating a ‘customer’ needs approval of two approvers, ‘admin’ and ‘User1’. The task is completed successfully after receiving the approval of all the approvers as shown below:
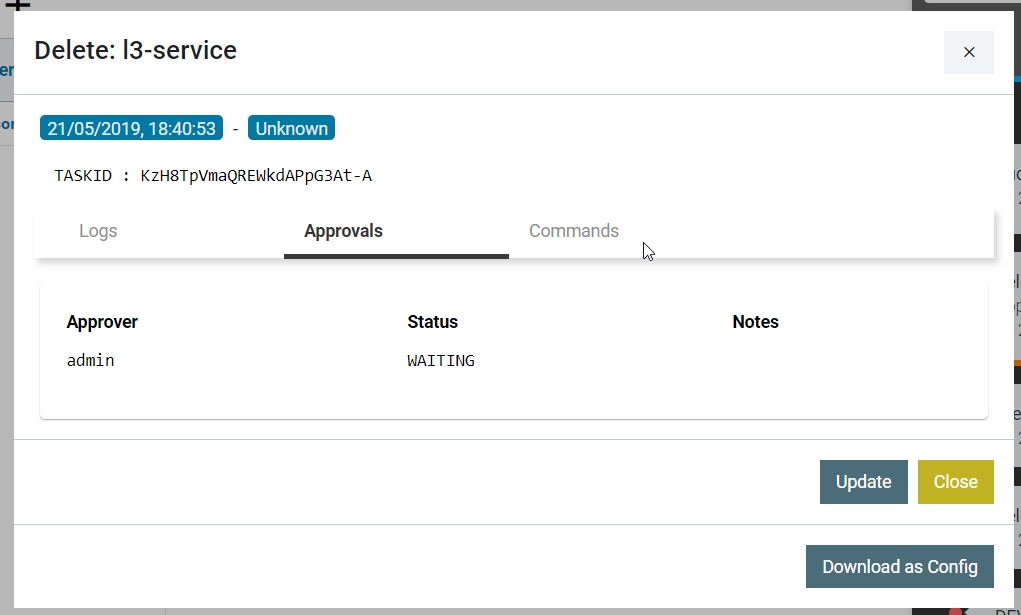
- ANY_ONE: The task generated as a result of a service operation awaits the approval of any of the multiple approvers added for that service.
| NOTE: All changes made in the service approval policy will come into effect only for the subsequent service instantiations and will not affect the ongoing service operations. |
- Navigate to the left pane to add the tenant users who should approve the configurations generated by ATOM for any of the service operations (create, delete or update ).
| NOTE: Do not edit the name of the user (UserName) who has been added as an approver in the service policy. |
Agents
ATOM Agent handles all Device communication all communicates with Other ATOM Components either remotely or locally based on deployment mode.
Each ATOM Agent manages multiple network devices. ATOM agents can be assigned with multiple CIDR blocks to manage the devices. It is used to communicate, collect and monitor the networking devices in your infrastructure using standard protocols. Once the agent collects the data, it gets encrypted and sent to Anuta ATOM Server over an outgoing SSL Connection.
One Agent can typically manage hundreds of devices. However, it depends on many other factors such as device type, data collection, size of the data, frequency etc. Checkout ATOM Agent Hardware requirements for further information.
ATOM Agent Deployment is discussed in detail in “ATOM Agent Deployment Guide”.
Administration
As an administrator, you can manage changes in the ATOM that will affect the behavior of the system and have a global effect on all the components of ATOM.
- “Tasks” and “Events”
- “Tenants”
- “System“
- “System Manager”
- “Plugins and Extensions”
- “User Management“
- “Tag management”
- “UI Customizations”
- “Troubleshoot”
- “DSL”
- “Deprecated”
- “File Server”
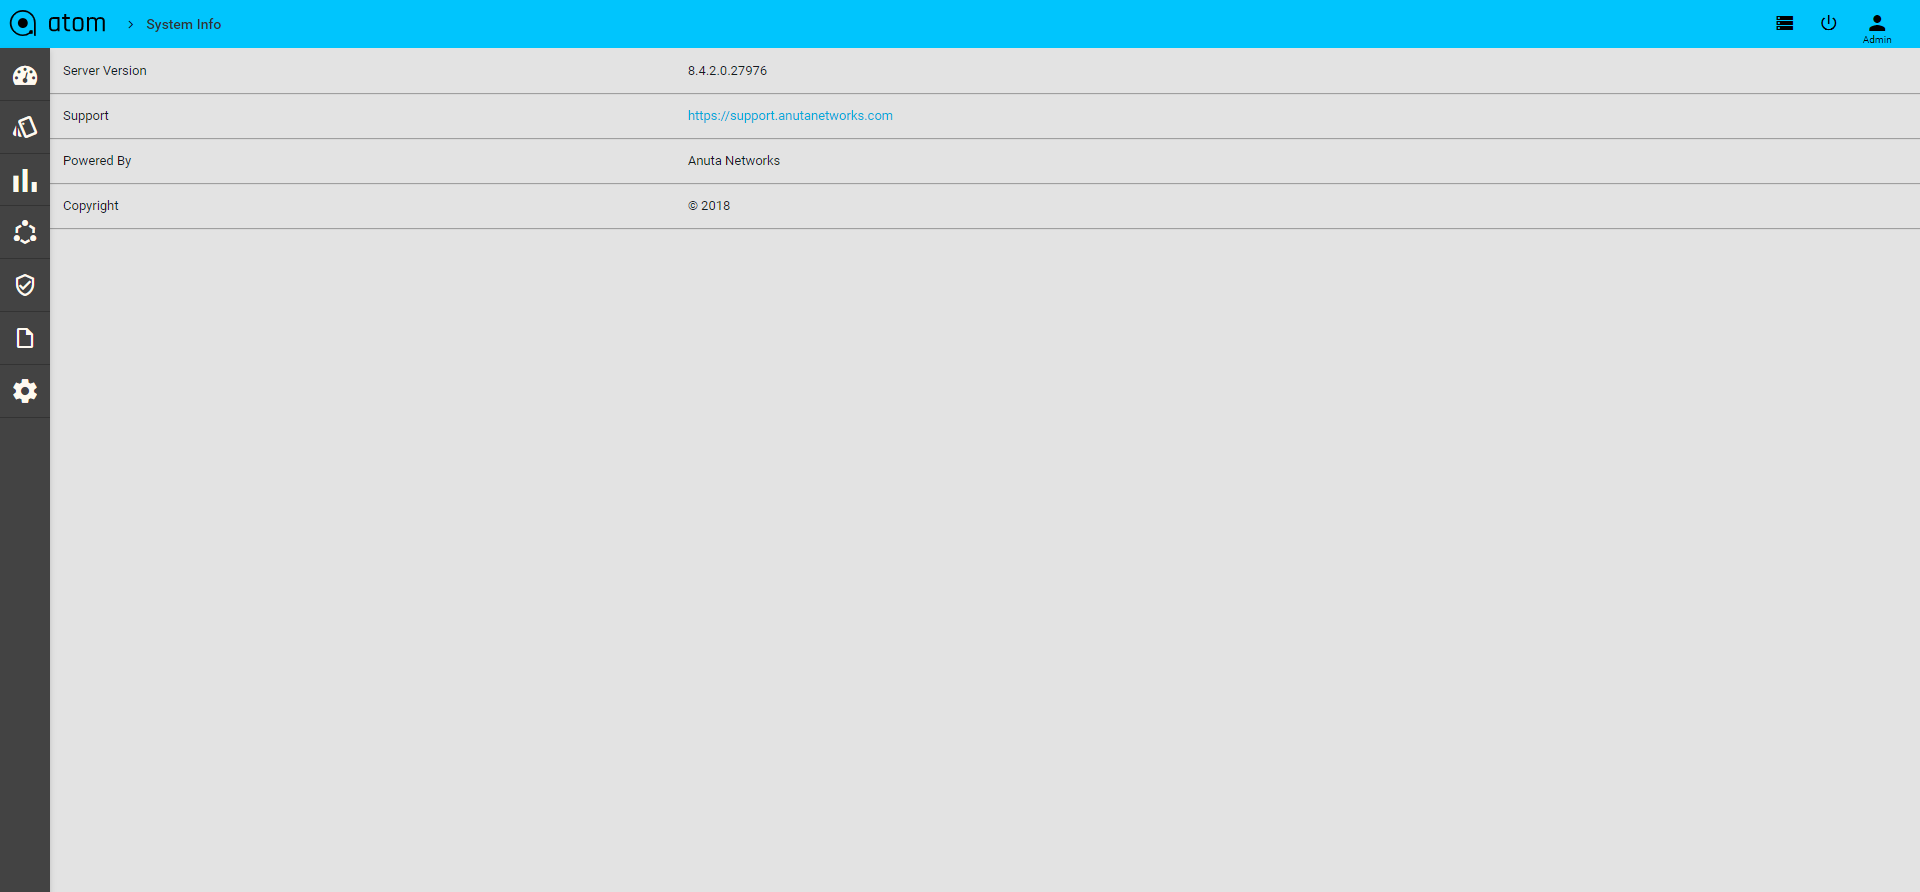
- “About”
Tasks & Events
You can view any activity, “task”that is being executed in ATOM as a result of an user‐ initiated action. Tasks are generated during the following operations such as:
- Adding or Deleting Devices
- Executing Jobs
- Validating the resource pool and running the Inventory
- Configuration out ‐of ‐sync between the device and ATOM
- Creating or Deleting Networks
- Select any Task and click Details to view the configurations associated with that task.
- You can search for any Task by entering a query in the Search field.
- Select any task and click Cancel to view the task is to be cancelled
- Select any task and click Download Log to view the system related logs and message.
For example, enter “Create” in the Search field, if you want to query for all the Create operations that have been executed so far. All the Create tasks that have been triggered in various operations are displayed as shown below:
- Click Retry when the creation of a Service (during instantiation of the Service) fails due to deficit in the operational resources or during provisioning. 4. Click Task log to view the system related logs and messages
Events
Events represent an important part of an operation or a change in the state of an object in ATOM. For example, an event is generated when a user logins to ATOM. In addition, login attempts to a device using any of the transport types is also displayed.
Select a task and click Details to view the schema of the service, click Commands to view the configurations associated with the service generated by ATOM.
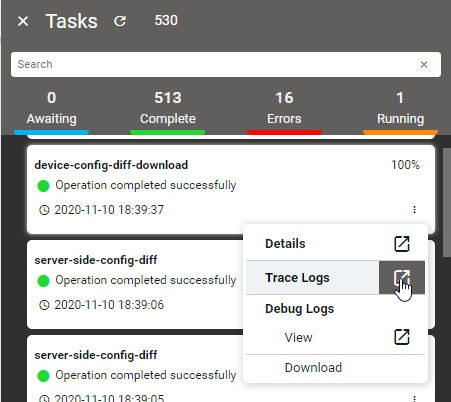
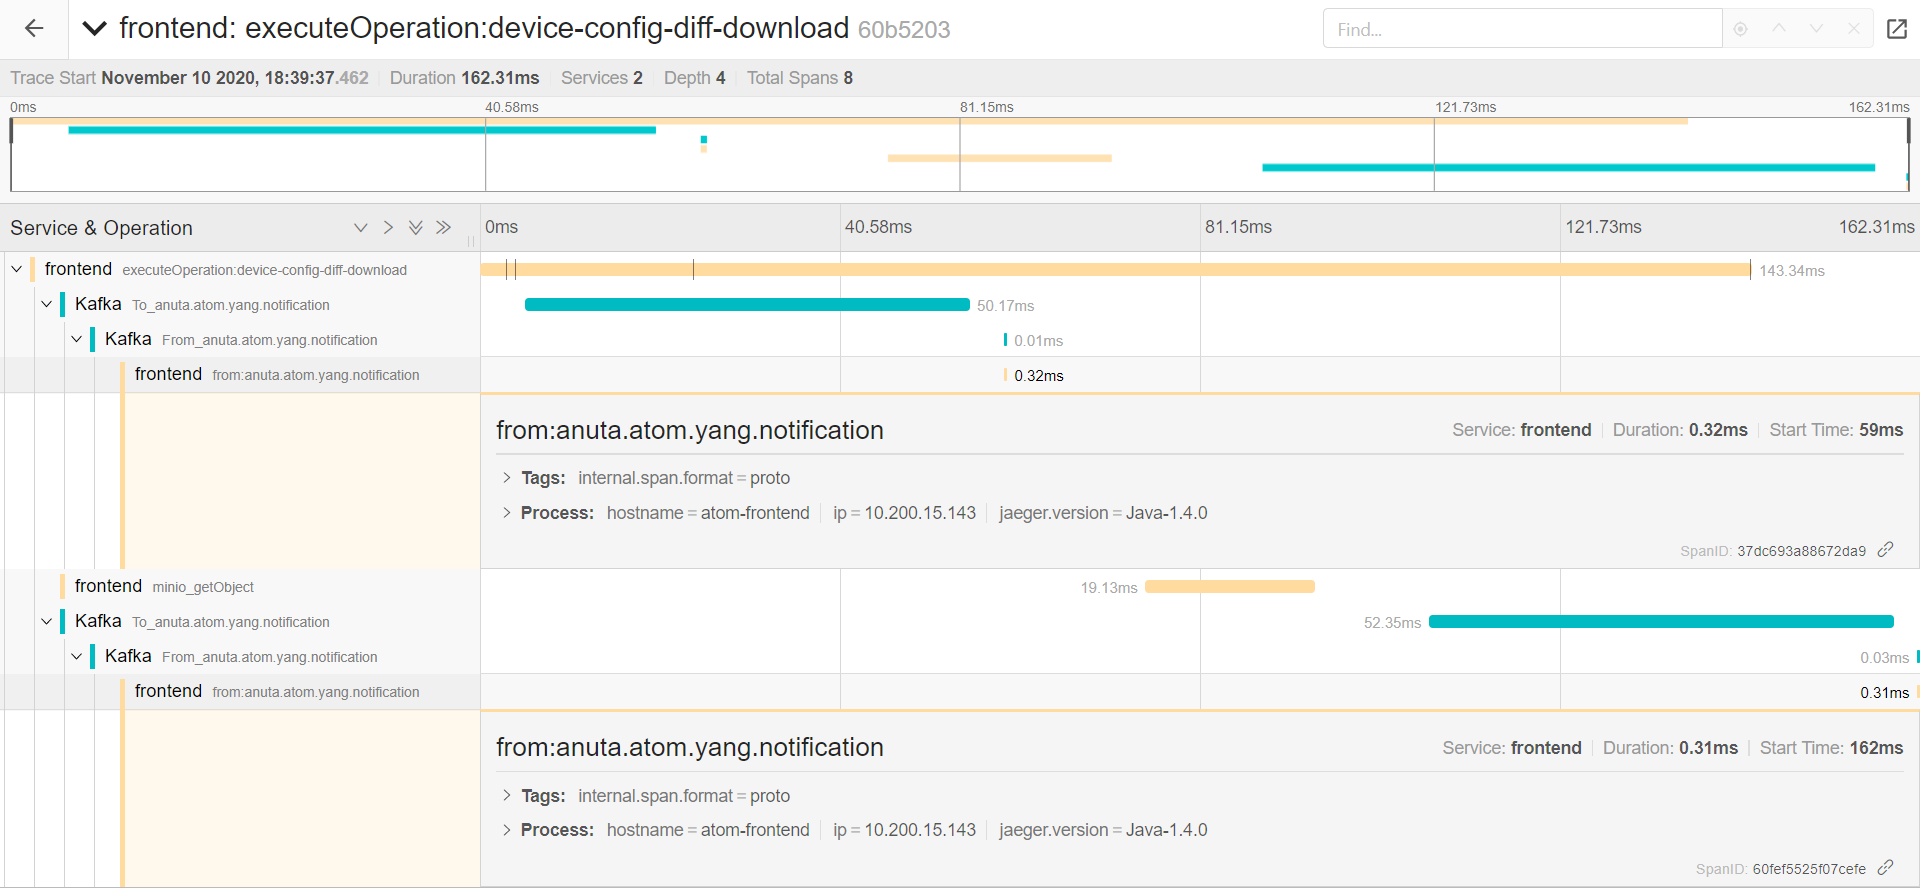
TraceLogs
Trace Logs enables users to end-to-end distributed tracing of a task.User can monitor the performance of the task and latency optimisation can be done. It actually helps users to encounter the root cause analysis. The Tracelog option was enabled in tasks UI and also in tasks and events. Select any task and click Trace Logs to view the task in distributed tracing.Trace logs UI can be visualized from jaeger UI, this shows a complete cycle of the task and all the components involved in it. To Enable TraceLogs Navigate to Administration > User Management > UsersHere select a User and Entities > DLS-Config 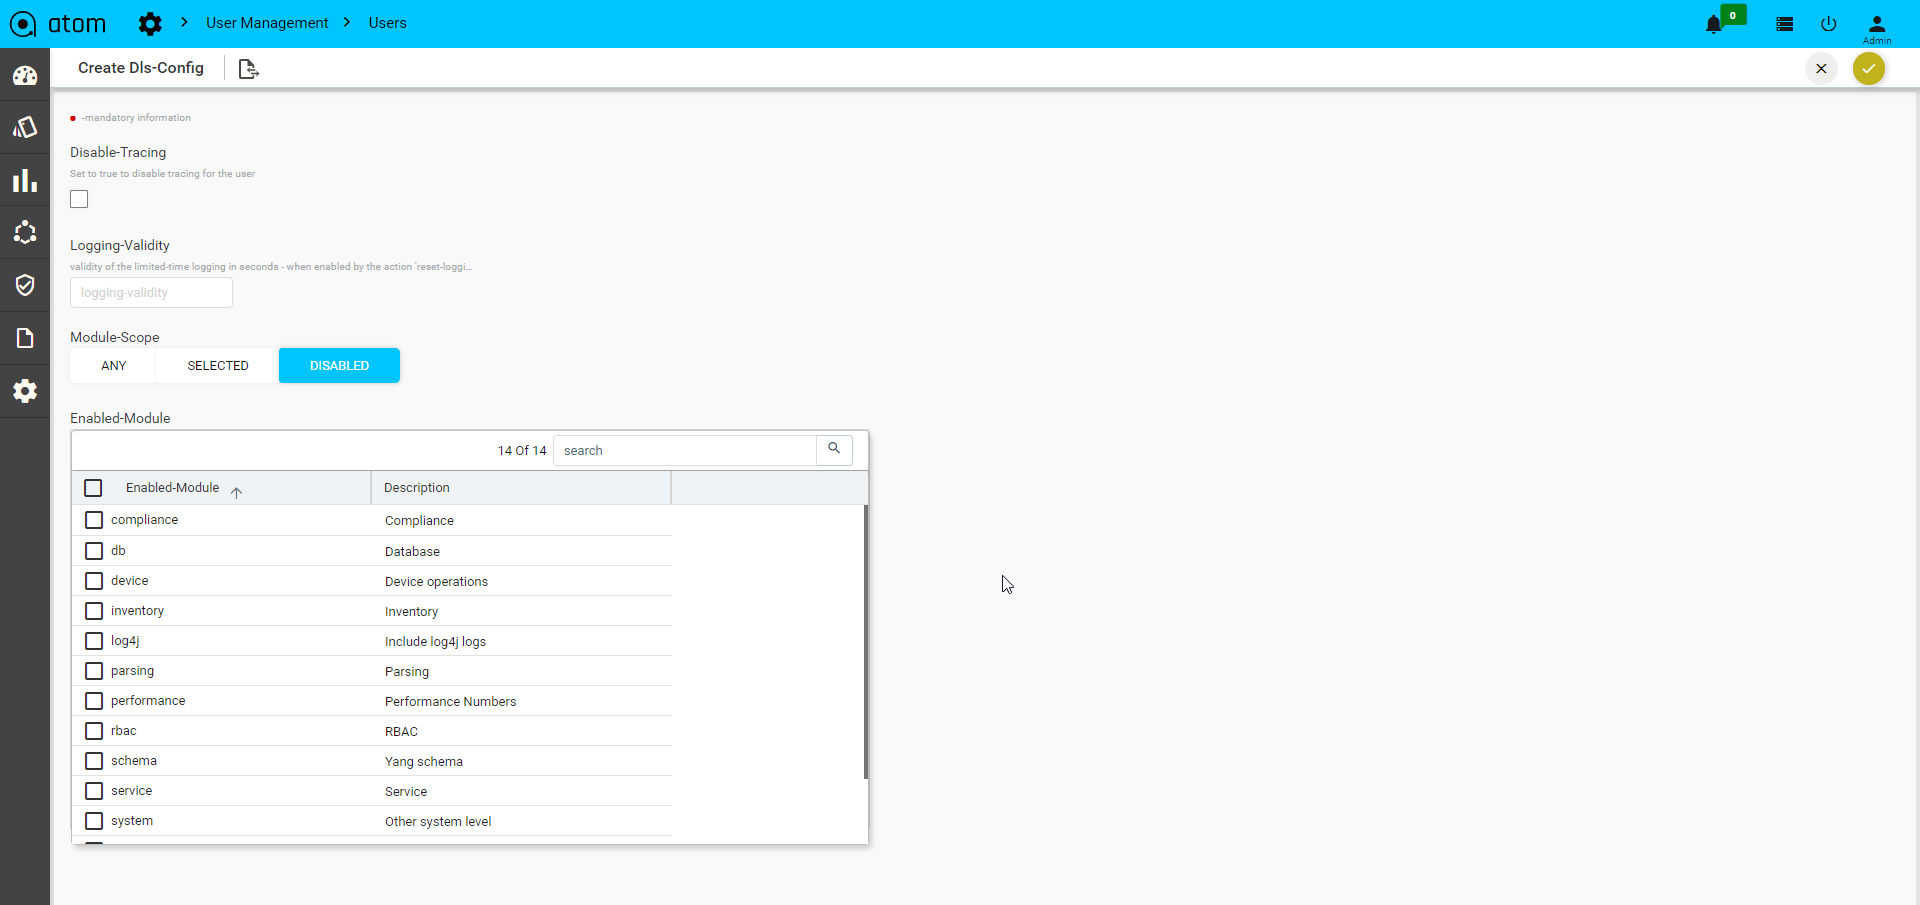
- Disable-Tracing: Set true to disable tracing for the user.
- Logging-Validity: Validity of the limited-time logging in seconds.
- Module-Scope: List of the modules that are supported for tracing. Any: Enables any of the modules selected. Selected: Enables only selected modules to tracelogs. Disabled: Selected Module will disabled while tracing.
| Note: When you select the trace logs from tasks UI it opens in the new tab as jaeger UI with SSO URLs. When you select trace logs from Tasks and Events then it opens in the ATOM application itself as a new window. To enable trace logs from deployment jaeger-tracing pods should be up. |
System
As an administrator, you may want to configure or modify the system settings or customize these settings after installing ATOM.
- “Rule Engine“
- “License“
- “General Settings“
- “Look and Feel“
- “Event Summary“
- “Notifications“
- “Message Brokers“
Rule Engine
Rule engine is a functionality in which the user‐defined business logic is executed to bring about changes in the state of the resources managed by ATOM. The logic describes the sequence of operations that is associated with data in a database to carry out the rule. You can create rules in the Rule engine for ATOM to handle changes in devices in a maintainable, reusable, extensible way. Rule engines support rules, conditions, priority (based on index), and other functions. Rules can be constructed to serve various functions, some of which are listed below:
- Resources Validation
- Triggering different actions based on some user defined conditions
All the system defined rules available in ATOM as shown in the following snippet:
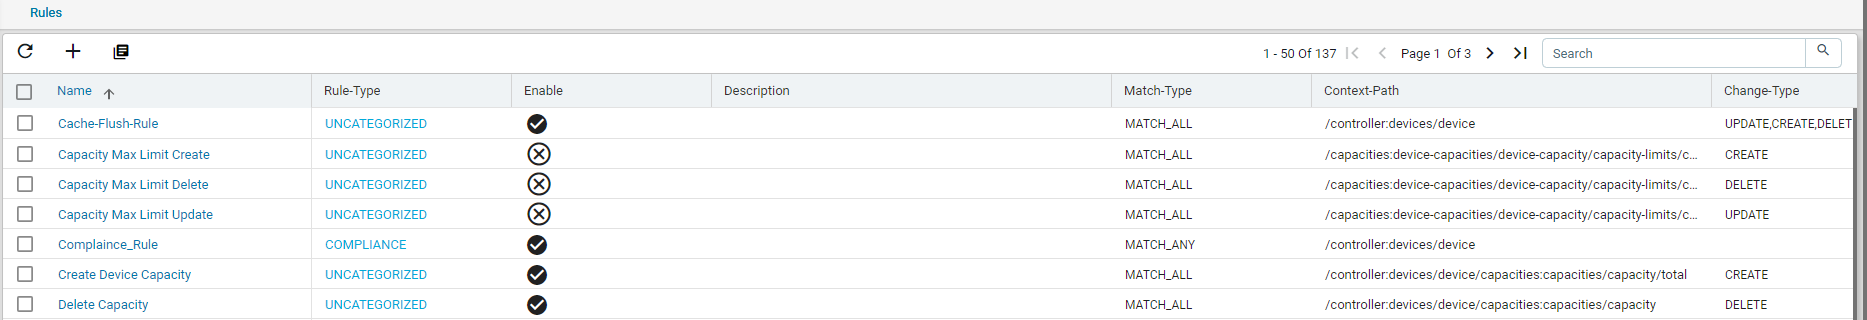
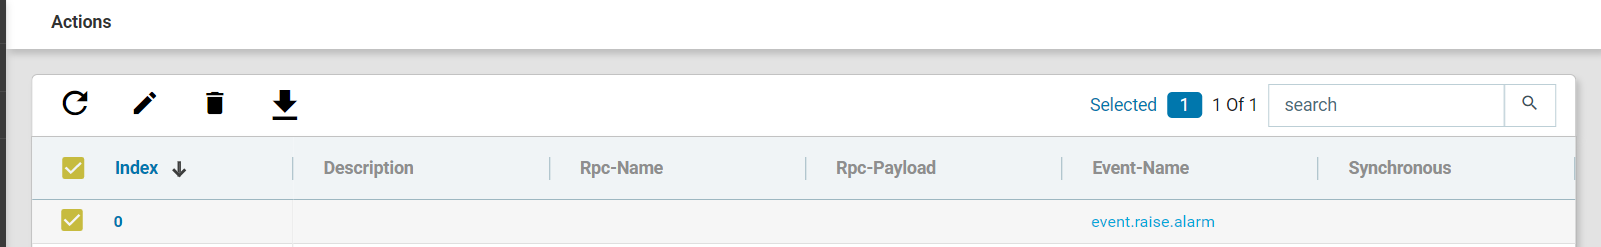
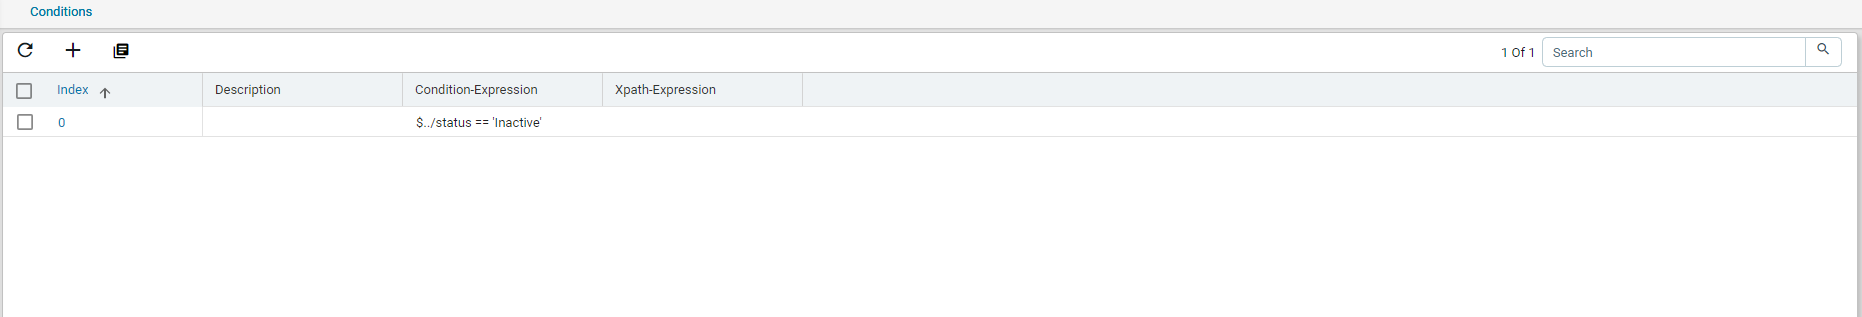
Click on any rule > Entities of your interest and view the Actions and Conditions associated with that rule.
For example, double click the ‘agent-down-alarm’ rule as shown below:
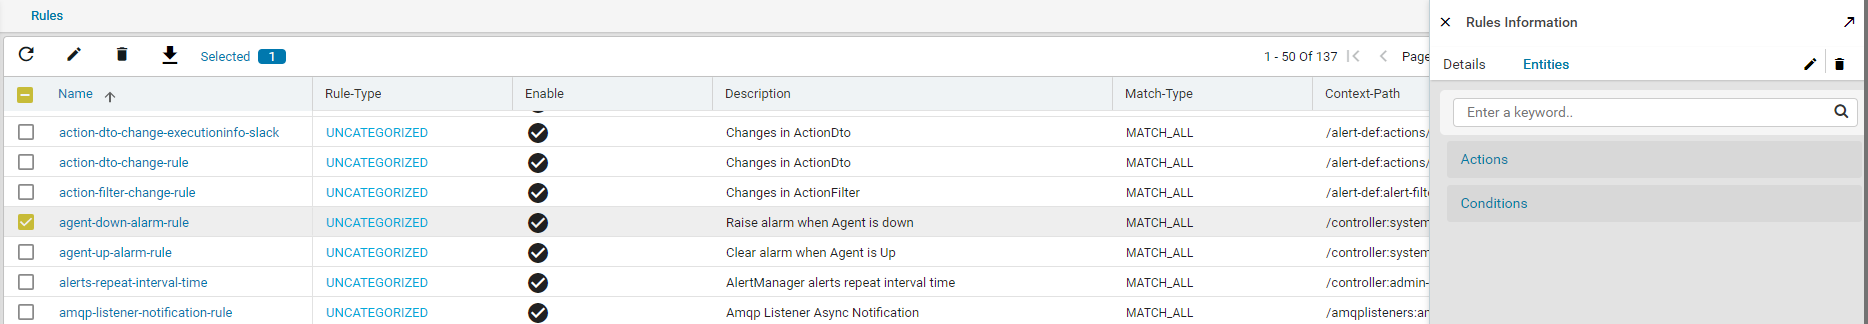
This rule comes to effect when any of the ATOM Agents goes OFFLINE and the status is set to INACTIVE.
In addition to the rules that are available by default, you can create a custom rule as per your requirement as described in the following section.
Rule
Rules are conditional statements that govern the conduct of business processes. A rule consists of a condition and a set of actions. If that condition is met, and is evaluated as true then the rule engine initiates one or more actions.
A rule is composed of three parts:
- Condition ‐ The condition part is a logical test that, if satisfied or evaluates to true, causes the action to be carried out
- Action ‐ The action part consists of one or more actions that need to be performed when the condition is met.
- Event ‐ The event part specifies the signal that triggers the invocation of the rule.
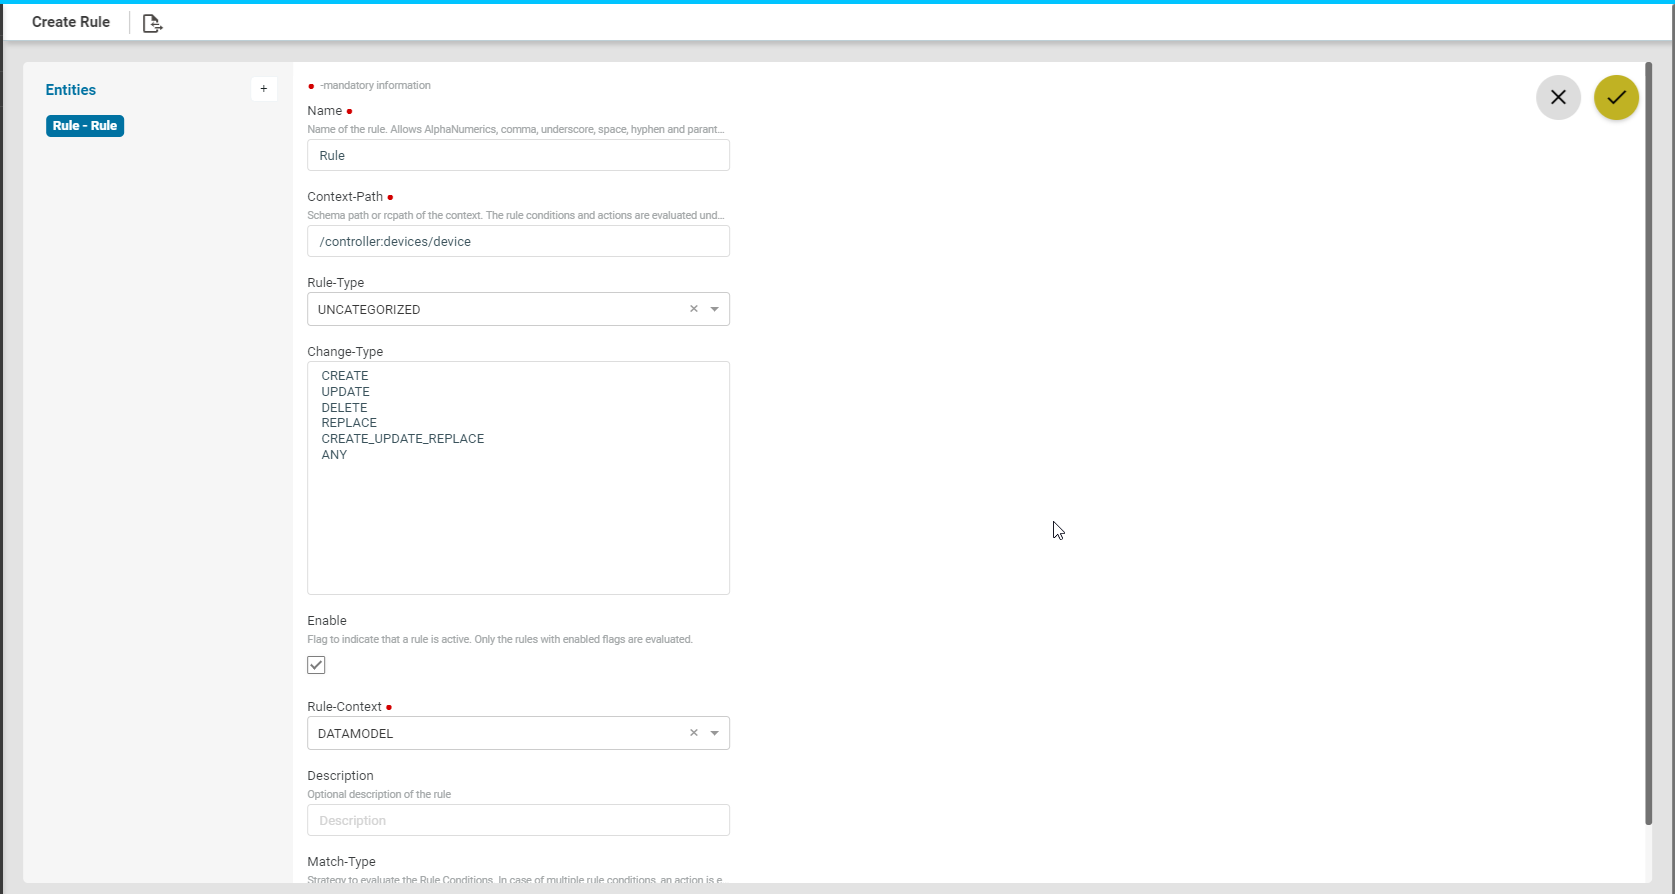
Create Rule
- Navigate to Administration > System > Rule Engine > Rules
- Click Add Rule and fill the following fields:
-
- Name: Enter a string that will be used to identify the rule.
- Rule Type: Select the category that the rule should belong to.
There are two types of categories available now:
-
-
- UNCATEGORIZED
- COMPLIANCE
- Enable: Select this option if the rule should be enabled.
- Rule Context: Enter the context in which the rule has to be triggered:
-
-
-
- DATAMODEL: Select this option if the rule should be triggered on a ATOM managed entity.
- Context path: Example: For this rule to be applicable on the devices, enter the context path as /controller:devices
- EVENT: Select this option if the rule should be triggered in the case of an event generated in ATOM.
- DATAMODEL: Select this option if the rule should be triggered on a ATOM managed entity.
-
- Event Spec: Select from the available event specs in ATOM:
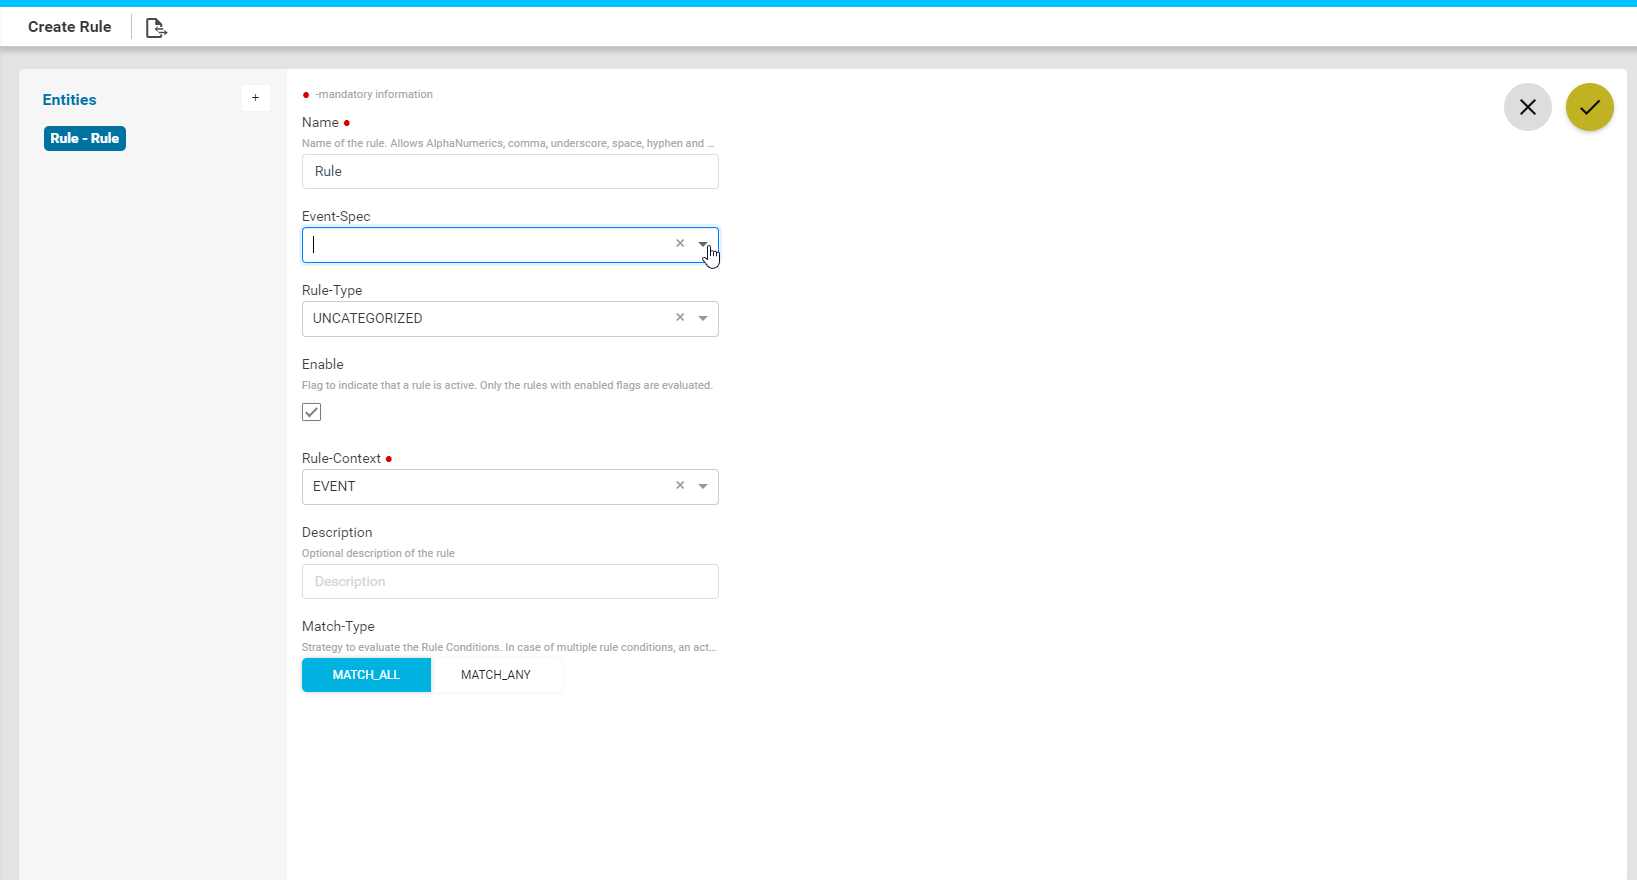
-
- Description: Enter descriptive text for the rule
- Change type The rule engine will check for the conditions defined in the rule when one of the following scenarios listed below:
Change -Type Description
- CREATE A component is created in ATOM
- UPDATE A component is updated in ATOM
- DELETE A component is deleted from ATOM
• Match-Type The conditions can be evaluated on an ANY or ALL basis.
Match-All: . All the conditions will be matched before executing the action.
• Match-Any: Any condition of the condition‐set will be matched before executing the action.
Create conditions?
Conditions are statements that should be qualified by the system before subsequent actions can take place. In other words, conditions are what the rule is looking for to trigger an action.
- Navigate to Administration > System > Rule Engine > Add Rule
- In the Create Rule > Select Entity > click on + > conditions >click on + > rule-condition
- In the right pane, enter values in the following fields:
- Index: Enter a unique number as an identifier
- Condition‐Expression: Enter an expression that should be checked by the rule engine for the condition to be true.
Example: To check for a condition when the device is ONLINE, enter an expression: /controller:devices/device/status == ‘ONLINE’
| NOTE: Condition expression * means that the rule is triggered on all the conditions as defined in the context path. |
- Description: Enter some text describing the condition.
Create actions?
Actions are operations that will be performed on the entities managed by ATOM once that the condition is evaluated as true by the Rule Engine.
1. Navigate to Administration > System > Rule Engine > Add Rule
2. In the Create Rule > Select Entity > click on + > Actions
3. In the right pane, enter values in the following fields:
- Index: Enter a unique number that will be used as an identifier and also setting the priority
- Type: Select the type of the component that should be acted upon, once the set condition is true.
- Description: Enter a description for the rule‐action
- Event-Name: Select the appropriate event‐name from the drop‐down menu
Licensing & Entitlements
Usage limits in ATOM are enforced through a license file issued by Anuta Networks.
ATOM in Dedicated Mode
License File can be applied at System Level or at Each Tenant. This is applicable to ATOM Cloud Customers using a Silo/Dedicated Instance or an On-Premises instance. Following are the Admin & Tenant privileges:
- Anuta Networks will issue the License
- For On-Premises Deployment – Customer will apply the License
- For ATOM Cloud Deployment – ATOM Cloud Administrator will apply the License
- System Admin will have full access (View, Apply & Usage) to System and Tenant License Files
- Tenant Admin/User will be able to view Available licenses and Usage for Tenant they are assigned to
ATOM in Multi-Tenant or Shared Mode
This is applicable only in ATOM Cloud Following are the Admin & Tenant privileges:
- Anuta Networks will issue the License
- Anuta Cloud Administrator will issue & Apply the License for each Tenant
- System Admin will have full (View, Apply & Usage) access to System and Tenant License Files
- Tenant Admin/User will be able to view Available licenses and Usage for Tenant they are assigned to
Uploading a License
We can upload the license using the upload button. Multiple license files can be uploaded to ATOM. Usage limits are cumulative of all License Files.
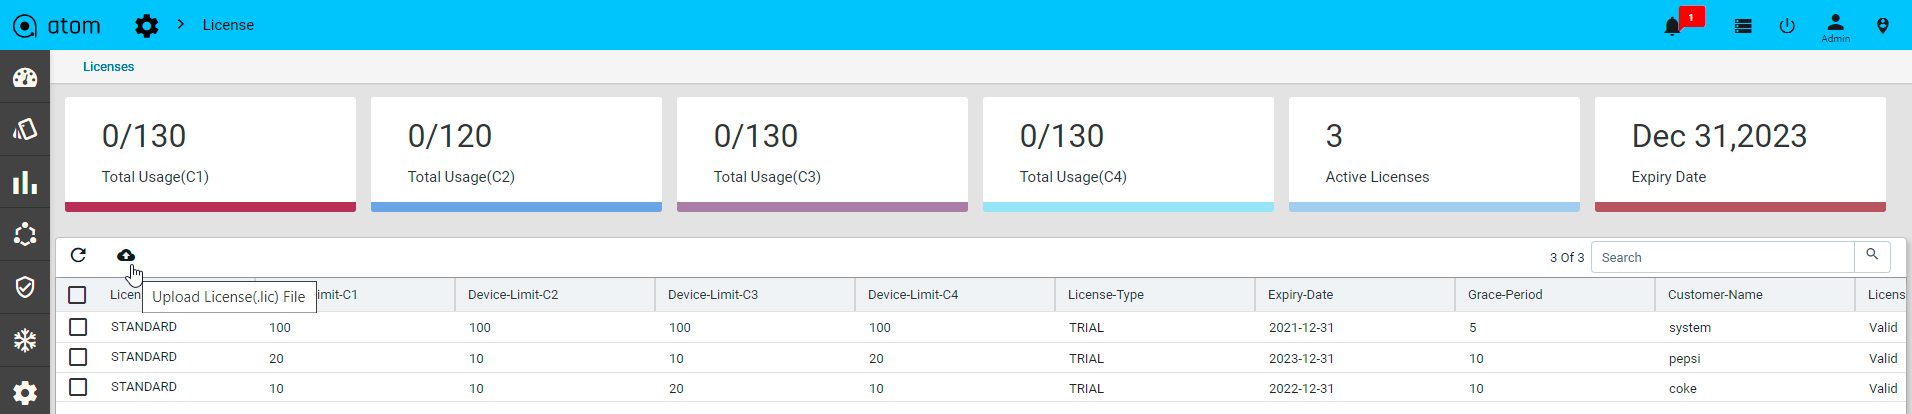
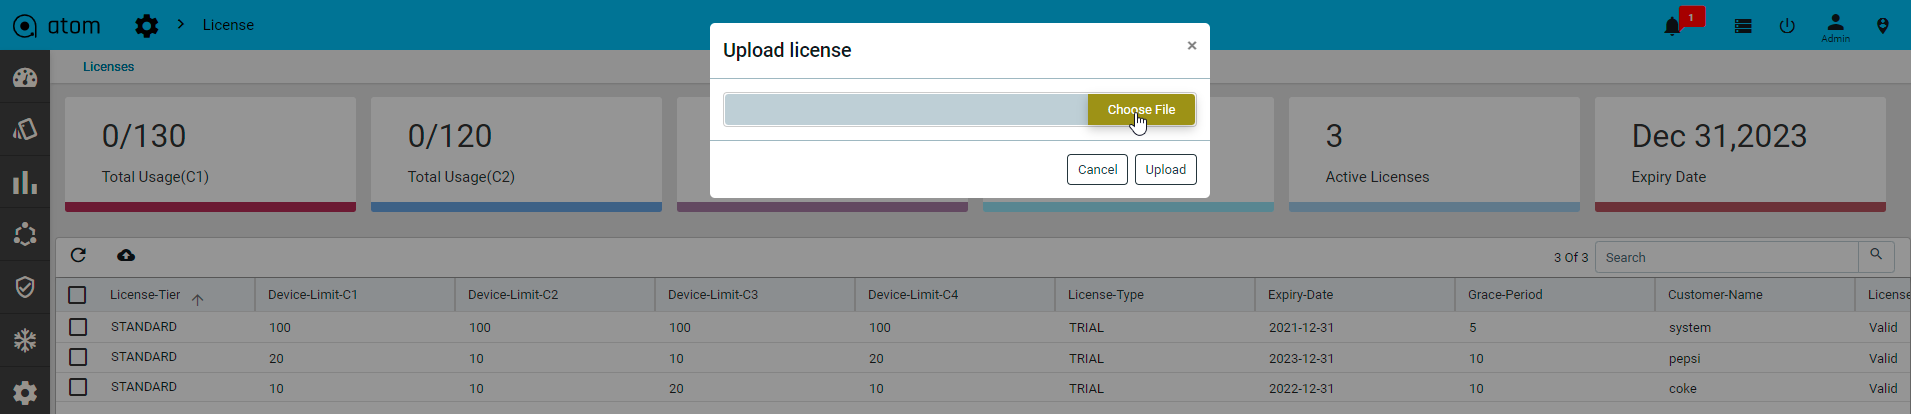
License Summary
To view the License Summary & Details – Navigate to Administration > License
License Summary will show the overall summary across all the License Files.
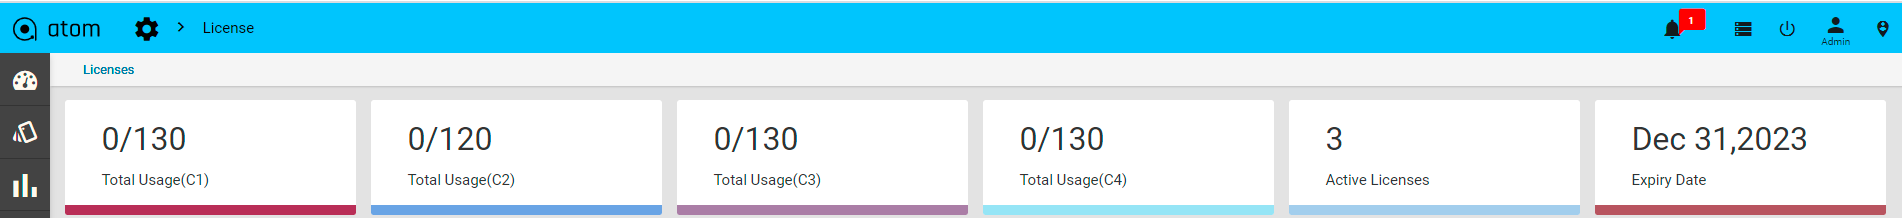
Total Usage(C1): C1 Category Licenses Used vs Allowed
Total Usage(C2): C2 Category Licenses Used vs Allowed
Total Usage(C3): C3 Category Licenses Used vs Allowed
Total Usage(C4): C4 Category Licenses Used vs Allowed
Active licenses: Number of licenses which are active will be shown under active licenses
Expiry date: Farthest expiry date among all the License Files
Below the License Summary, all available License File details are shown as below:
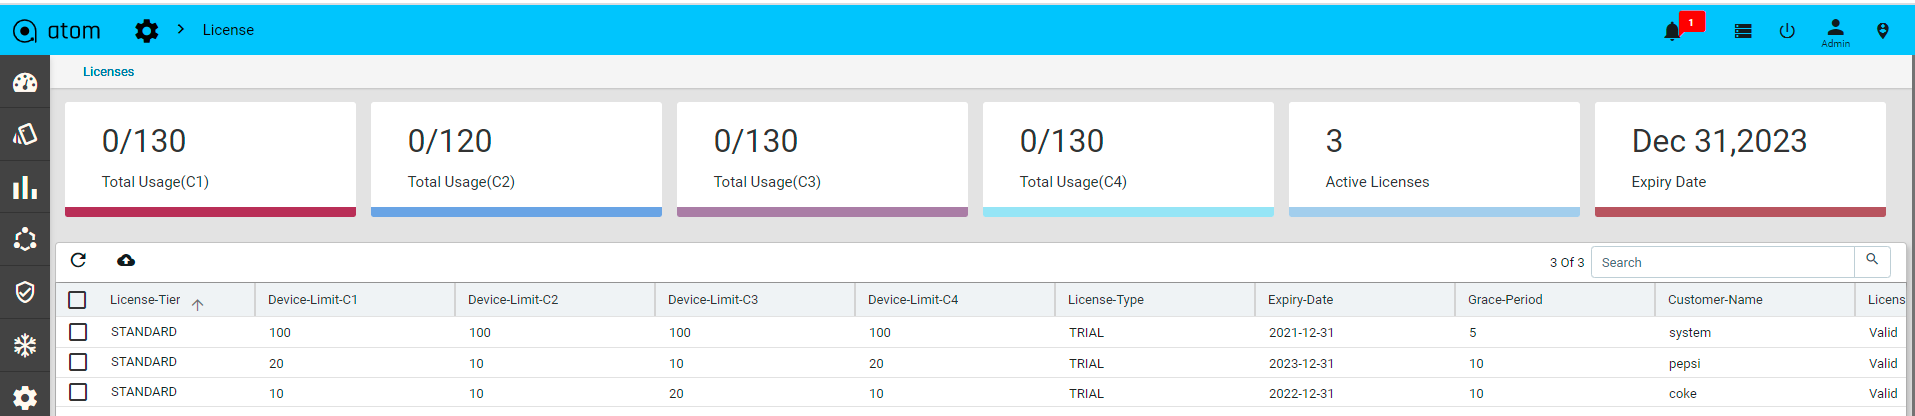
Tenant admin license
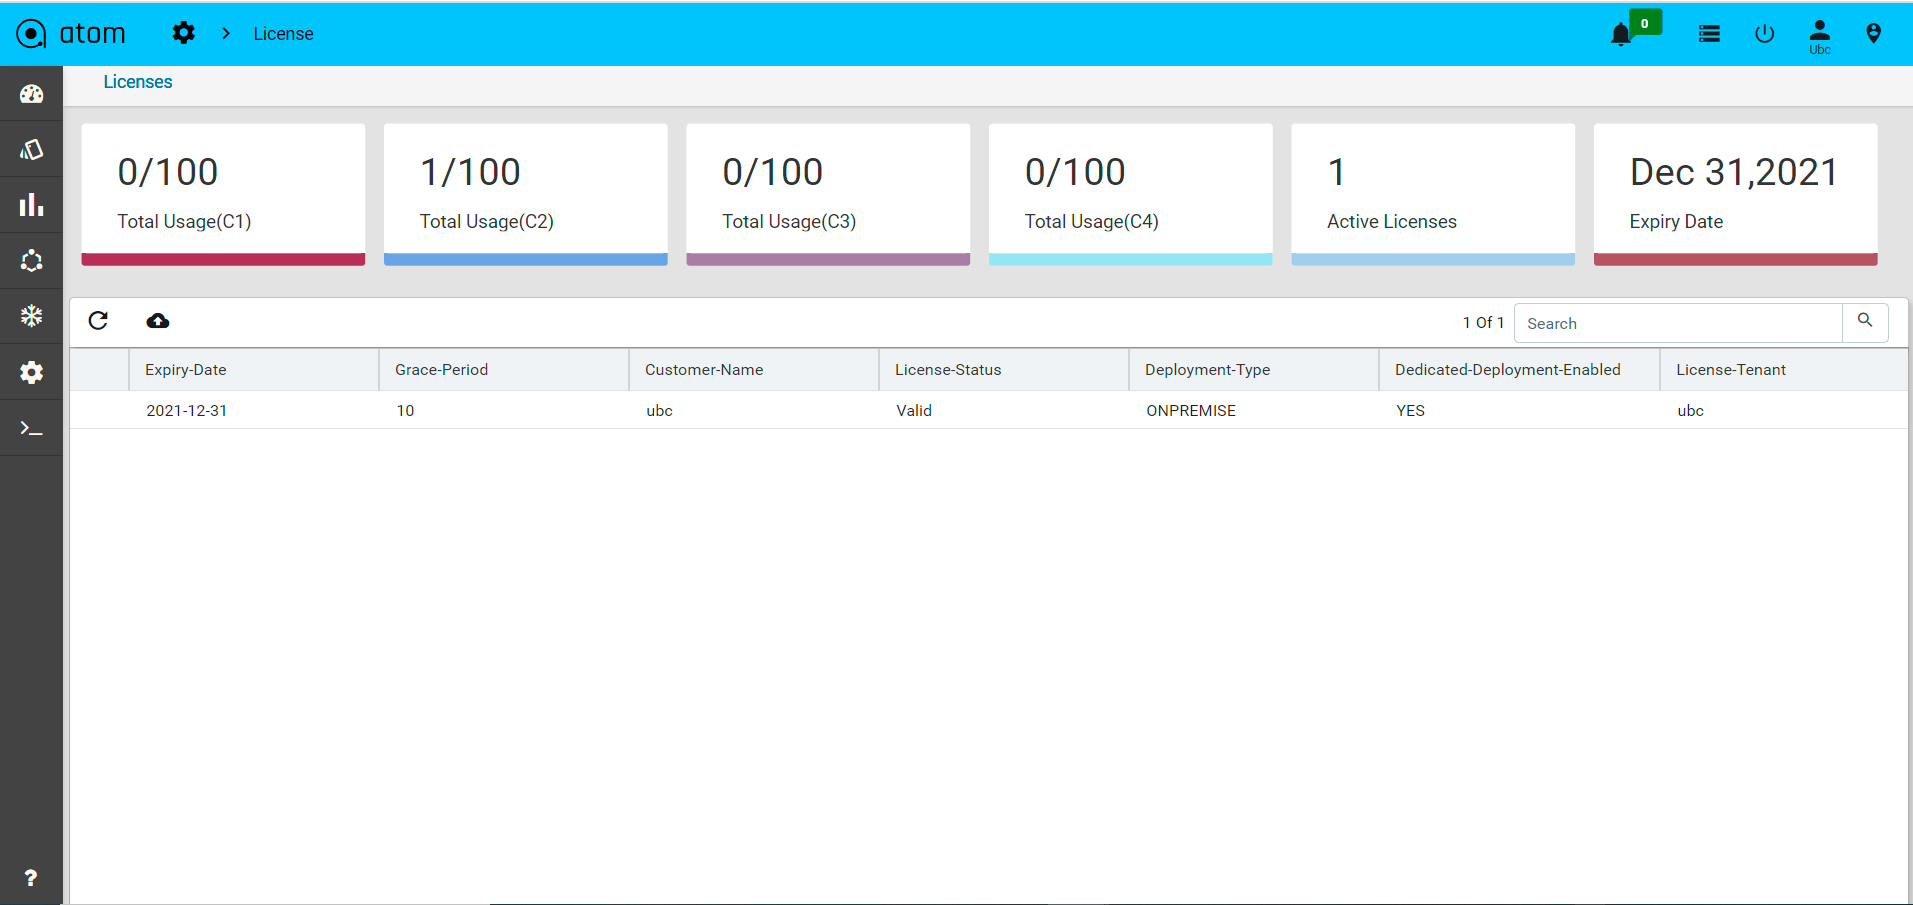
General Settings
You can edit and save the change the configuration parameters for each module in ATOM and these global changes are applicable to all the resources contained in each module.
- Go to Administration > System > General Settings
- In the General Settings panel, you can review the default settings of the following options and modify them.
- Click Edit to modify the parameters arranged for each module.
URL Management
- Base URL: This option enables the administrator to set the address (Base URL) for the third‐party clients to make API request calls to ATOM server. The format of the Base URL is http[s]://ip|hostname, where ip is the IP address of the ATOM server and the hostname is the host name of the ATOM server.
- Support URL: Enter the URL of the support to login to the support portal of Anuta Networks
- User Session Timeout: This is the time that you can set for the ATOM server to timeout if no activity takes place in the browser for a specified period of time. The user will be automatically logged out of the session, after the expiry of the specified time.
Alert Monitoring
1.Unwanted-alertlabel-keys: Each alert consists of multiple labels like alert name, app, collections_name etc, out of which some may not be persisted in Atom.
Chart-setting
1.Chart-theme: Select the chart theme from drop down,it should show in the monitoring custom chart.
2.Chart-refresh-interval: To set the default refresh interval,it should refresh the chart based on the given interval time in this global set.
Device Management
- Configuration Retrieval: This option enables the server to retrieve configurations from the devices after each operation. By default, this option is selected.
- Syslog Configuration: This option enables ATOM to configure the device to send syslog events. By default, this option is selected.
- Persist Configuration: This option enables the configurations to persist in the NVRAM of the device after each provisioning.
- Dry Run: This option enables ATOM to push the commands to the device or not. When selected the commands are pushed to the device..
- Auto Retry: Select this option to enable ATOM to try establishing the connection with the device in case the connection is lost initially
- Number of Retries: Enter the number of times that ATOM should try establishing the connection with the device in case of failure.
- Retry Wait Time: Enter the time period that ATOM should wait between subsequent retries.
- Configuration Parsing: This option enables ATOM to parse the configuration retrieved from the device and store the configuration data in the data model maintained in ATOM.
- Configuration Pull Type: This option determines how the mode of retrieving the running configuration from the device
- TFTP_EXPORT – The running configurations are obtained from the TFTP server
- SHOW_COMMAND – The current configuration on the device are obtained by ATOM
- Log Running Config: This option enables ATOM to dump the retrieved configurations from the device in the logs obtained for the Config Retrieval Jobs.
- Run-extended-inventory: TConfiguration settings on disabling the extended inventory when device is added
- Generate-config-inventory-event: This option allows ATOM to enable or disable the config inventory event
Service now
1.Snow-instance : To enable service now option to perform the service now workflow
2.Snow-url : To provide the instance id for service-now
3.Snow-username : User name for service now
4.Snow-password : Password for service now
Service Management
- Service Auto Retry: Select this option if ATOM should retry pushing the configurations to the device in the event of a service failure.
-
- Service Number of retries: Enter the number of times ATOM should retry sending the configuration after initial failure of the service.
- Service Retry Wait Time: Enter the duration of the time that ATOM should wait before trying to establish a connection with the device again.
- Auto Delete Stale Inv Data: Select this option if all the available “stale” entries should be deleted from ATOM. Stale entries are the configurations that are available in the device and not seen in ATOM. These differences are not due to the service configurations created by ATOM and pushed to the device.
- Delayed Event Buffer Time:
TSDB
1.Retention-period: Retention period of prometheus db
2.Retention-size: Retention period of prometheus db
3.Namespace: Namespace to get the stateful sets and config map
4.Tsdb-url: Url to get metrics
5.Workflow-url:The url to get workflow
6.Tsdb-config-map-name:The name of the tsdb config map
7.Tsdb-stats-name:The statefulset name of the tsdb server
8.Tsdb-infra-alert-config-map-name:The name of the tsdb config map for system alert
9.Alert-repeat-interval:The repeat interval time of the alerts
10.Tsdb-alert-manager-config-map-name:The name of the alert manager config map
SNMP v2 Configurations
- Enable Device Audit Trail Mode: Select this option to view all the events generated in ATOM while communicating with the device using the SNMP protocol. SNMP events such as SNMP WALK, GET, DEVICE_LOGIN and DEVICE_COMMAND EXECUTION are captured in ATOM as Events.
- Enable Multi Tenancy: Select this option to enable ownership of the resource. Once this option is enabled, the fields “Owner & Sharedwith” are displayed
- SNMP Configuration Contact: Enter the mailing ID for contacting the admin (support) managing the SNMP server.
- SNMP Configuration Location: Enter the location of SNMP server
- SNMP Community string: Enter the community string required for authentication in SNMPv2 sessions..
SMTP Configurations
You may have to configure an external email server to send email notifications to the ATOM users.
SMTP Mail From: You can set up an external SMTP email server to send email notifications to the ATOM users. To do so, enter values in the fields described below:
- SMTP Host: Enter the name of the server that will send the email.
- SMTP Port: Enter the number of the port that is used to connect to the SMTP host
- SMTP Auth Required: Enable this option is authentication is required to connect to the SMTP Host
- SMTP User Name: Enter the name of SMTP user
- SMTP Password: Enter the password to retrieve the email.
- SMTP Encryption SSL: Select this option if the connection to the SMTP server should use SSL as the authentication method.
- SMTP Encryption TLS: Select this option if the connection to the SMTP server should use TLS as the authentication method
Notification
Email Notifications: Select this option if you wish to be notified via email about changes taking place in the system.
License Expiry Threshold (days): Set the number of days to notify the user that the license is about to expire.
Python Remote Debug
Python Remote Debug: Select this option if you want to allow debugging of the logs in ATOM remotely.
Debug Server Port: Enter the port number of the remote debug server.
Developer Options
Enable Developer Mode: Select this option for the Developer Options to be visible in ATOM.
Using the Developer Options, the admin can view the all the ATOM entities represented in the data model tree, figure out the xpaths of the objects , all the device and service ATOM SDK
System Maintenance
Enable Maintenance Mode: Select this option if the system needs to be suspended for some time during which no operation can be performed on the ATOM VM. All the TASKS running in ATOM should be in “COMPLETE” state before enabling this option.
View Actions
Show Module Prefixes: Enable this option if the module prefixes for child entities on Profile and Action items should be made visible.
Request Sanitization
As an administrator , you can protect the data entered in ATOM from malicious attacks in the form of HTML tags. These tags when injected into the application’s HTML code can make ATOM vulnerable to these attacks and have a large impact as any user of the application can be a target.
The data entered in ATOM can be sanitized based on the
- Security Sanitizer Enabled: Select this option if the sanitization filter should be enabled in ATOM.
- Sanitizer Exclude URL: Enter the tags that should be excluded from filtering. The patterns mentioned here are allowed as values in the text fields in any of the HTML forms used in ATOM. For example, These tags can be added in the exclusion list -/login,/initialize,/logout,/*.js,/controller:admin-settings$
- Sanitizer Patterns: Enter the patterns that will be used to sanitize the data and should not be allowed as values in any of the fields in any of the text fields in the HTML forms of ATOM.
An appropriate error message is displayed in the webpage when the user inputted data matches with the sanitizer pattern mentioned above.
Password Profile
The parameters required for a password that is used to authenticate logging into ATOM can be
- Password Expiry Days: Enter the number of days for which the set password is valid.
- Password Pattern:
- Password Min Length: Enter the minimum number of characters that should be contained in the password used to authenticate the logging into ATOM.
- Password Max Length: Enter the maximum number of characters that should be contained in a password used to authenticate the logging into ATOM.
Primary container load limit
1.Set the range of container load limit
Workflow
1.If true both delete both active and historical instances on package unload,if false, history will be maintained but unload will fail if active instances are there.
Look and Feel
You can change the “look and feel” of ATOM’s GUI by uploading images of your choice to ATOM.
- Navigate to Administration > System > Look & Feel
- Product Logo: Select the image that you should be displayed as the product logo, visible on all the screens.
- Login Screen Logo: Select the image that should be displayed on the login screen.
- Click Update for the uploaded images to come into effect on the UI
or
- Click Defaults to revert to the default images.
Event Summary
ATOM generated events are grouped into different categories, (Alarm, Services and System) with an assigned severity to each category. ATOM maintains an event catalog and decides how and when an event is created and whether to associate an alarm with the event. Events are generated in ATOM through notifications received via the syslog and trap messages, inventory changes, discovery of the devices, changes in the ATOM server itself.
The severity of events can be classified into:
- CRITICAL ‐ Events that demand the immediate attention of the system administrator. They are generally directed at the global (system‐wide) level, such as System or Application. They can also be used to indicate that an application or system has failed or stopped responding.
- WARNING ‐ A warning indicates that a component or application is not in an ideal state and that some further actions could result in a critical error. These can be treated as forewarning of a problem that might occur.
- ERROR ‐ Events that indicate problems, but in a category that does not require immediate attention.
- INFORMATIONAL ‐ Events that pass noncritical information to the administrator.
Not all Events are associated with Alarms. Multiple events can be mapped to the same alarm. All Alarm Events are associated with an alarm that can be either state, CLEARED or ACTIVE.
Notifications
All the events that are triggered in ATOM due to various reasons such as change in the component state, device unreachability, high CPU usage of the system and so on can be notified to subscribers. As an administrator, you can create notifications such that users, message brokers can be notified when an event is triggered.
Subscribers can be added to the events falling in any of these categories:
- Alarm Events
- Internal Events
- System Events
- Resource Events
- Service Events
Each of these categories contain many Events, pre‐defined in ATOM. You can create subscribers or the recipients of a particular notification.
- Navigate to Administration > System > Notifications
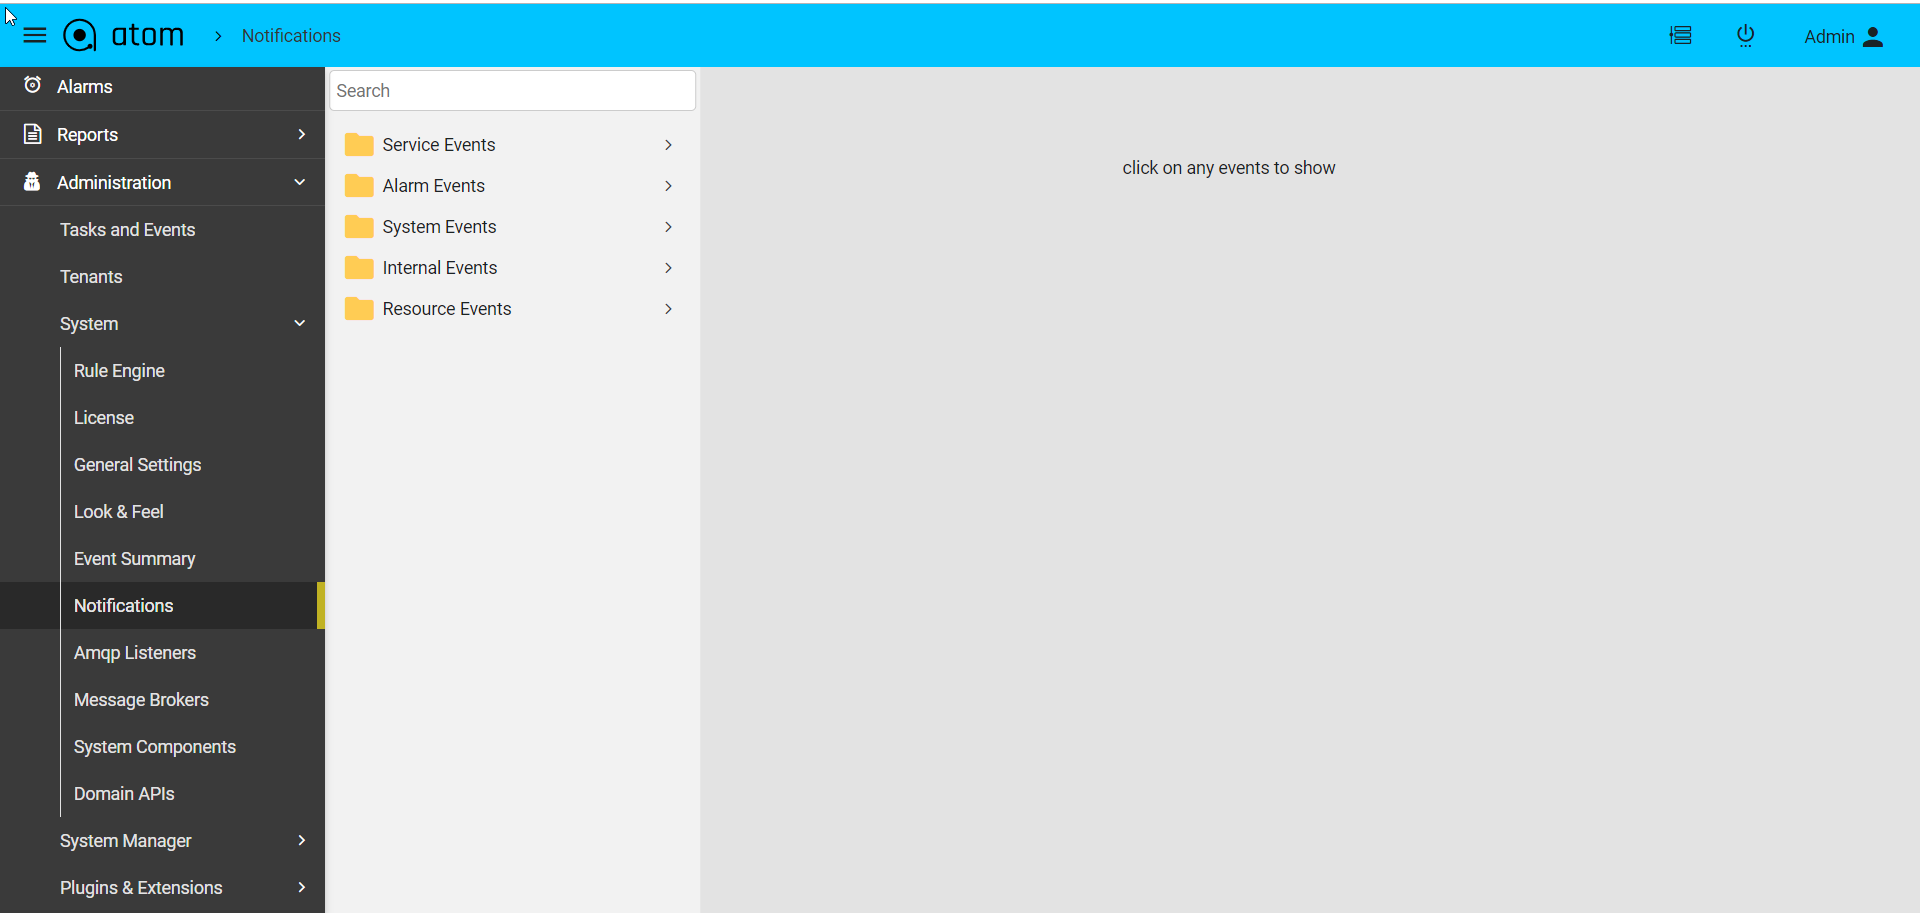
- In the left pane, click a folder (of your choice). All the events are grouped into different categories
- In the expanded view of the folder, select an Event as shown below:
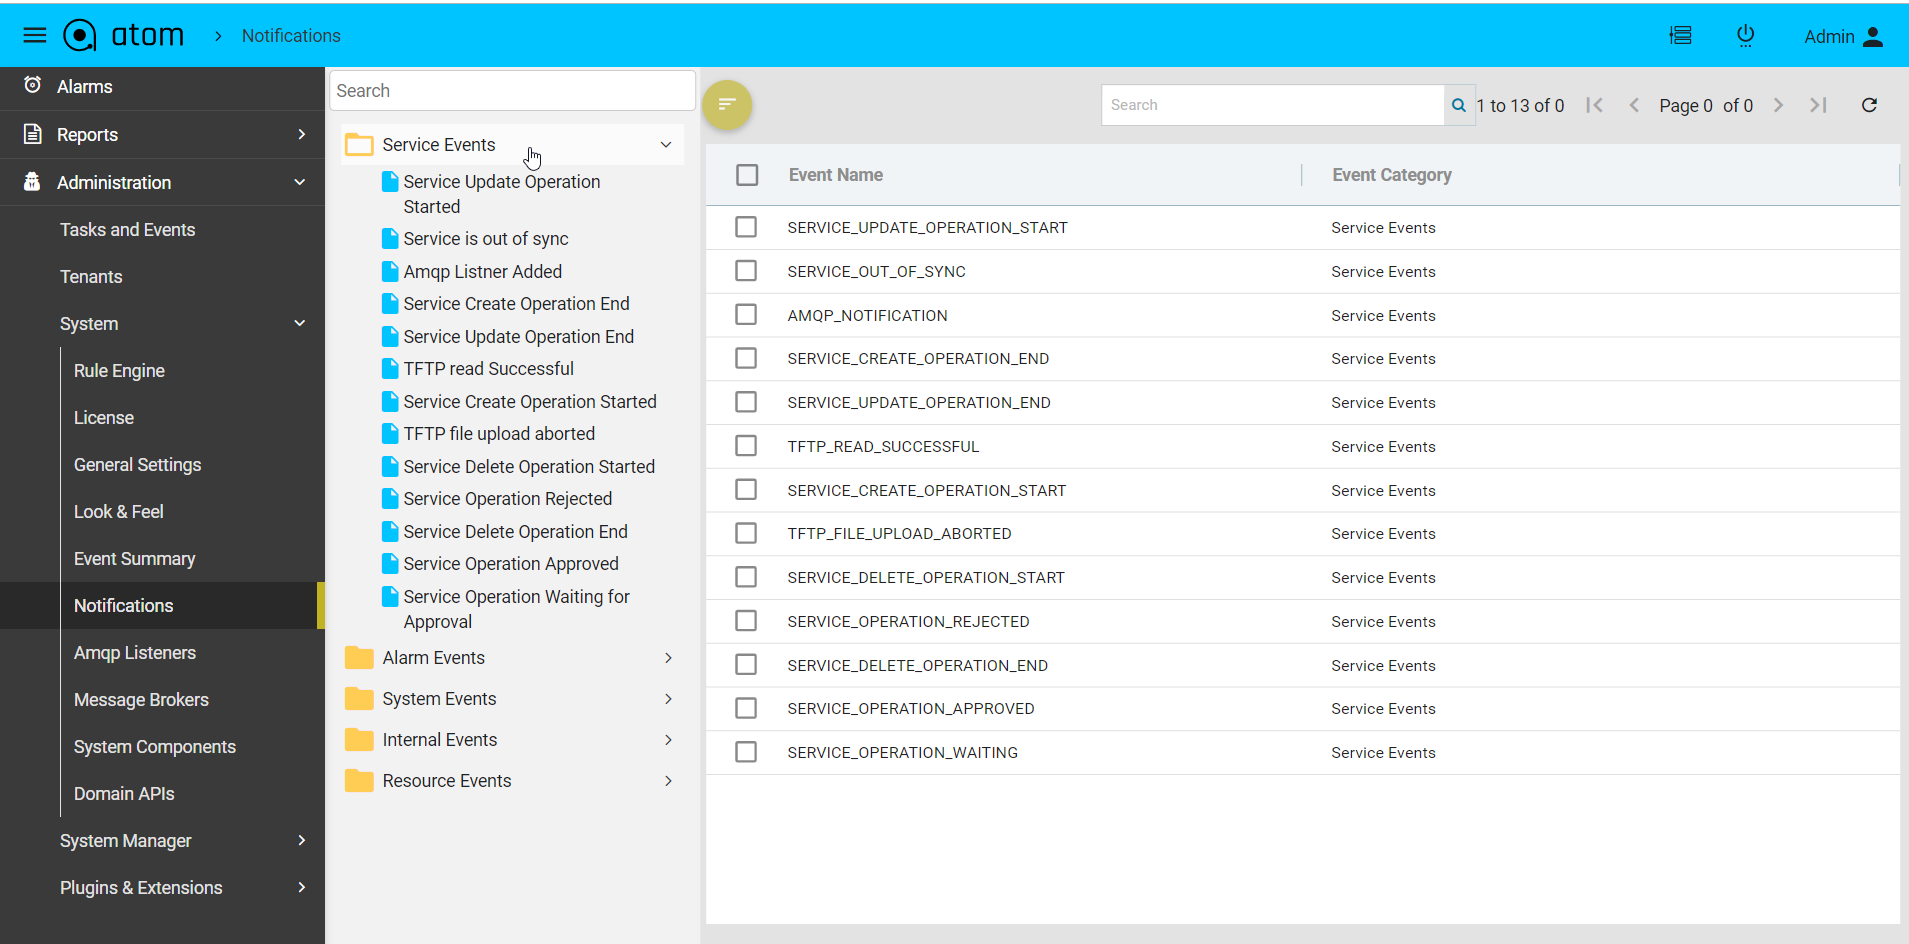
- In the Events Subscribers pane, click Add to the subscriber to the ATOM generated event.
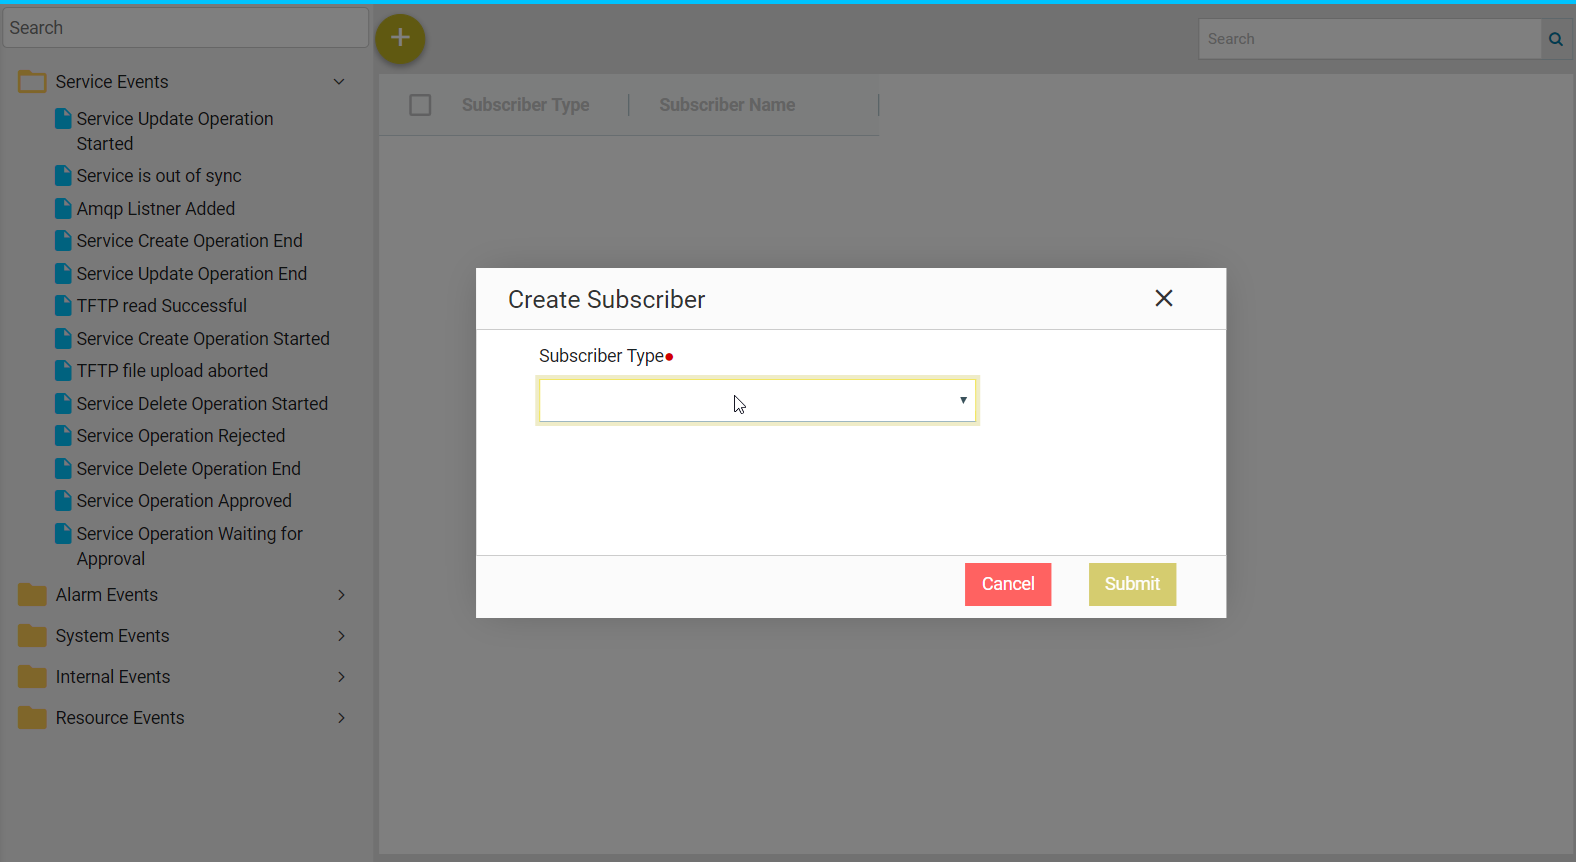
- In the Create Subscriber (s) screen, choose the type of the Subscriber:
-
- User
- These users are the users created in ATOM . See the section, Creating Users in ATOM
- AMQP Broker
- These are the message brokers where the events generated in ATOM are published. See the section, Creating Message Brokers for more information.
- User
Message Brokers
As an administrator, you can configure a message broker to publish the events generated by ATOM. A message broker can be notified of all events or an event belonging to a specific event type.
In the current implementation of ATOM message brokers, RabbitMQ is the supported AMQP server where ATOM publishes the events and from where any AMQP listener consumes them.
Prerequisites
Before creating Message Brokers in ATOM, check whether a virtual host exists in RabbitMQ.
If there is no existing vHost, create a new virtual host as shown below:
- Login to RabbitMQ and go to the Virtual Hosts tab to add a new vHost
- Add users for the created virtual host
- Create users with required permissions in the vHost
Creating Message Brokers in ATOM
- Navigate to Administration > System > Message Brokers > click Add
- In the Create message broker screen, enter the following fields as described below:
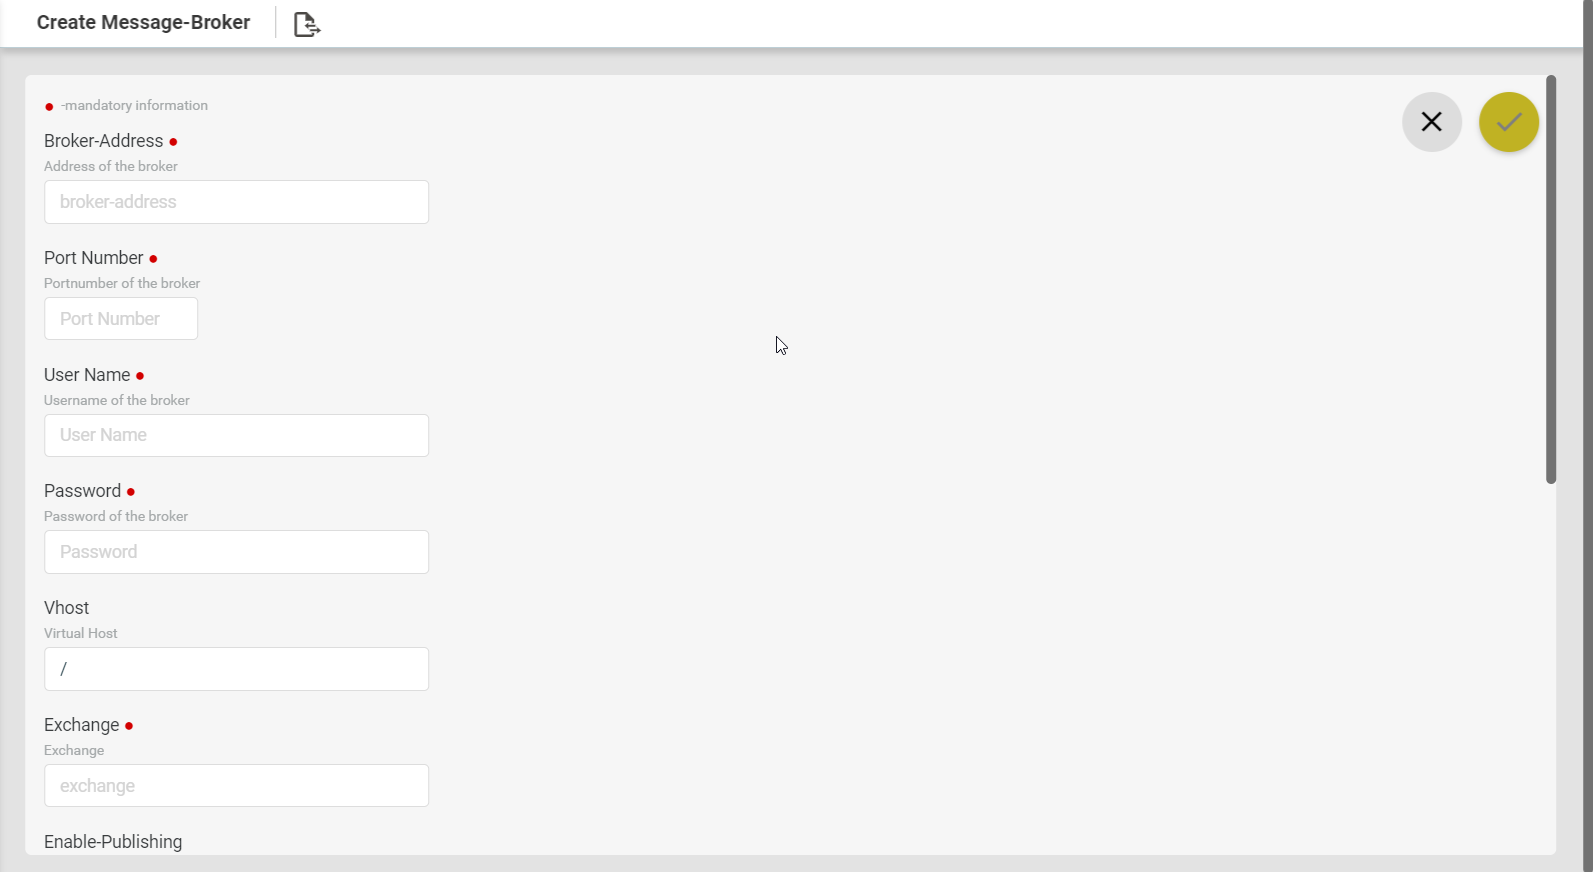
- Broker Address: Enter the IP address of the message broker (AMQP server which in our case is RabbitMQ).
- Port Number: This is the port number used to communicate with ATOM. By default, it is 5673.
- Username and Password: Enter the credentials for logging into the message broker.
- vHost: Enter the virtual host name that was created in RabbitMQ. Refer “Prerequisites” section.
- Exchange: Enter the name of the exchange in the message broker where the events generated in ATOM should be published. The default name is “ATOMNotifications”.
- Enable Publishing: This option enables the administrator to enable or disable sending notifications from ATOM to the exchange. By default, the checkbox is selected, which means that the events can be sent to the broker.
- Connection Status: After saving the Message Broker, this field will be updated to True/False based on the success or failure of connectivity to RabbitMQ
- Click Add to select the events that should be sent to the message broker.
AMQP Listeners
You can create AMQP listeners in ATOM so that the messages (events) published in ATOM can be consumed by them.
In the current implementation of ATOM message brokers, RabbitMQ is the supported AMQP server where ATOM publishes the events and from where any AMQP listener consumes them.
Prerequisites
- Login to RabbitMQ Message Broker using the appropriate credentials
- Create Queues in RabbitMQ
-
- Login to RabbitMQ and go to the Queues tab.
- Add a new queue as shown below:
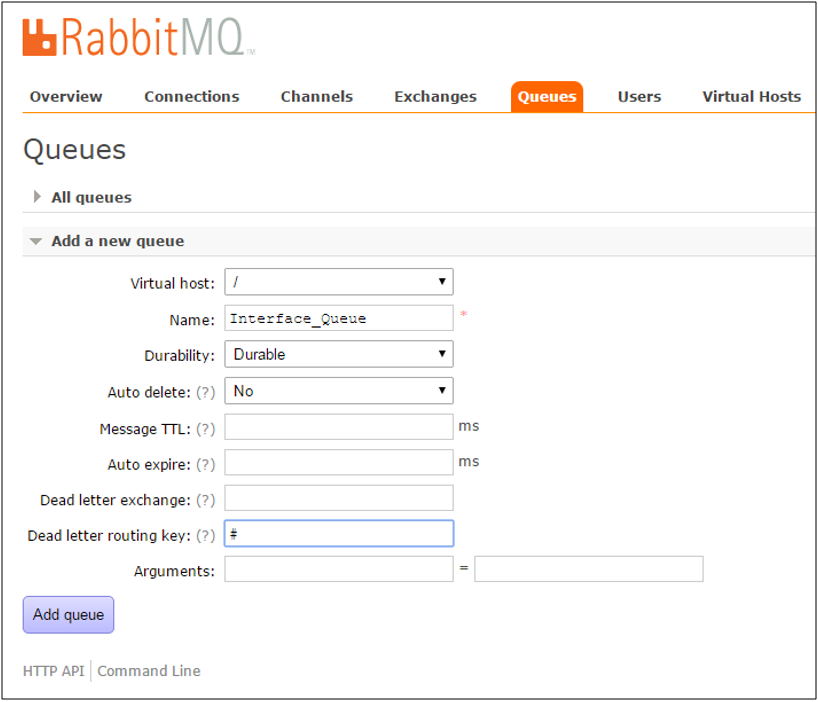
- Bind the Queue with the Exchange in RabbitMQ
- In RabbitMQ, navigate to Exchanges
- An Exchange entry is created in RabbitMQ and connection with ATOM is established
- Select the Exchange, “ATOMNotifications”, created in ATOM and bind the created Queue to the same as follows:
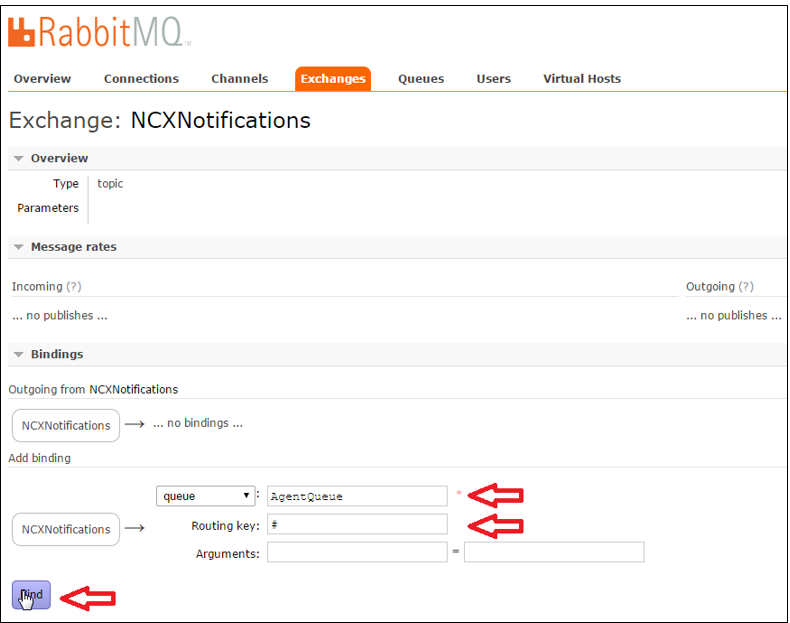
- Verify the messages in RabbitMQ
- Go to Queue > Get messages
- In the Messages field, enter a number for the messages that you want to be displayed.
- Click Get Messages as shown below:
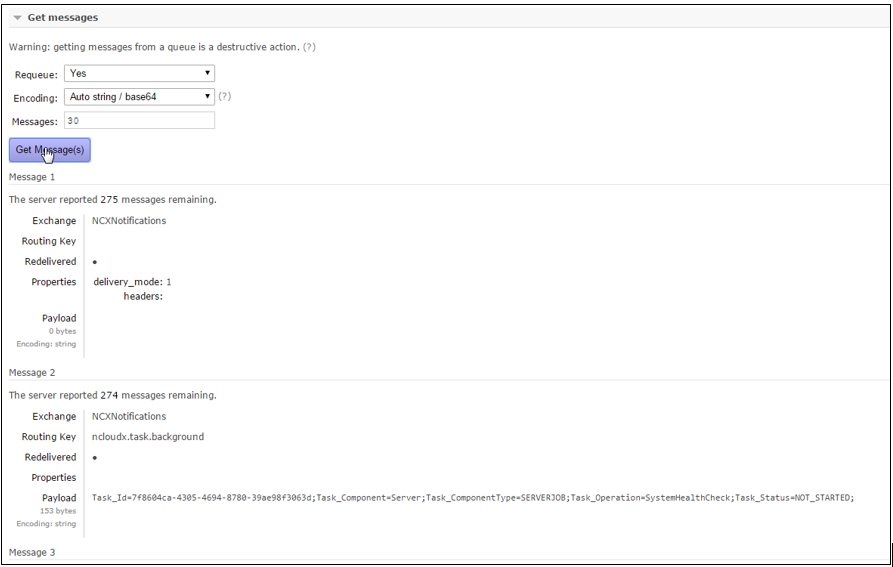
To create the AMQP listener in ATOM, do the following:
- Navigate to Administration > System > AMQP Listeners
- Click Add AMQP Listener in the right pane to create a listener in ATOM
Enter values in the fields in the Create AMQP Listener screen as described below:
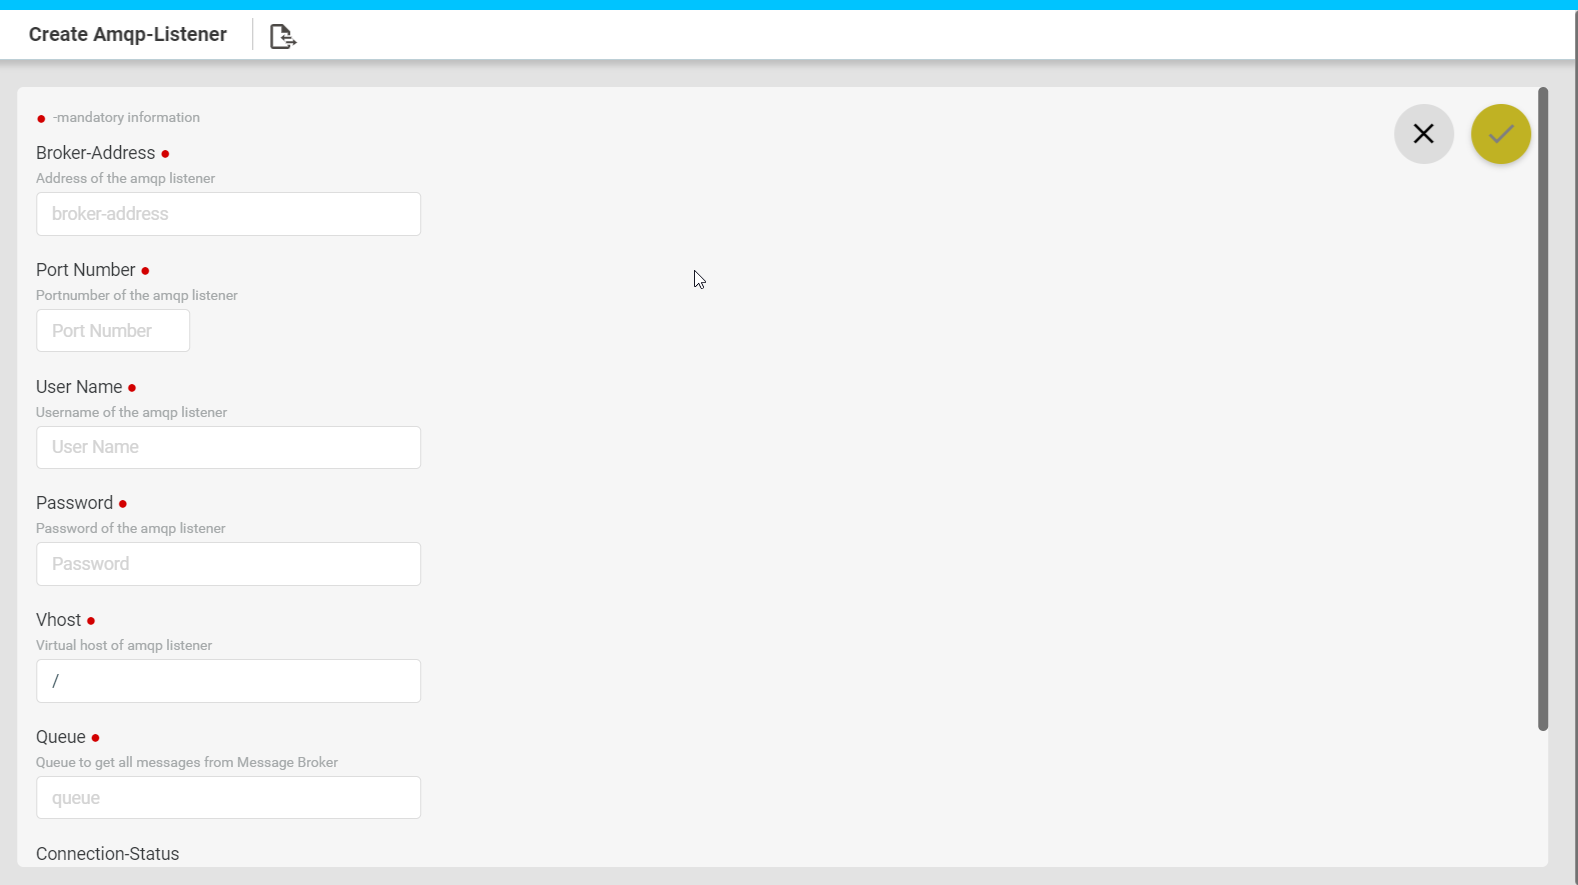
- Broker Address: Enter the IP address of the AMQP server that will receive the notifications from ATOM.
- Port Number: This is the port number that needs to be configured on the message broker to listen into the ATOM notifications.
- Username: Enter the username of the AMQP listener.
- Password: Enter the password to authenticate the AMQP listener.
- vHost: Enter the virtual host name that was created in RabbitMQ
- Queue: Enter the name of the Queue created in the AMQP server (example, RabbitMQ)
- Agent Name: Select the ATOM agent from which the ATOM notifications are generated on a given set of devices. All the notifications created on the device managed by the ATOM agent will be published in the queue.
System Manager
To view the components, microservices and the applications managed by ATOM, navigate to Administration > System Manager
Dashboard
View the graphical representation of the connection between the Applications, Components, and the underlying microservices.
Navigate > Administration > System Manager > Dashboard
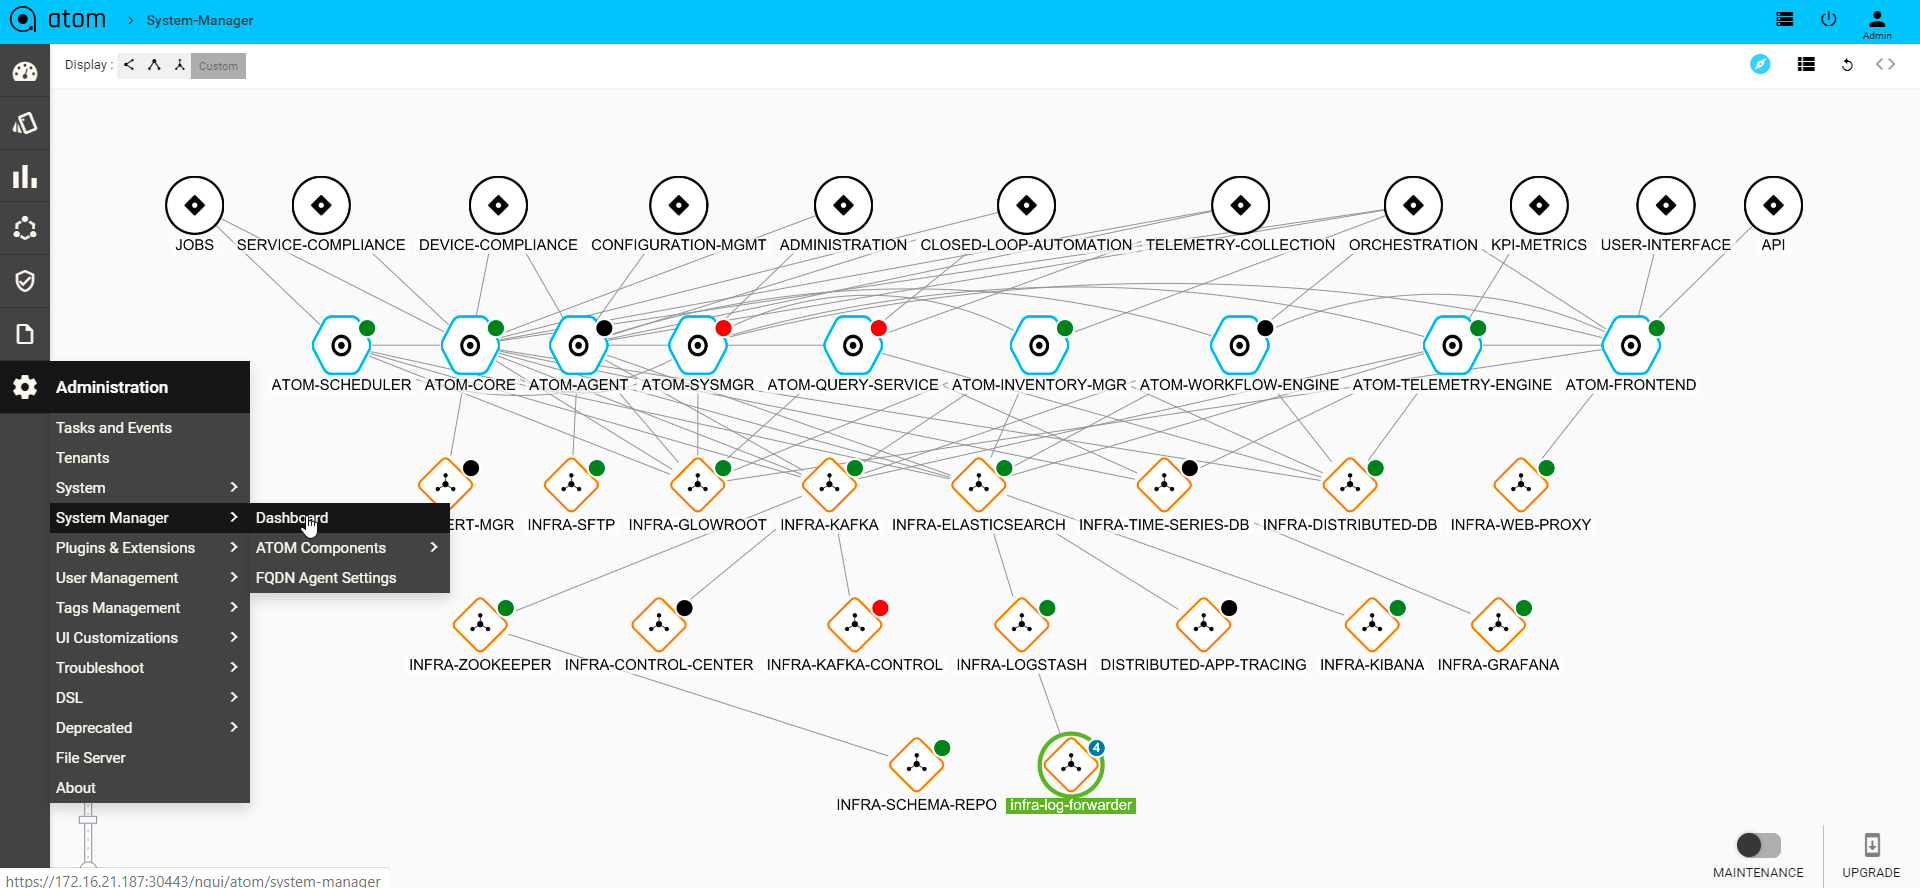
ATOM Components
Navigate > Administration > System Manager > Atom components > Atom components
The components, of ATOM, along with their dependencies are displayed as follows:
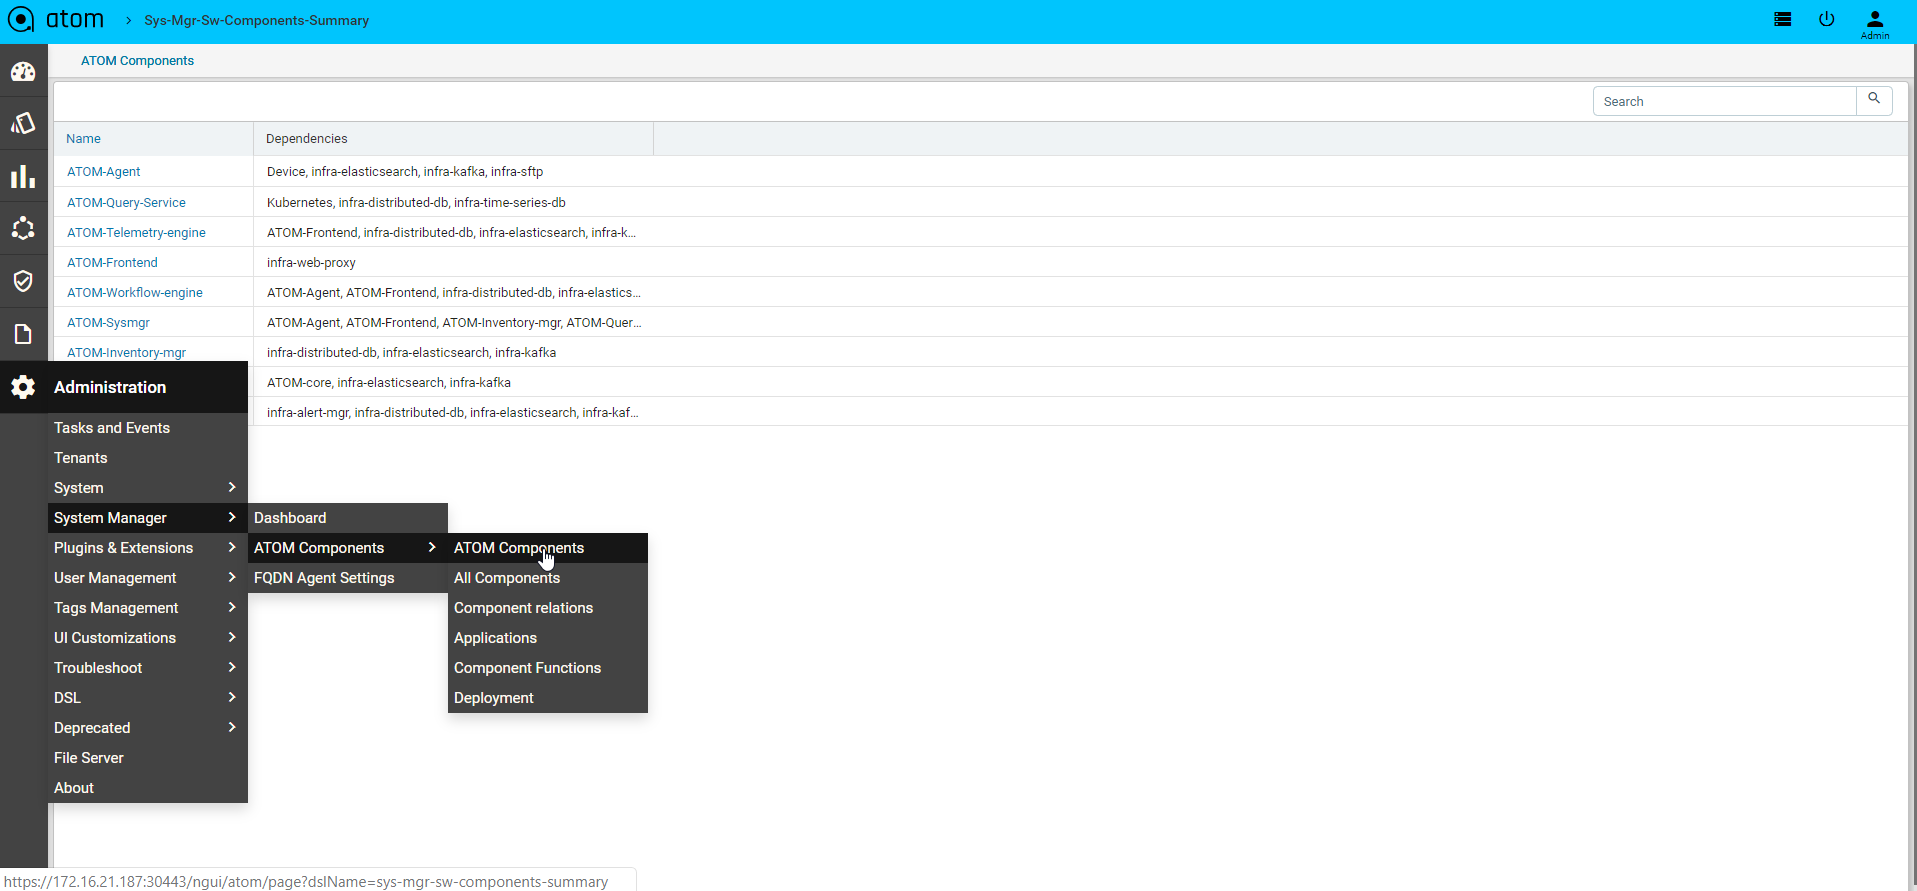
All Components
Navigate > Administration > System Manager > Atom components > All components
The components of the Kubernetes cluster that are not owned by Anuta are displayed as follows:
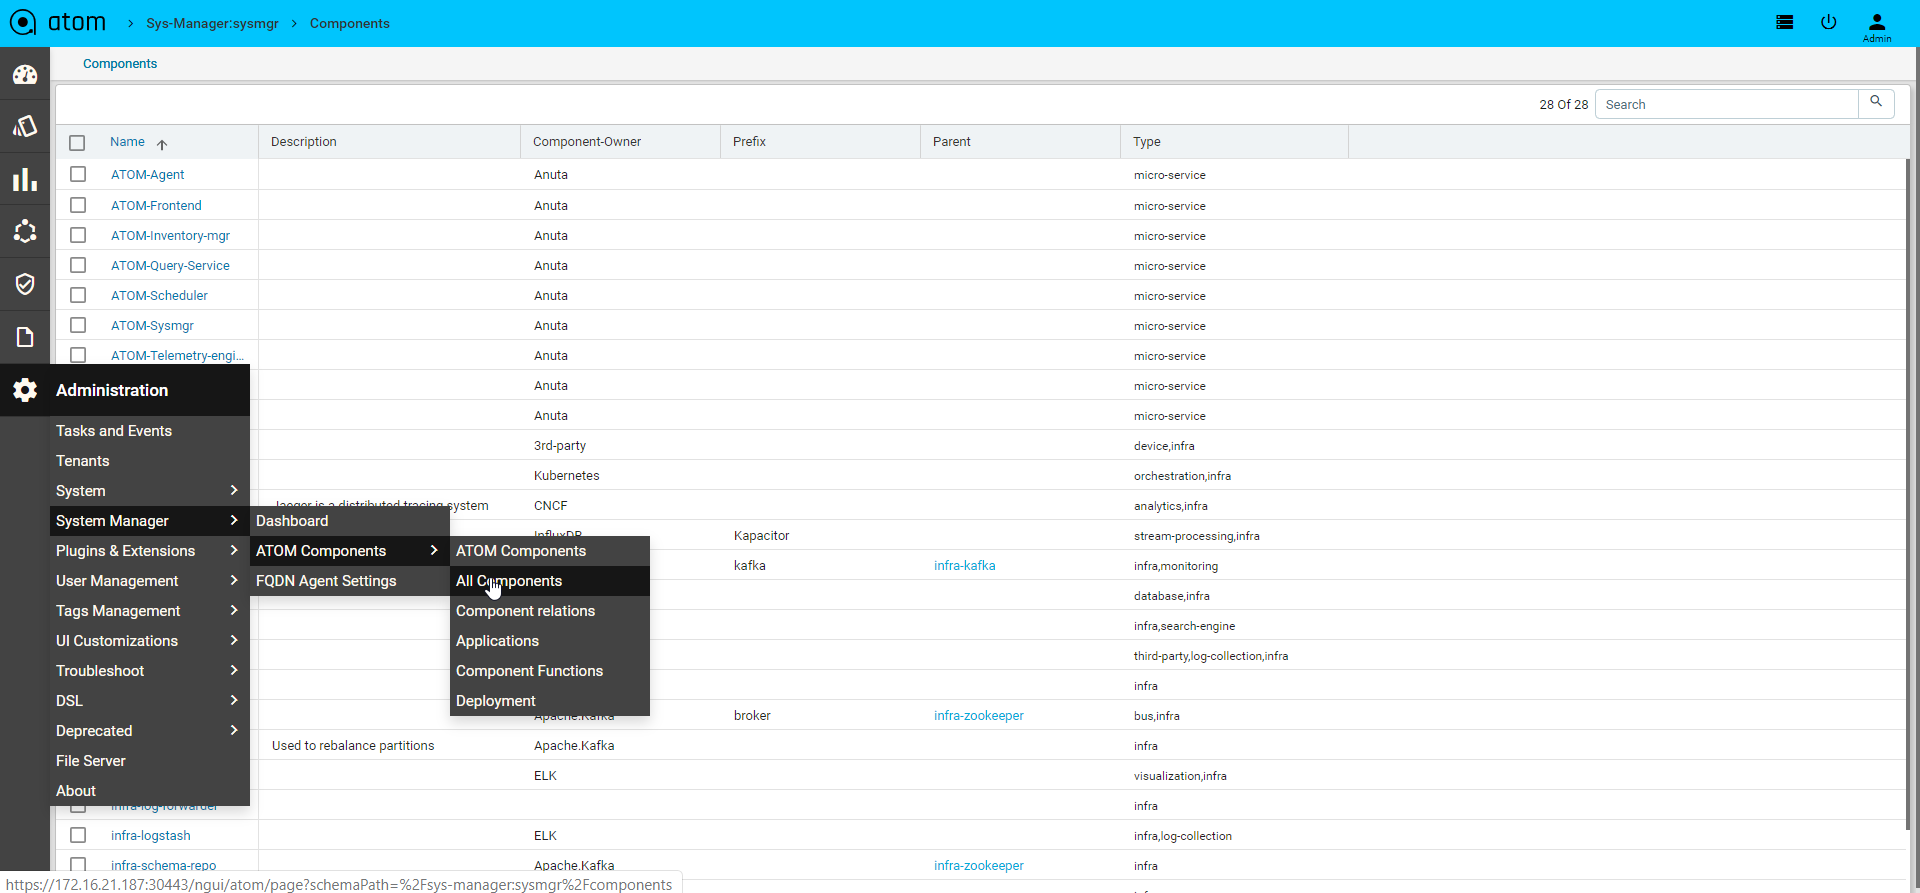
Component Relations
Navigate > Administration > System Manager > Atom components > Component Relations
All the dependencies between the components can be visualized as follows:
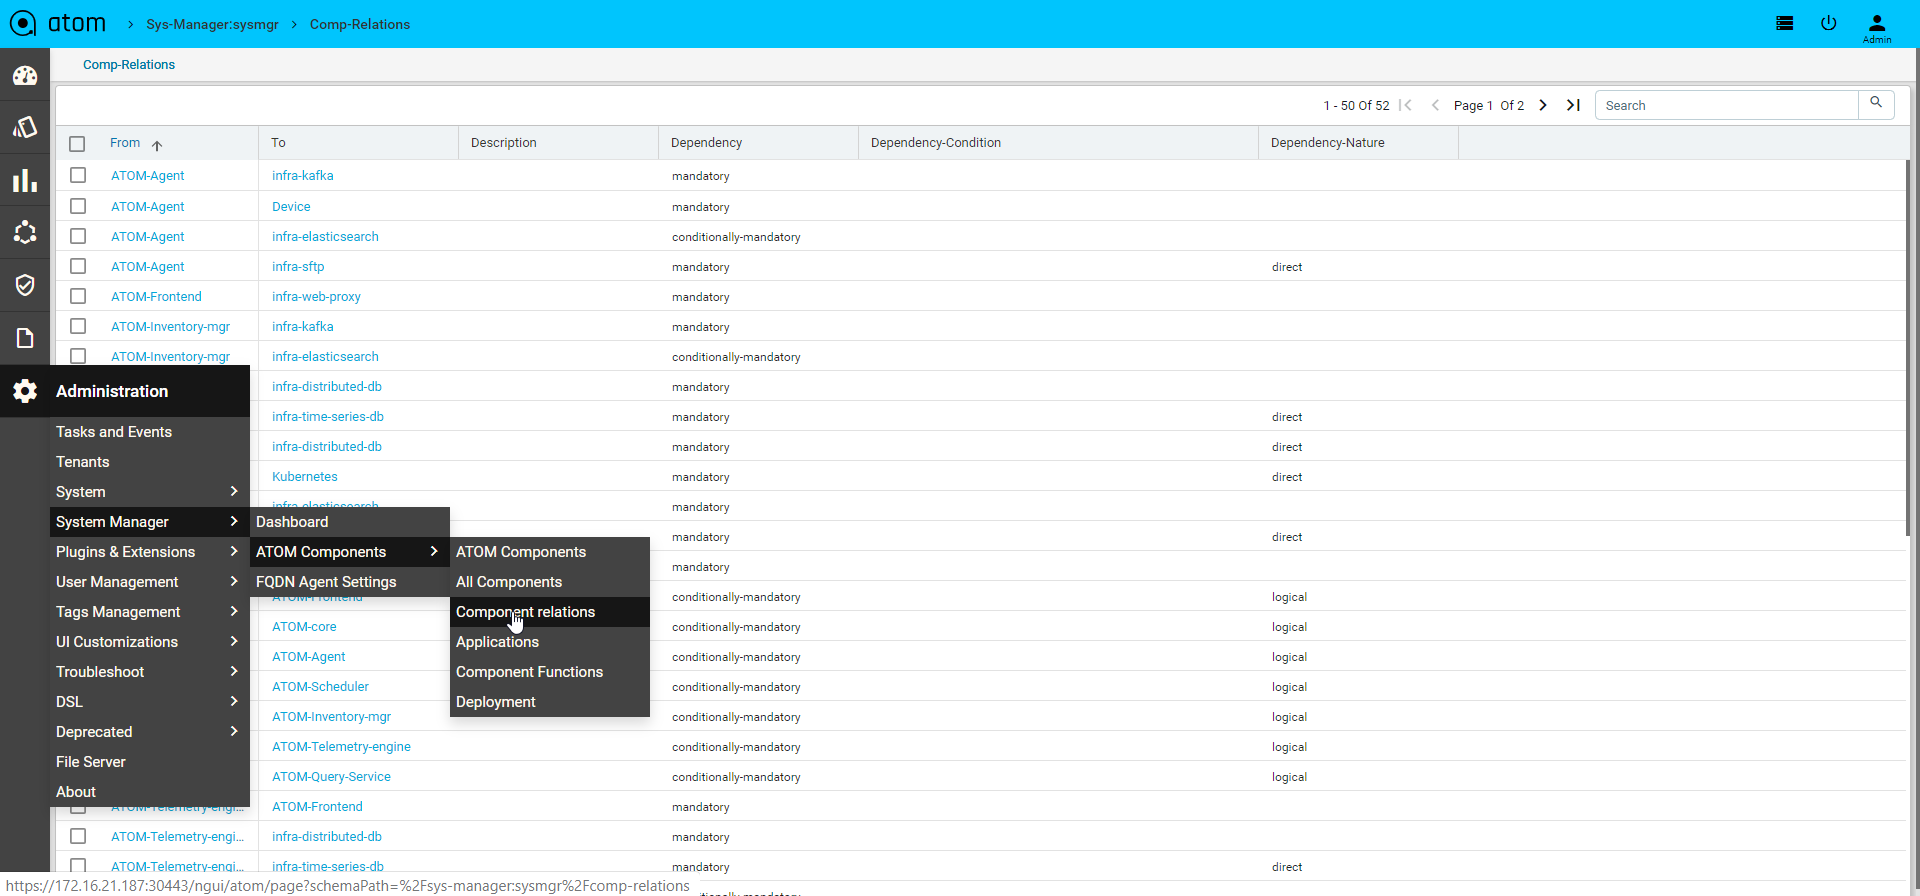
Applications
Navigate > Administration > System Manager > Atom components > Applications
All the applications served by the underlying Components are displayed as follows:
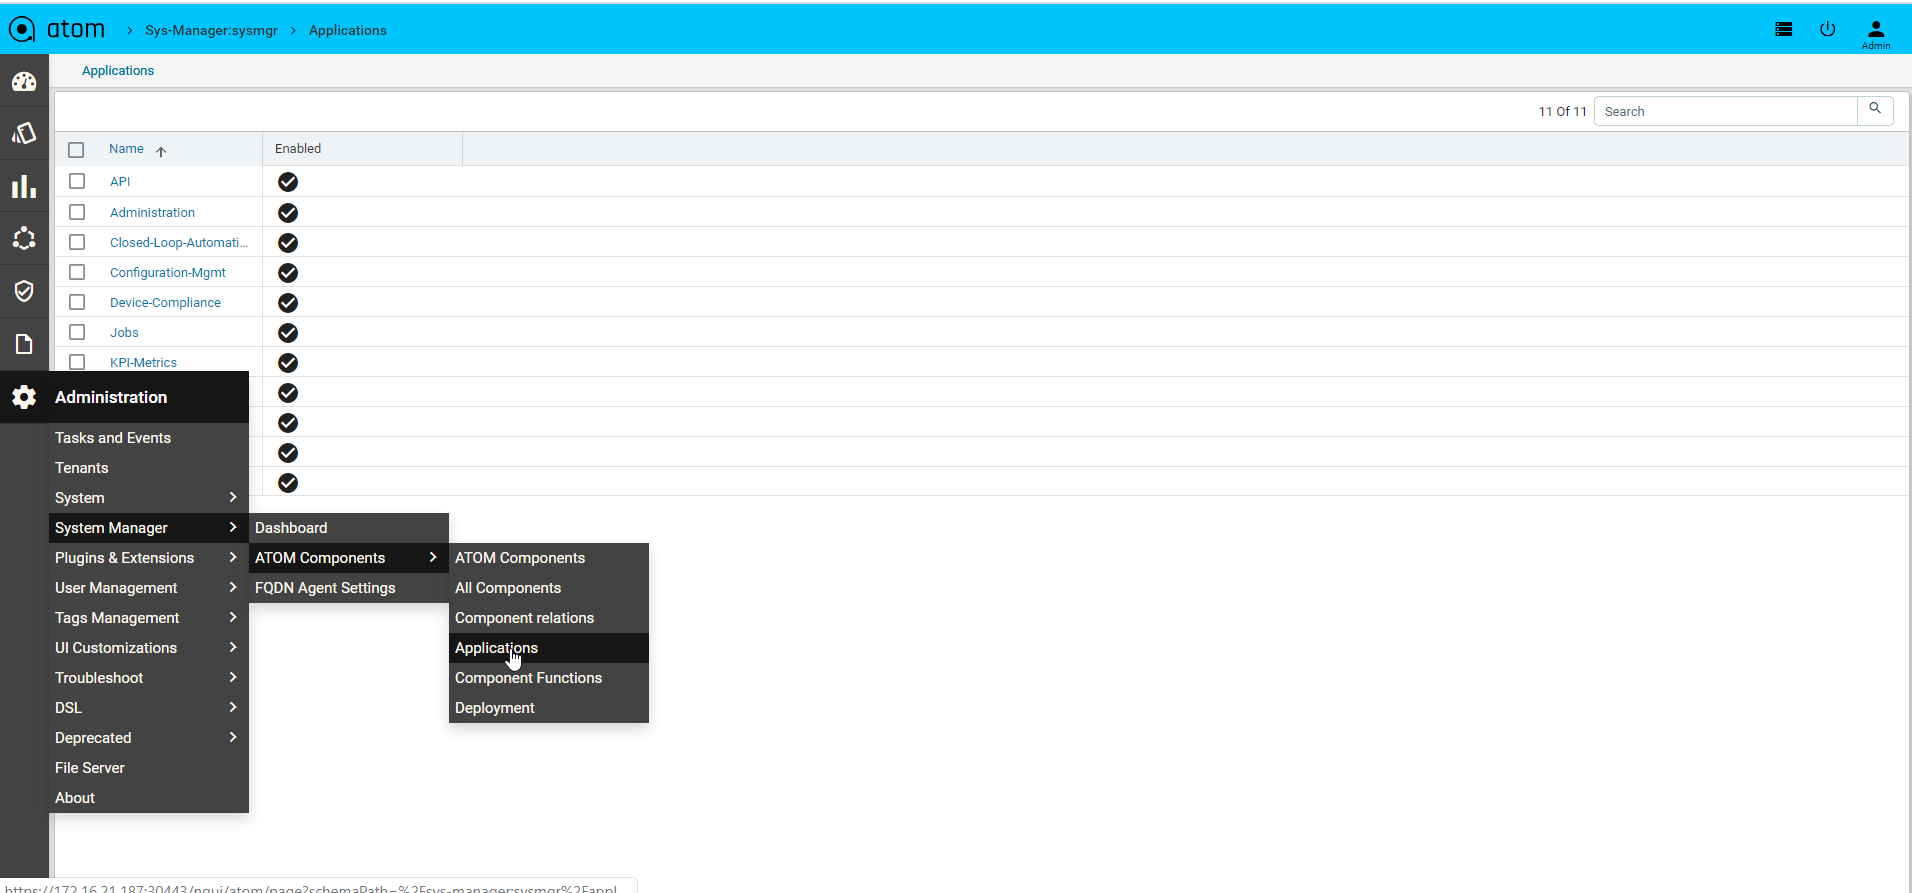
Component Functions
Navigate > Administration > System Manager > Atom components > Component Functions
The association of the components between the applications can be visualized as follows:
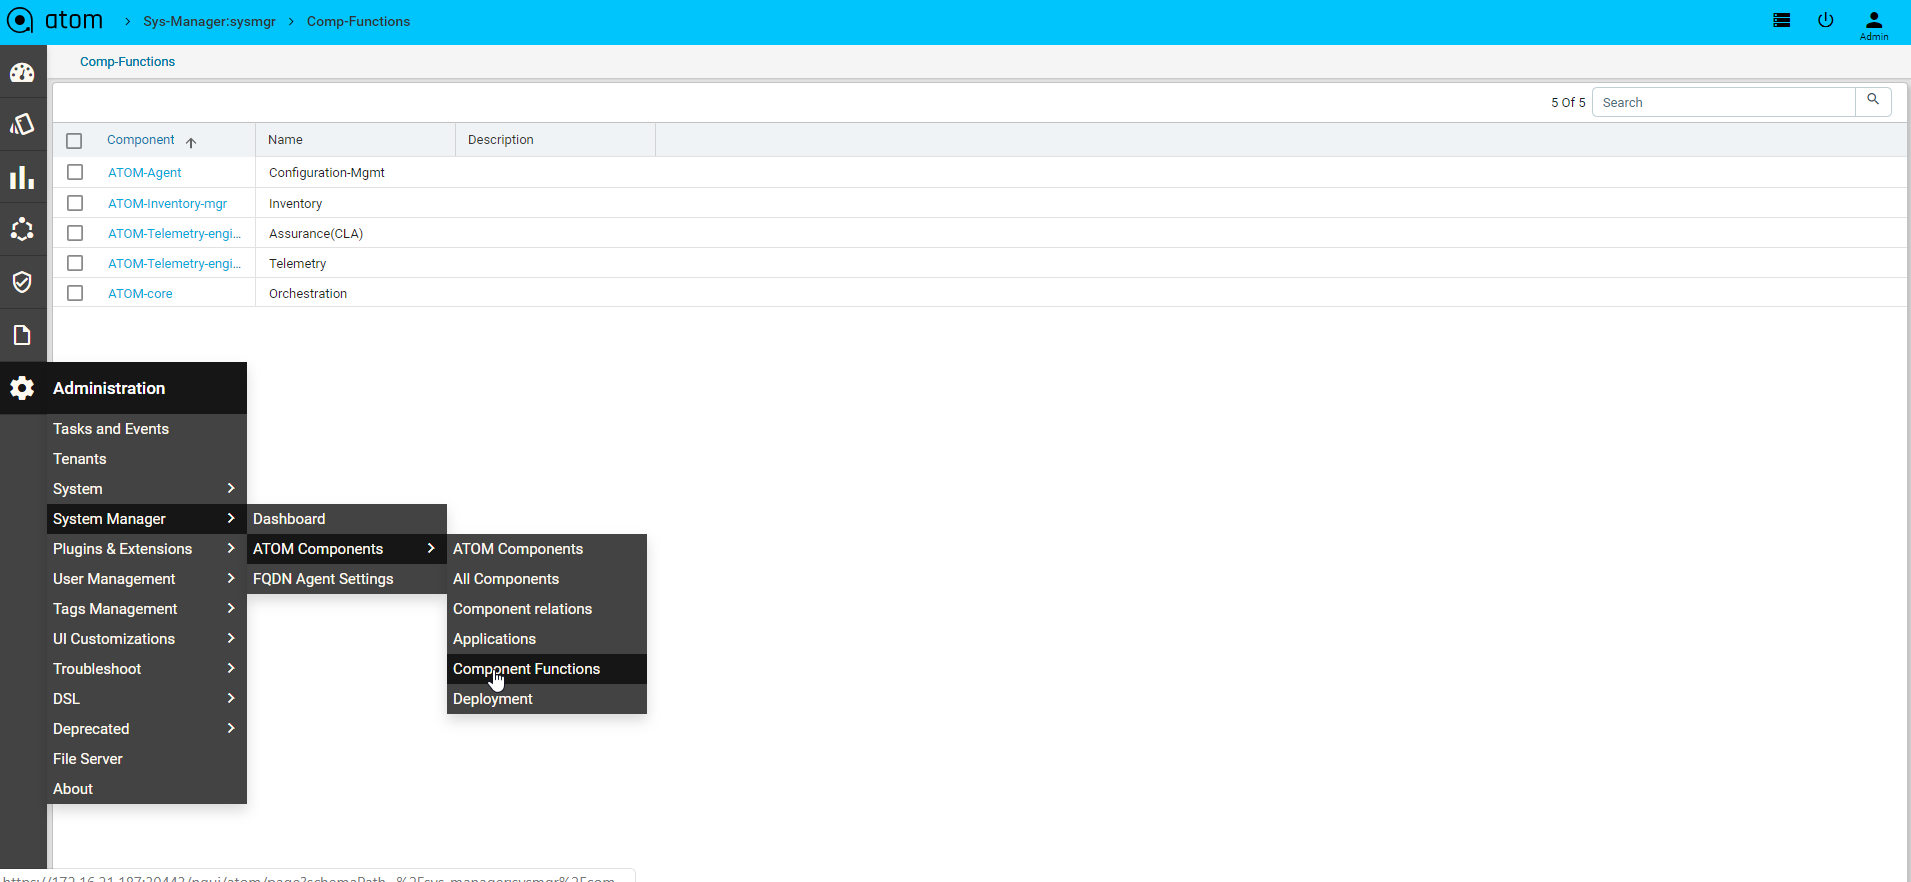
Deployment Functions
Navigate > Administration > System Manager > Atom components > Deployment Functions
The following deployment summaries to be displayed
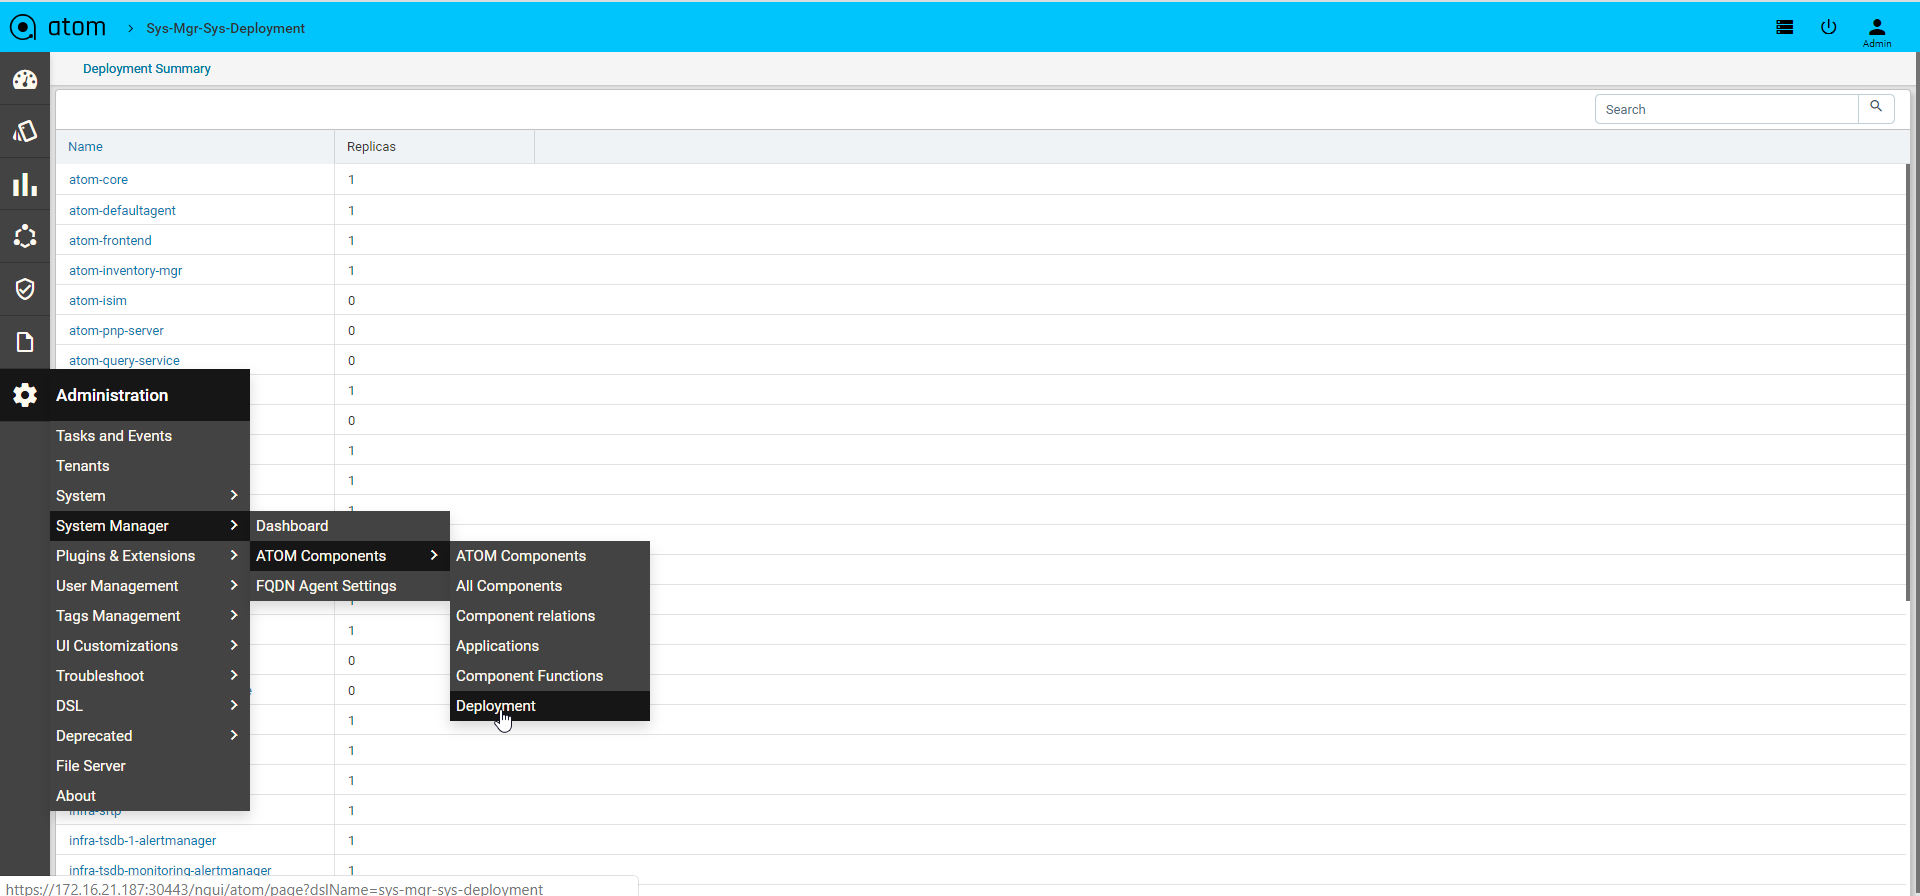
FQDN Agent Settings
Navigate > Administration > System Manager > FQDN Agent Settings
1.No need to restart any pod, it should discover any endpoints.
Command : kubectl edit cm -n kube-system coredns
2.Content added as below:
anutacorp.com:53 {
errors
cache 30
forward . 172.16.100.5
}
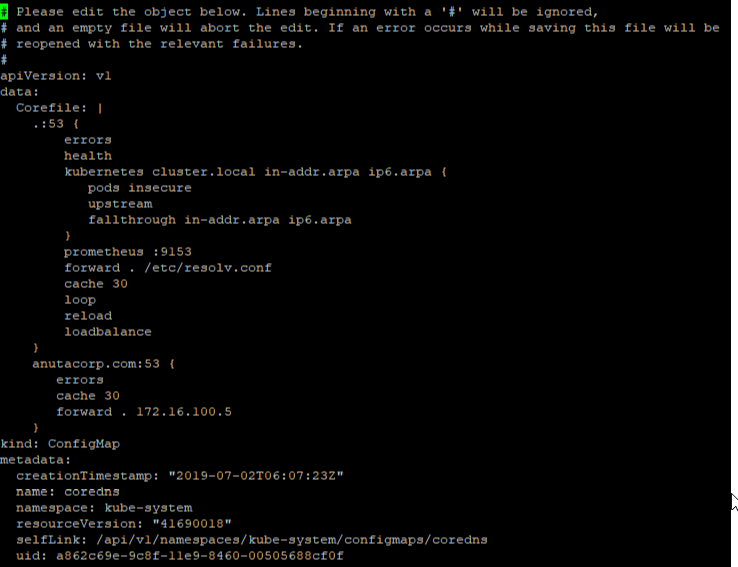
Go to Administration/System Manager/FQDN Agent setting for pattern
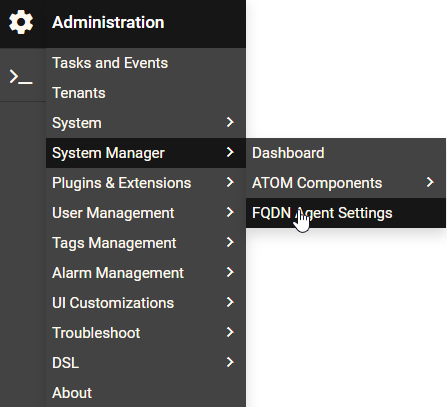
Click Add Symbol and Select Default-Domain-Agent and give proper Pattern & Priority
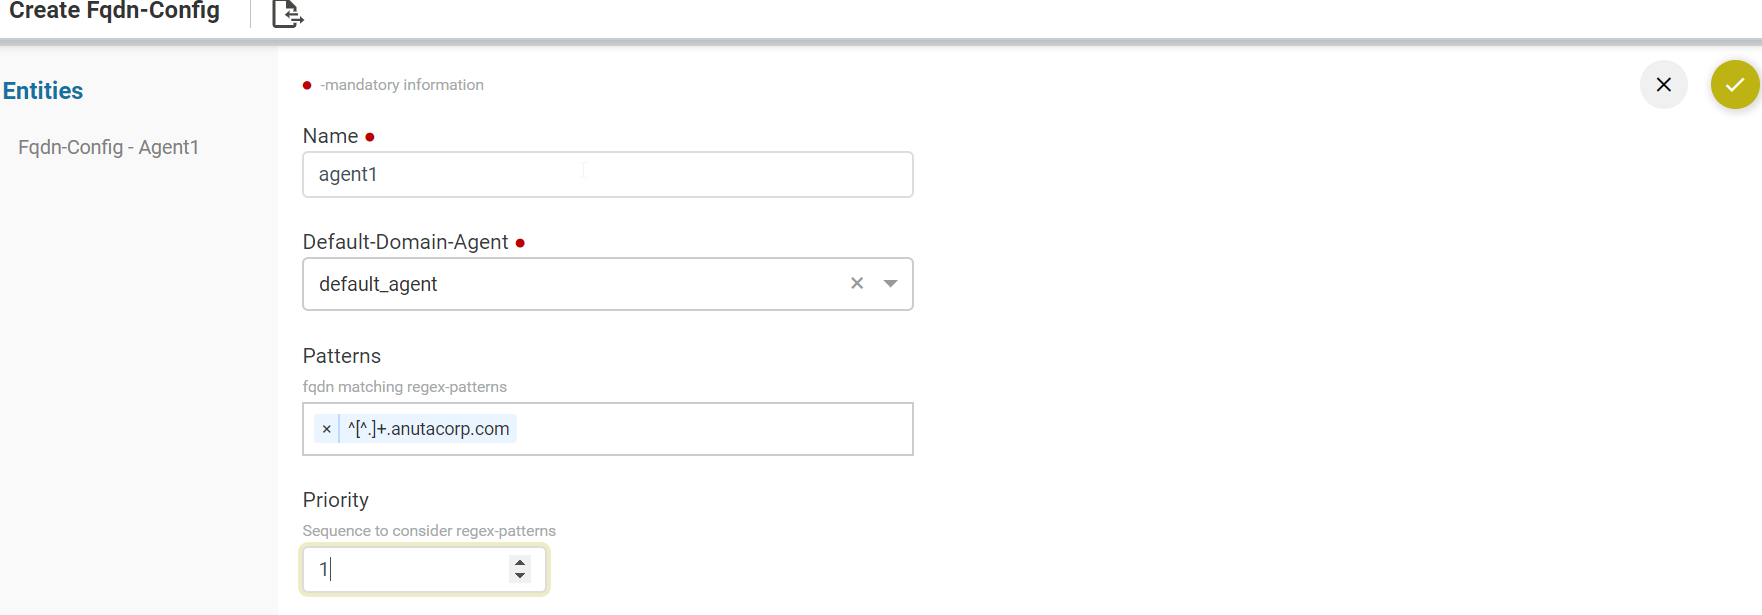
After creating FQDN then go to Entities/Ip-Ranges as shown.
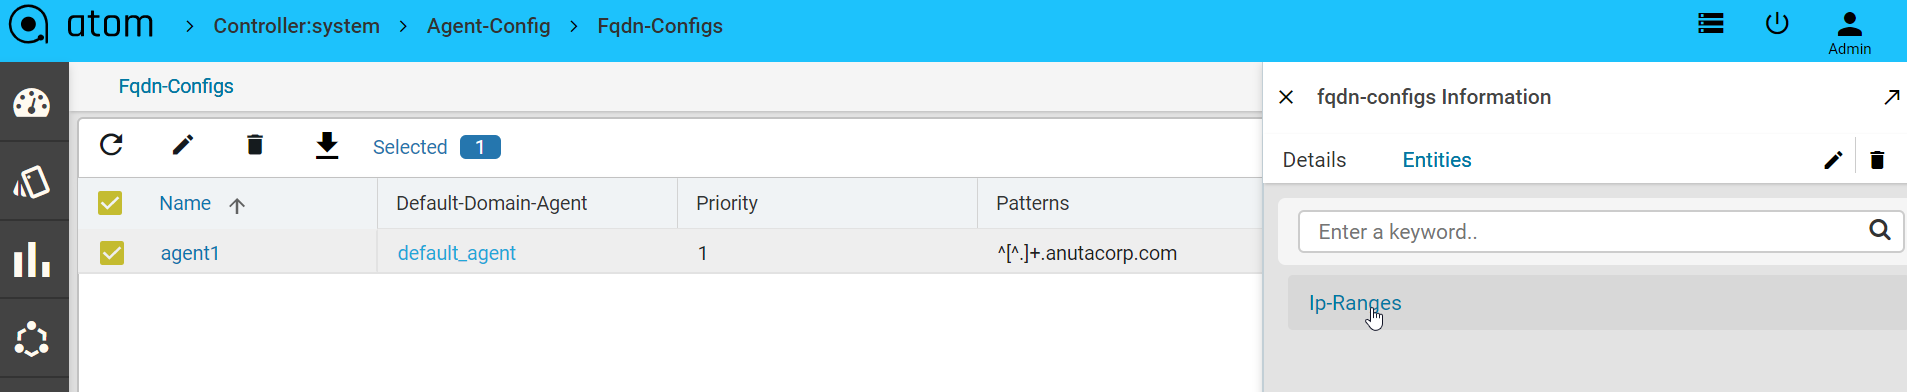
Provide valid IP Ranges and select agent
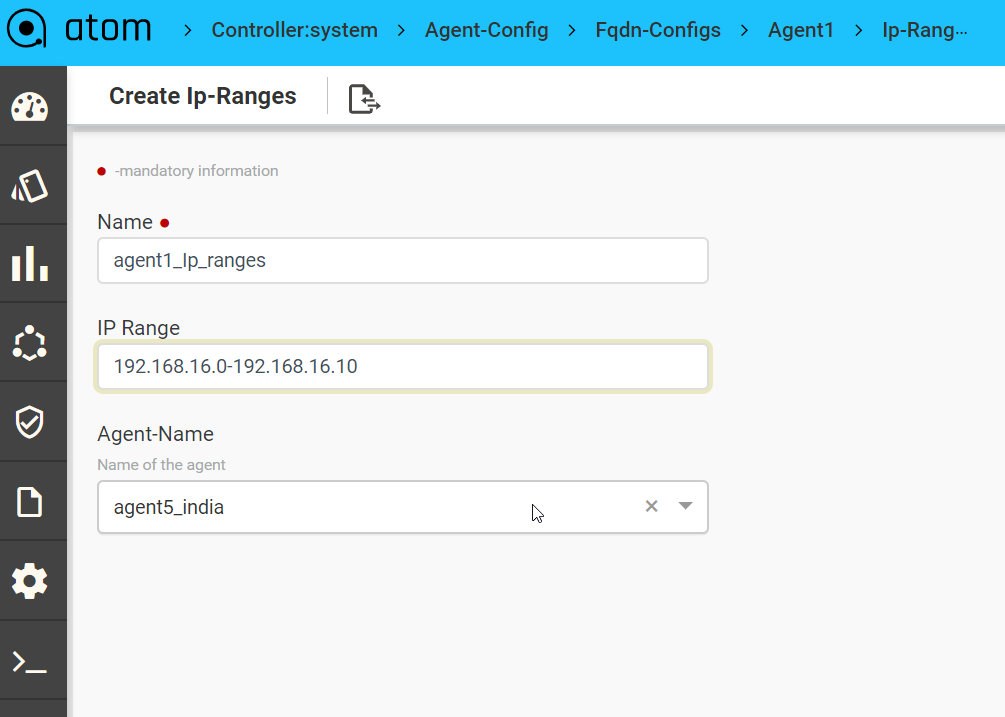
Go to Devices and click add symbol and Provide FQDN-Name to resolve FQDN
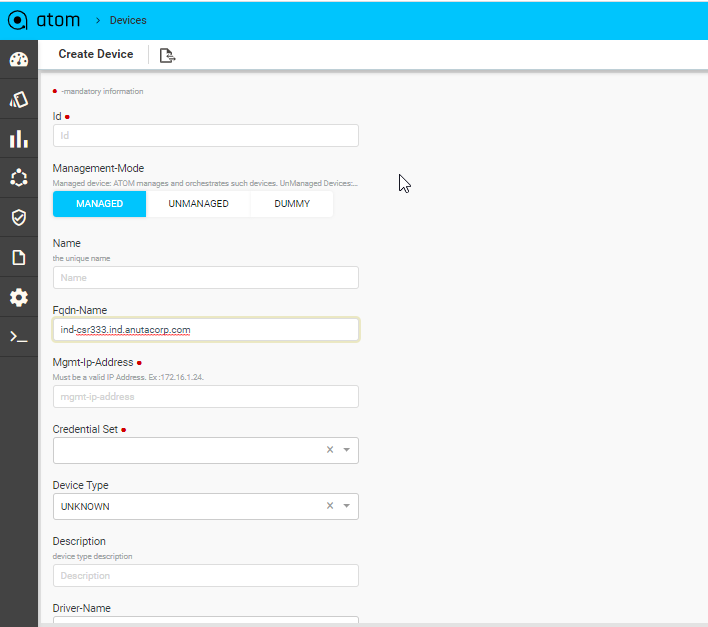

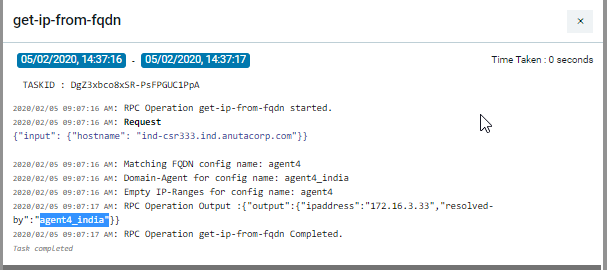
Plugins and Extensions
By utilizing the normalized device abstractions maintained in data stores written in YANG maintained in ATOM, the customers can write their own device models and applications to meet their specific operational needs, thereby utilizing the extensibility of ATOM.
The device and service packages are loaded as bundles or plugins to the ATOM container thereby making them modular. The packages can be installed, updated, or deleted without disrupting the operation of the device.
In addition to modeling the devices and service, you can model the features or network functions required to build a network service. These features thus modeled appear as icons in the feature palette of Service Designer pane of ATOM. The newly added features along with the included associated services can now be used to design the service in ATOM.
Packages
ATOM is packaged with many predefined device packages to enable you to work with many vendor devices. ATOM also provides capability to update the existing device packages and ability to add new device packages
A Device Model contains inventory models, communication model, and notification model that are packaged and uploaded to ATOM. A device package consists of models, a vendor ‐specific configuration data for all the different devices.
For details about what constitutes a device package and how to write it, refer to examples cited in the guide, “ATOM Platform Guide”.
A Service package contains the services models, service yang files and metadata information. For more information about Service Modeling, refer to examples cited in the guide, “ATOM Platform Guide”.
Package Explorer
Users can manage and get the information of the packages that are currently available in the system. The packages that were uploaded and loaded can be viewed in minio UI.
Navigate to Administration > Plugins & Extensions > Package Explorer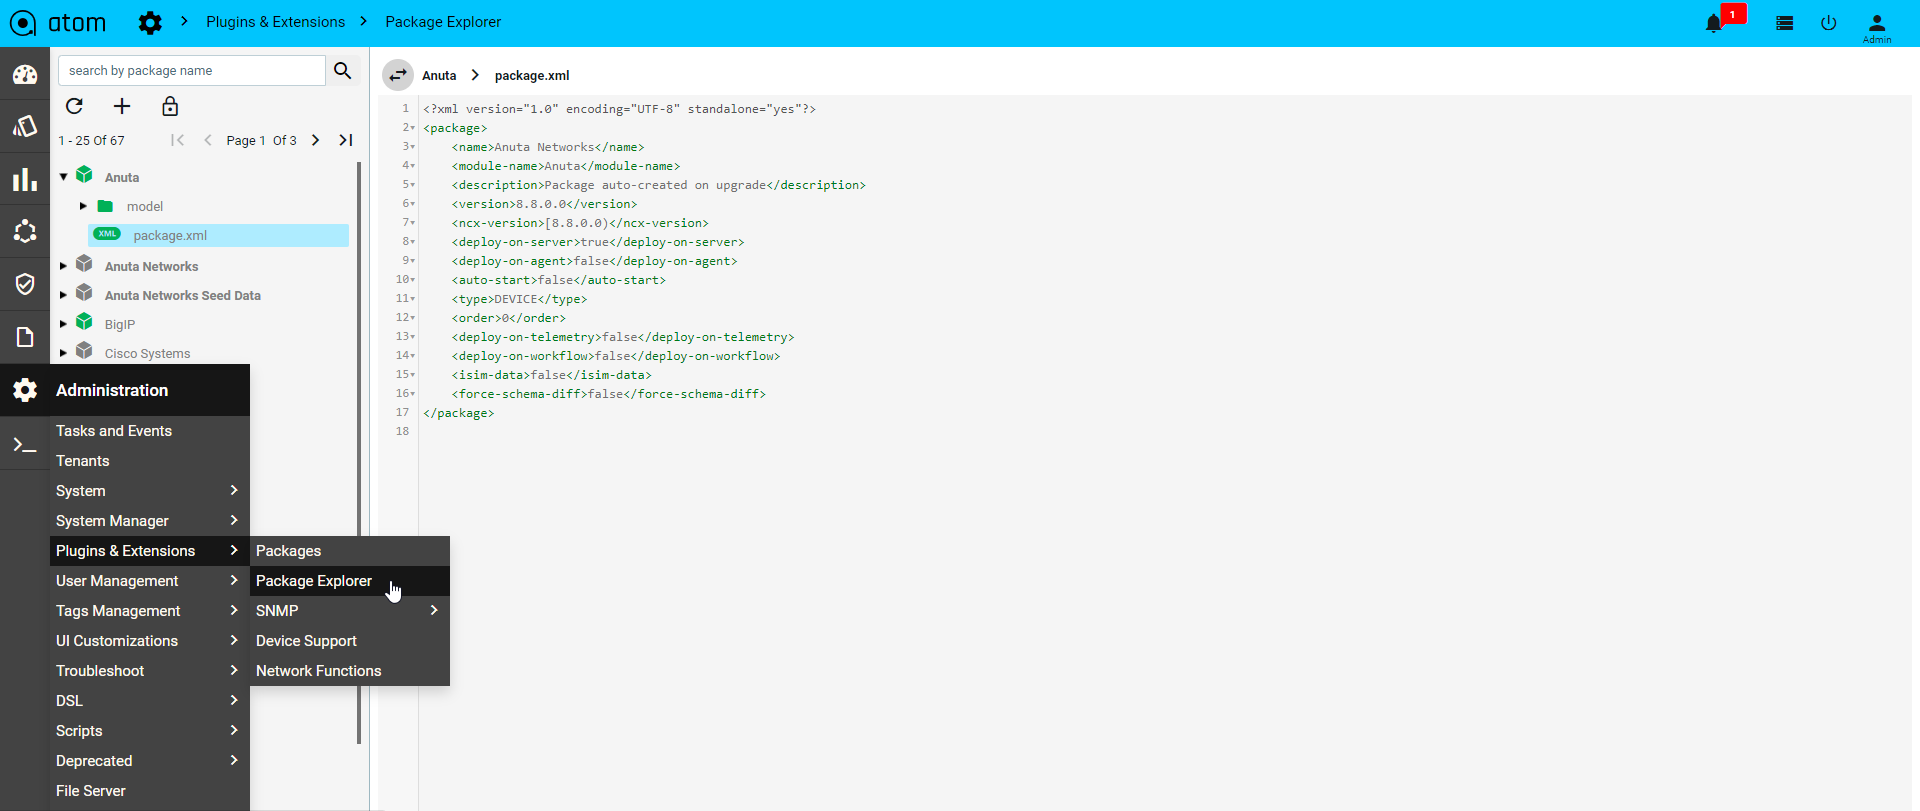
SNMP
Navigate > Administration > Plugins & Extensions > Package > SNMP > SNMP Mibs >Upload
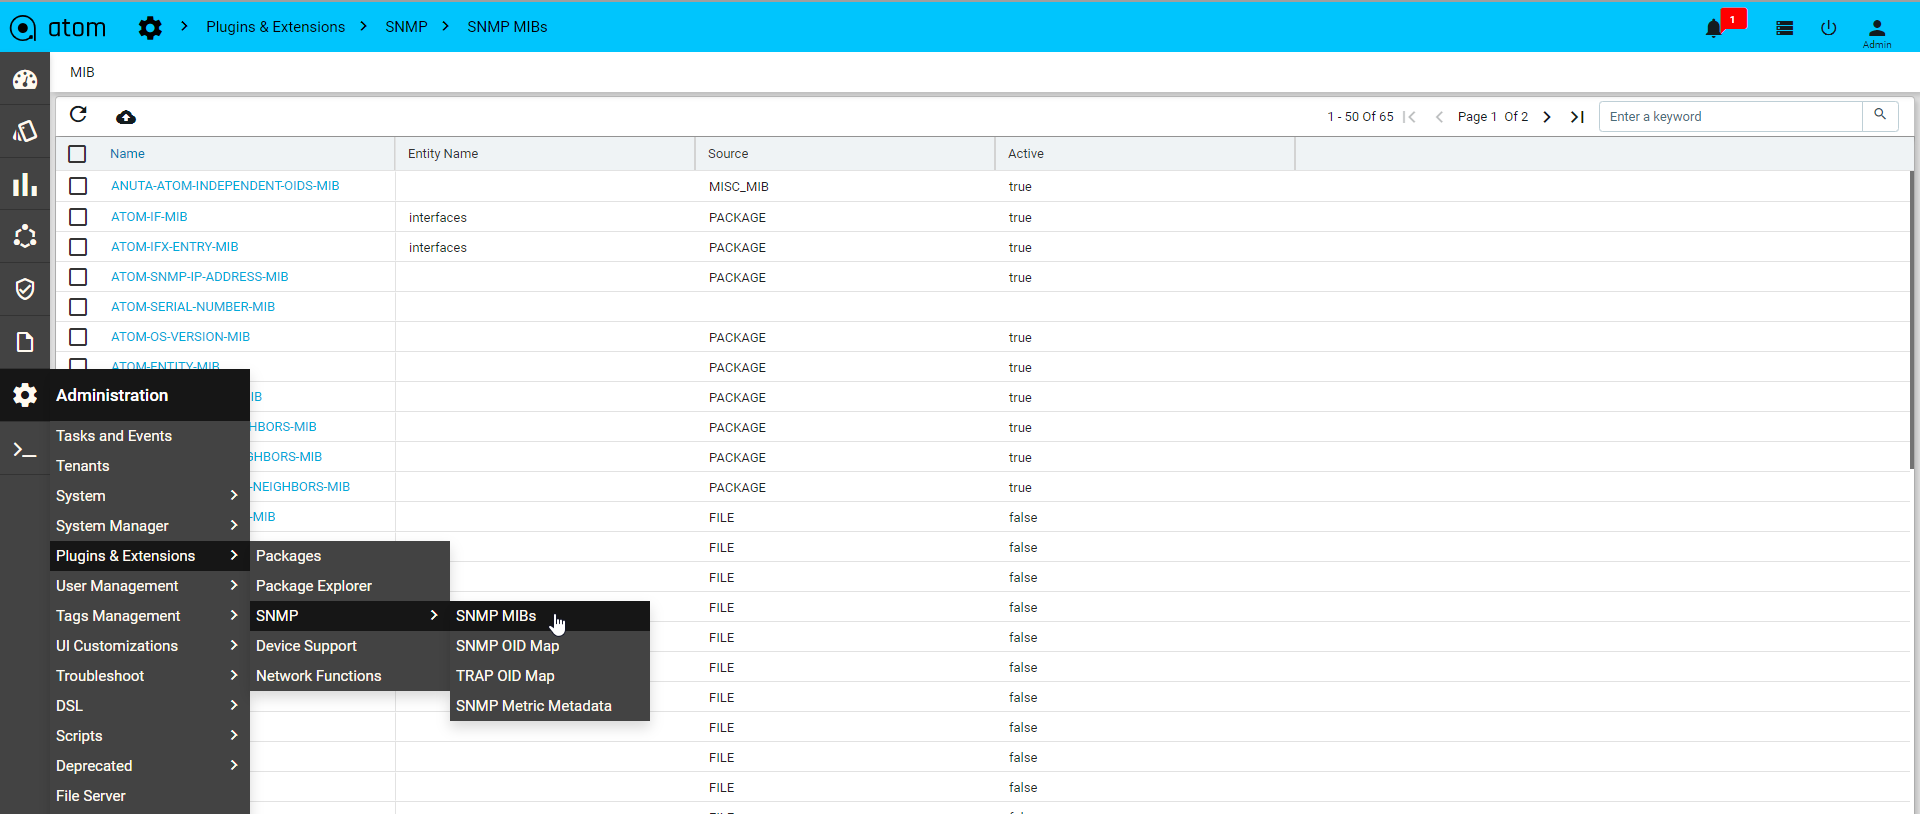
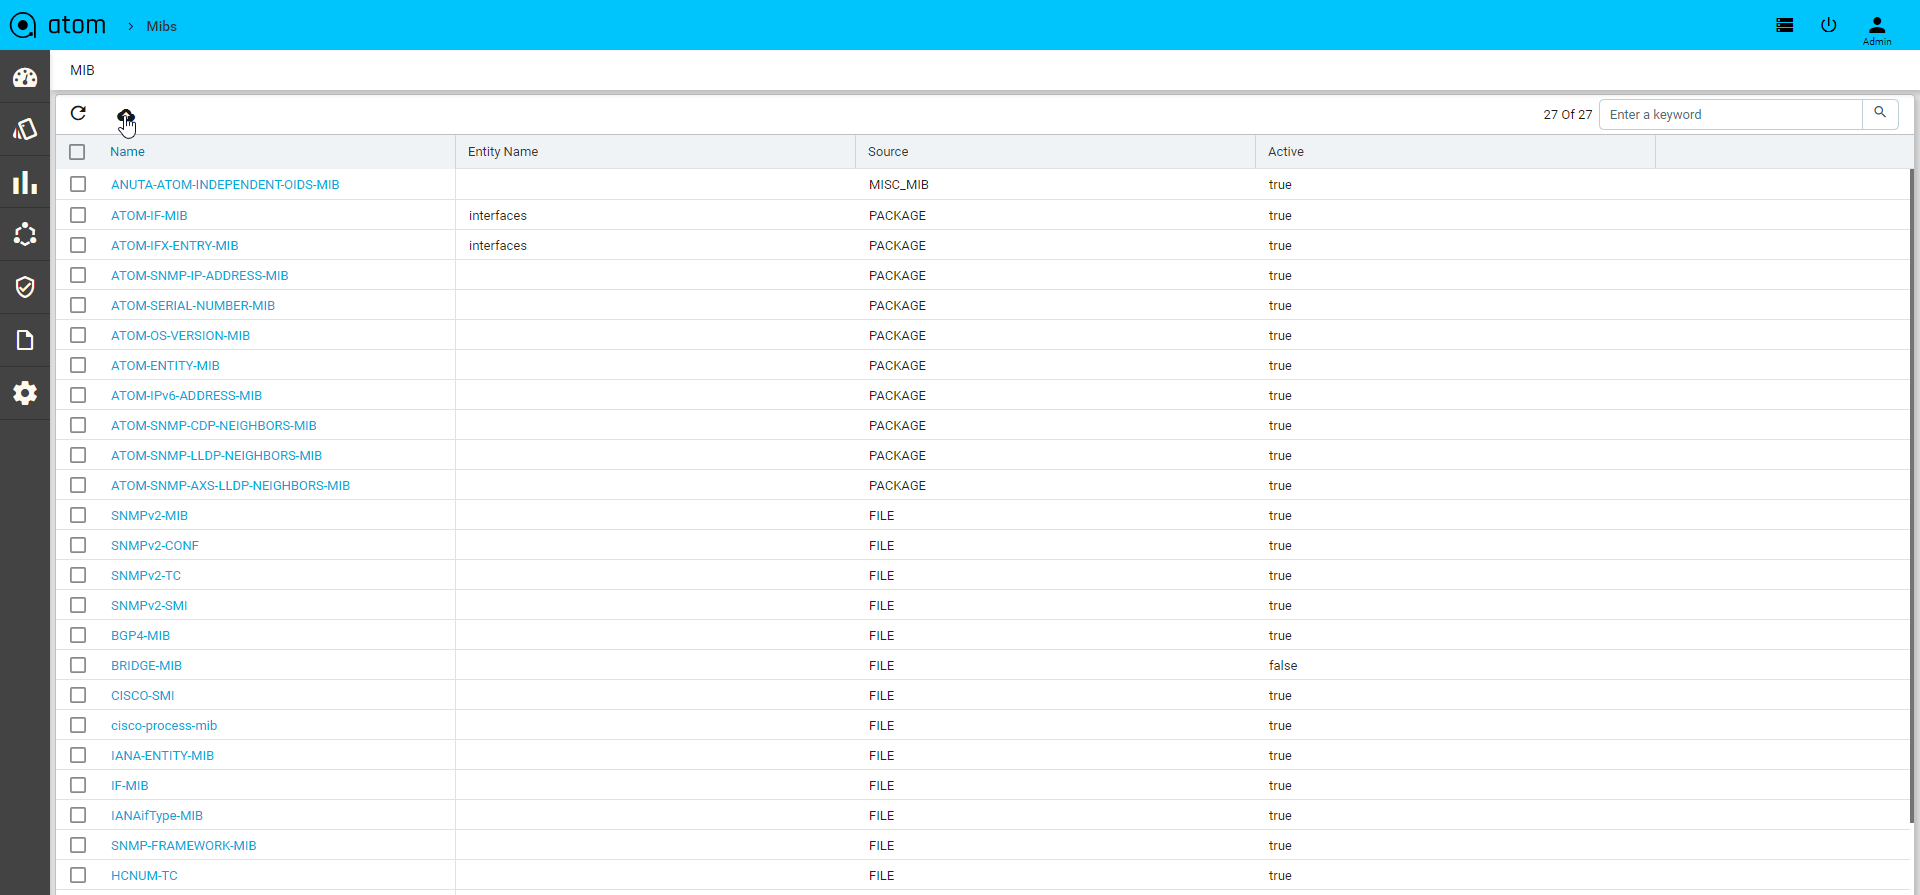
Navigate > Administration > Plugins & Extensions > Package > SNMP > SNMP OID Maps > Add
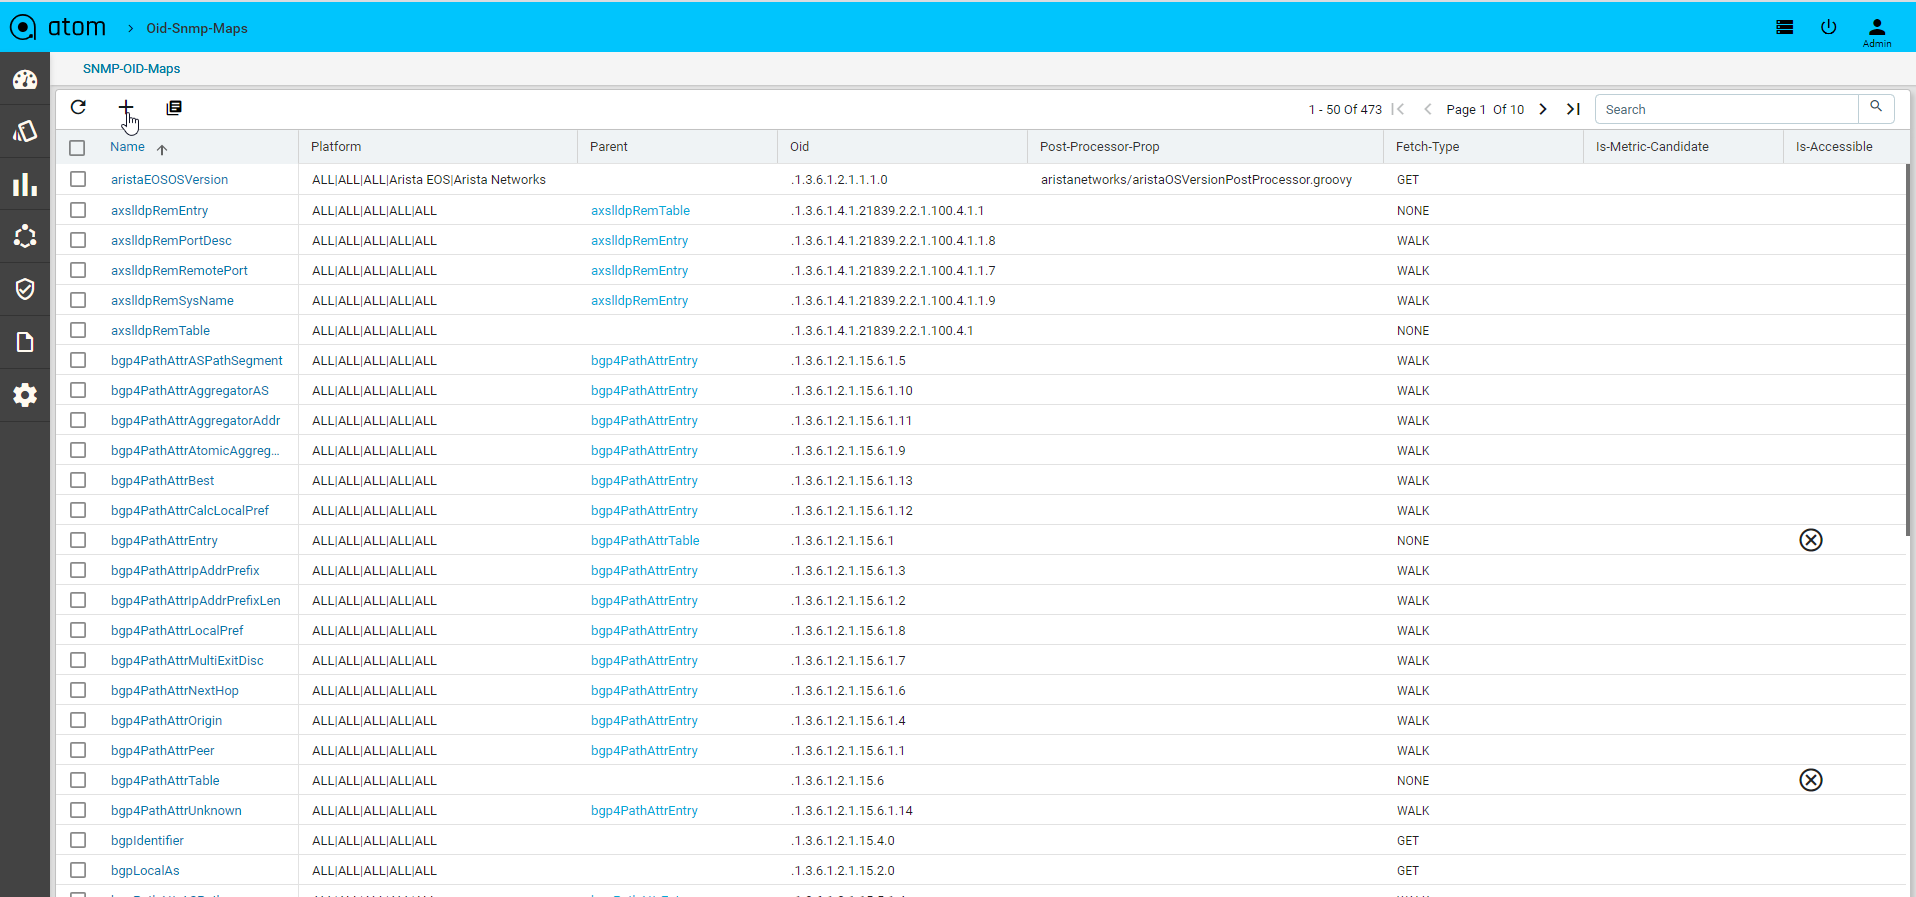
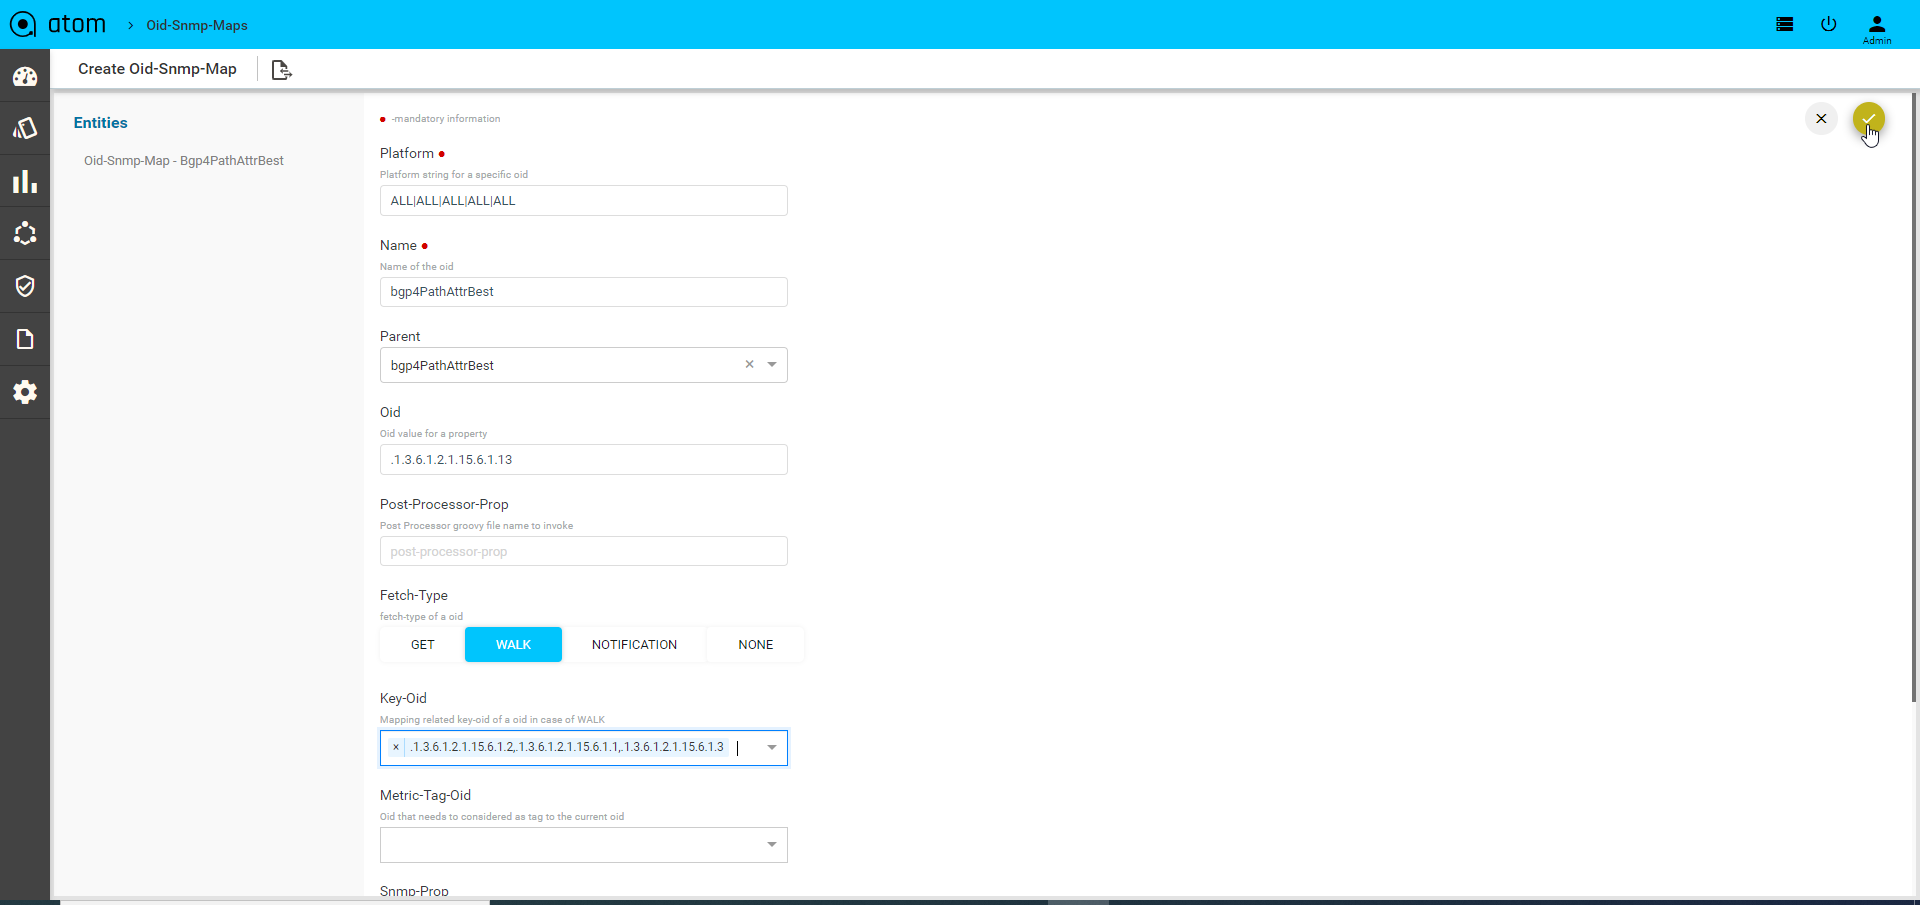
Navigate > Administration > Plugins & Extensions > Package > SNMP > SNMP Metric Metadata > Add
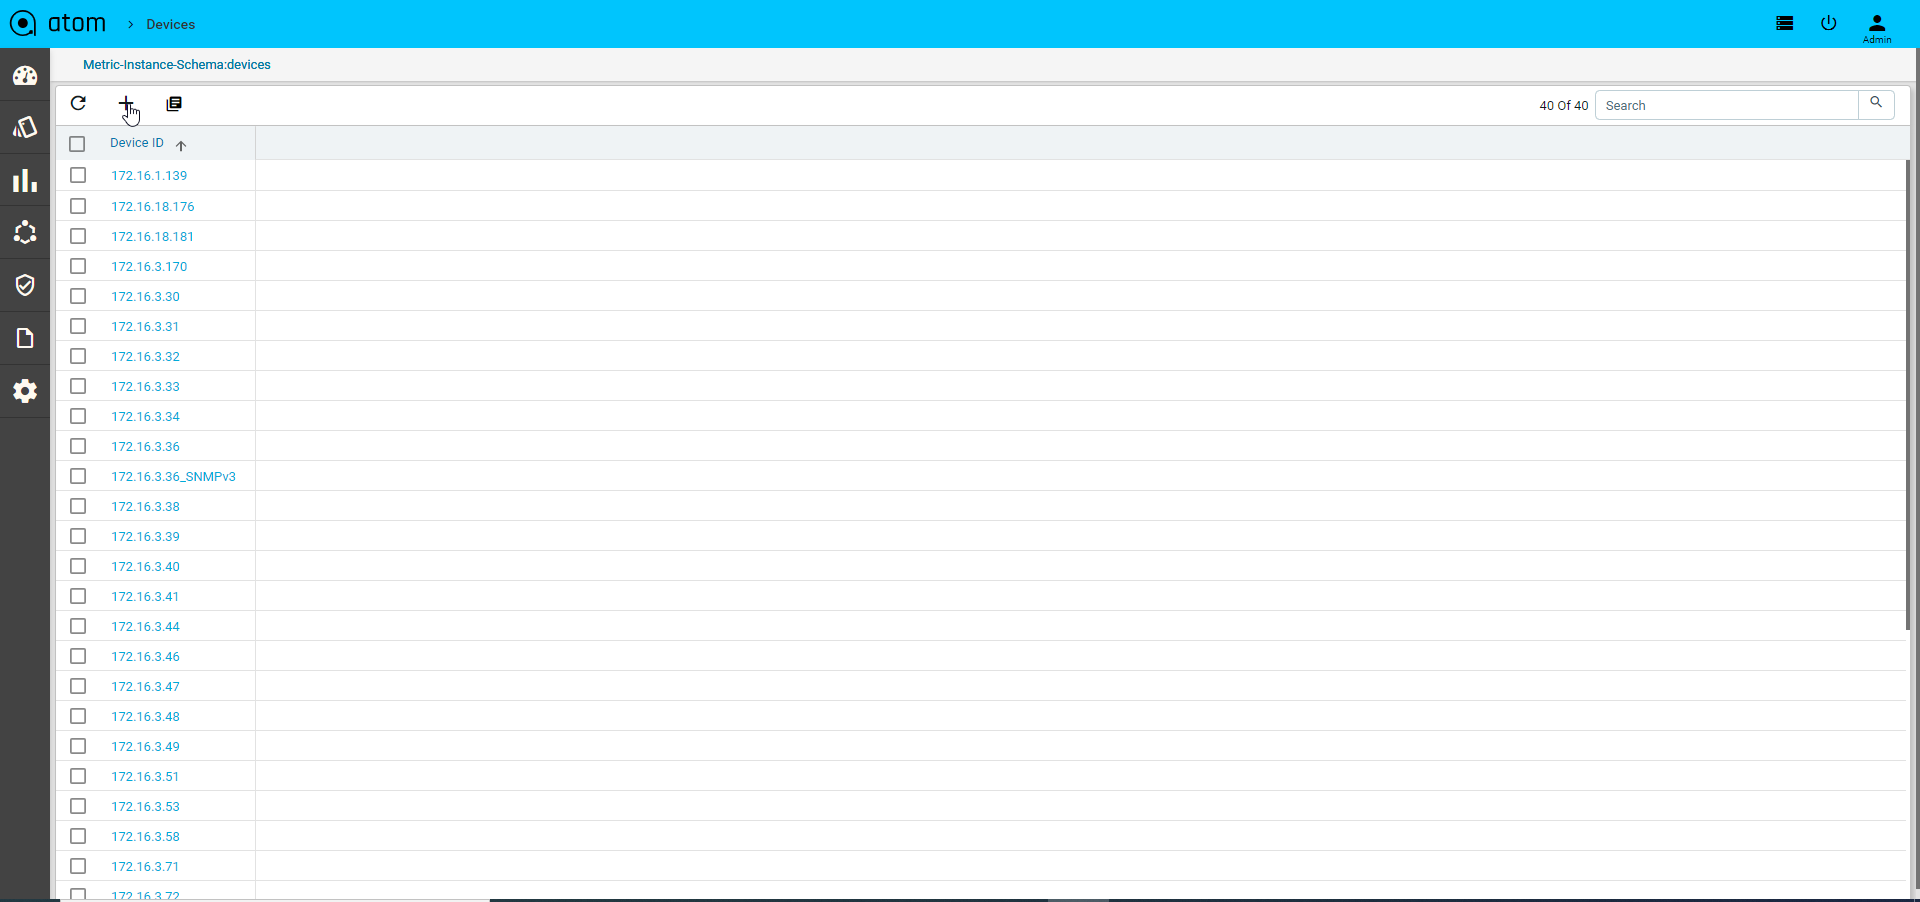
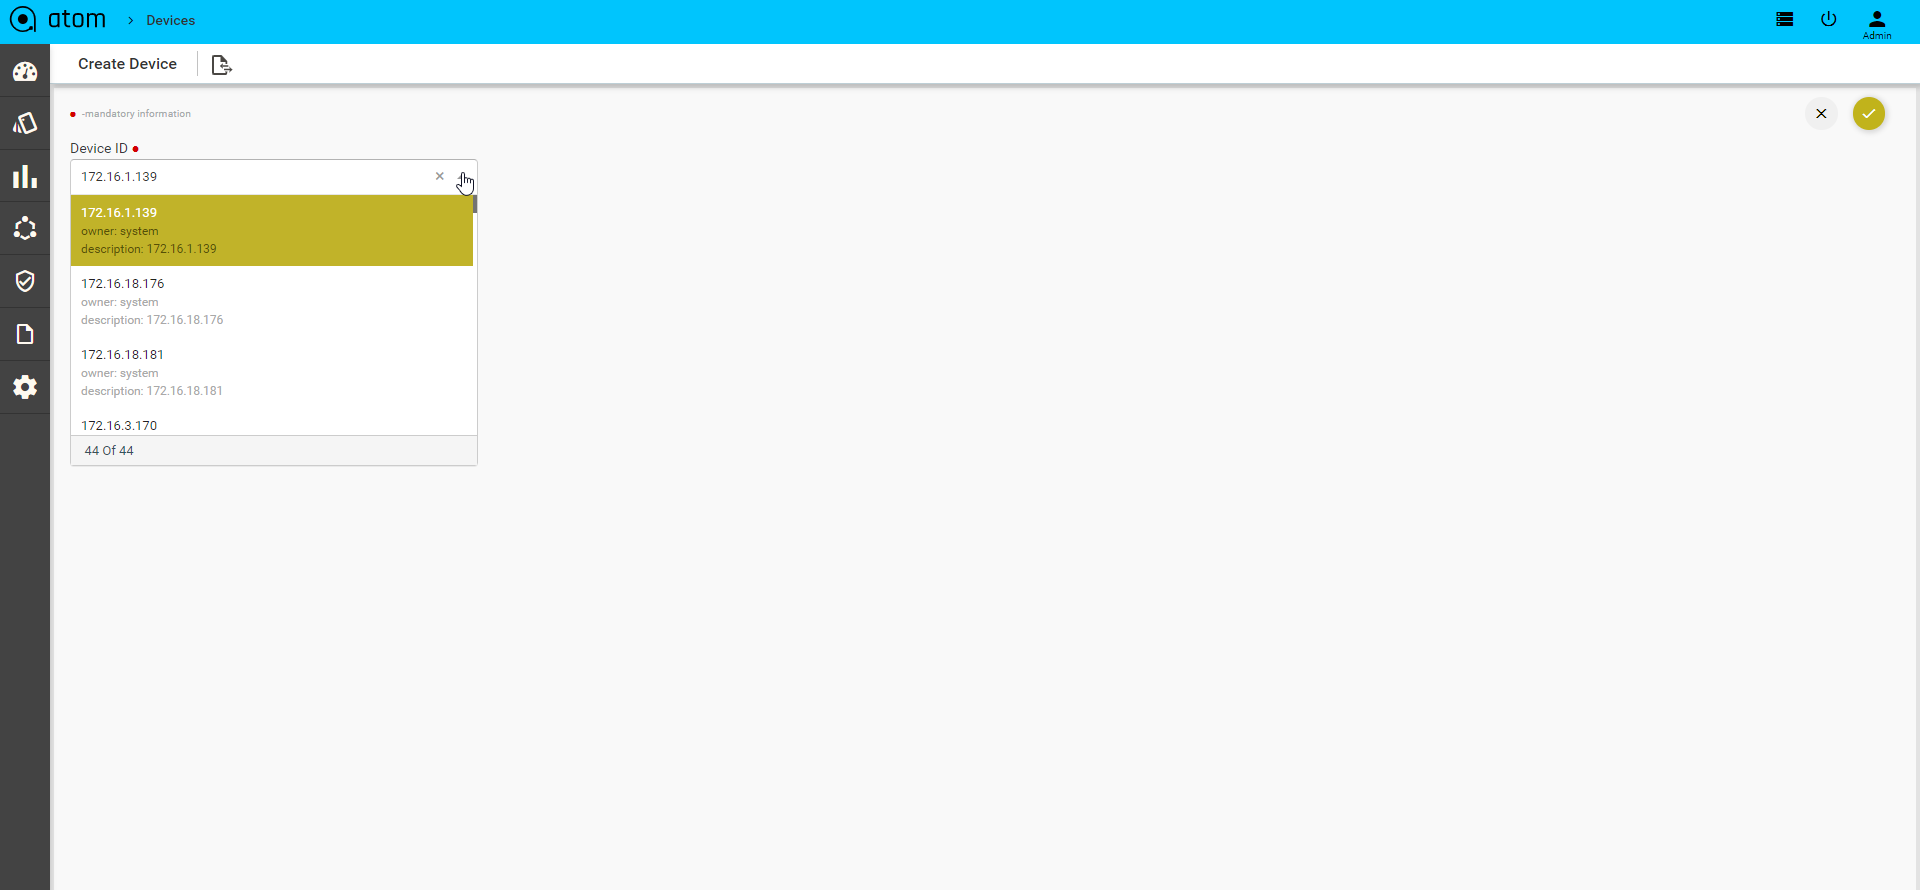
Device Support
Device Support view allows users to create a new Vendor, Device Type, Device Family, OS Type, Device Capabilities, Terminal Handling Properties etc.,
Managing Tenants
The administrator can make use of ATOM’s multi tenancy capability to share IT resources cost‐efficiently and securely by creating Tenants. The Tenants share common infrastructure, yet utilize a defined set of highly secure services, with complete isolation from other tenants. The resources managed by ATOM can be securely shared among multiple applications and tenants (businesses, organizations, etc.) that use the resources of the datacenter.
Overview of Multi Tenancy
Mulltitenancy feature is enabled in the system as a result of which every object managed by ATOM can be owned by an admin and shared with multiple users (tenants) simultaneously.
Aided by rules and roles that can be created in ATOM, the administrator can either assign or restrict access to the resources (resource pools, sites, locations, IPAM, devices) managed by ATOM.
All the created resources in ATOM are allocated to the system, the default admin user who is the owner of the resources. These resources managed by ATOM are available to all the Tenants in the system. The administrator can now share the system resources with the required tenant or tenants. From then on, all the resources that are created in each Tenant (parent) are available to only the users (child nodes) of a particular parent.
Root Tenant
‘System’ is the root tenant. Every other tenant is a child or in the child hierarchy of this root.
There may be few objects which are kept ‘private’ to the system, meaning, those are not ‘shared’ to child tenants.
Top Level Tenants
Top Level Tenants (referred ‘tenants’ for simplicity) are the immediate children of system nodes.
For ex;
System
Company-1
Company-2
Company-3
In the above example, company-1, 2, 3 are top level tenants.
Simple Multi Tenancy
ATOM supports Sub tenancy where a tenant can subdivide their resources into a sub hierarchy.
But, when there are no sub tenants in the deployment, it is referred to as ‘Simple Multi Tenancy’.
For ex;
System
Company-1
Company-2
Company-3
In On-Prem deployment, it is up to the customer how they treat the root tenant.
If they don’t create any child tenants to the system, then, system and customer are synonymous.
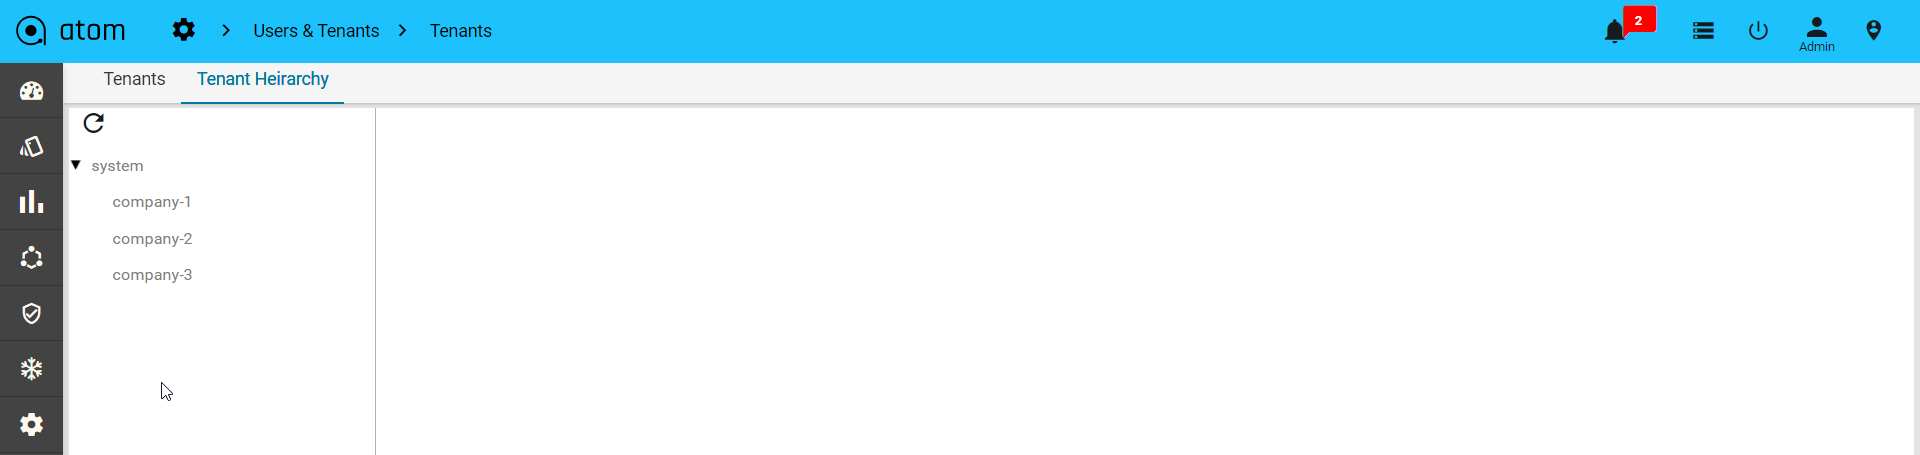
Hierarchical Multi Tenancy
Sub Tenant
A sub tenant is a child [directly or indirectly] of a Top Level [Not root] tenant.
System
Company-1
North
South
Campus-1
Company-2
Company-3
In the above example,
‘System’ is the root tenant
Company-1, Company-2, Company-3 are top level tenants
Company-1.north, Company-1.south are sub tenants of Company-1.
Company-1.south.campus-1 is a sub tenant of acme.south
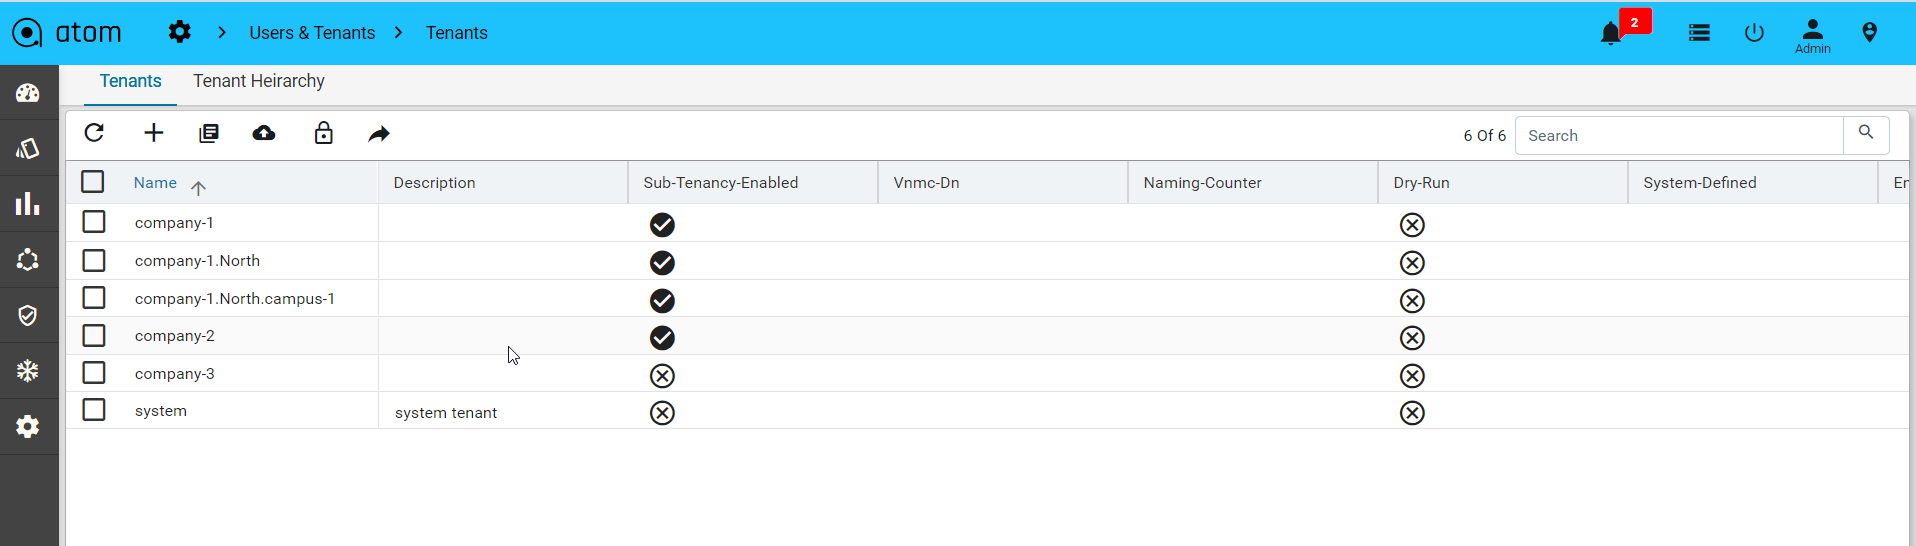
System users
System is the root tenant. System users are those, whose User.owner = ‘system’.
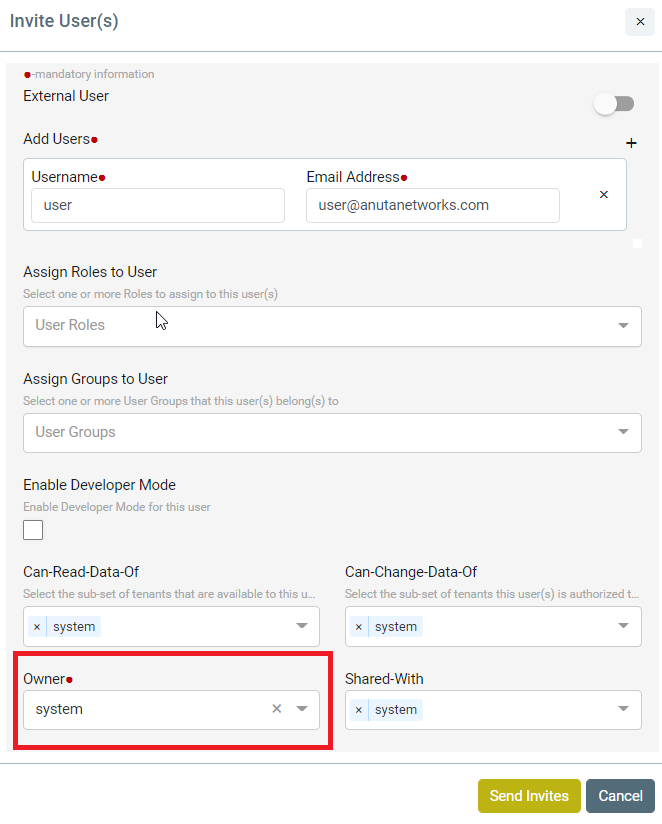
Tenant Users
Tenant users are customer users owned by individual tenants. User.owner != ‘system’
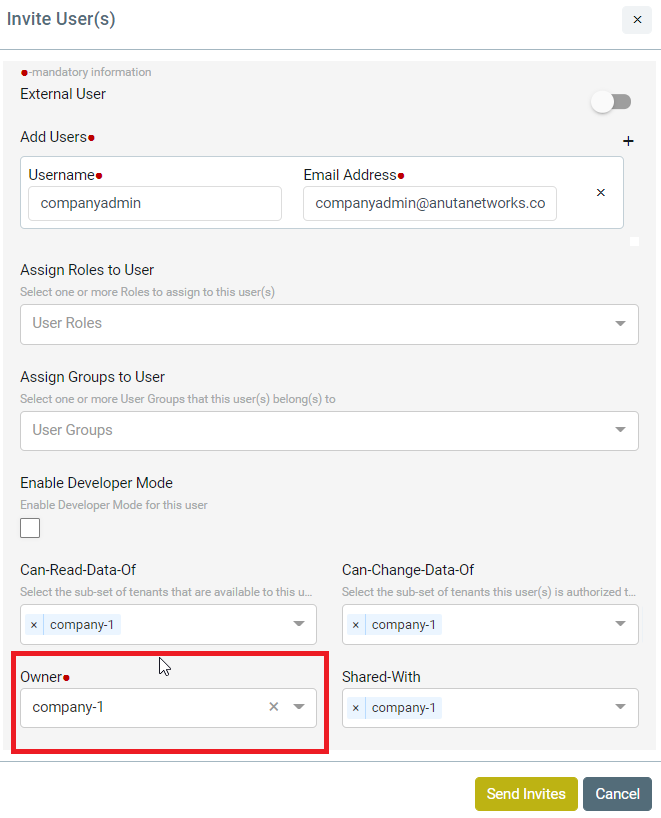
Owner
Owner is a tenant. And, we use ‘tenant-id’ to identify a tenant.
Tenant-id uses fully qualified names separated with dots, such as, Company-1.south.campus-1.
Multi Tenancy is all about keeping data private to a tenant. This means, data identified by a key can have one copy for each tenant. Suppose, 2 tenants want to bring in the same device-1 ? That counts to 2 instances with the same key. Clearly object id by itself is not sufficient. Hence, objects are identified by their id and ‘owner’. Object key is formed by object id and owner.
Shared-with
A resource can be shared with multiple tenants or kept private to the owner.
Sharing of resources applies only when a resource owned by one tenant is to be used by another tenant.
For example, a device owned by tenant-1 is used by a ‘network service’ created by a tenant-2.
Sharing across tenants is not supported. but, within a tenant sub hierarchy is supported.
For example, no data is ever shared among the 3 companies of the following hierarchy
System
Company-1
Company-2
Company-3
But there is, down the hierarchy sharing allowed. Such as, ‘system’ resources are shared to all the three [and sub tenants, if exist].
If Resource is shared-with system then it is private to system
If Resource is shared-with system.* then it is shared with all the sub tenants.
Concept Of Visibility And Usability
Visibility is the same as ‘Readability’; Whether a resource is visible to a user.
Usability of a resource is with respect to another resource and it is about whether a resource-1 can be referred (in a relation for example) by another resource.
For example,
device-1.credential-set = ‘cred-1’
| # | resource | Owner | |
| 1 | device-1 | Univ.Engg | |
| 2 | cred-1 | Univ.Phy |
Device-1 wants to use ‘cred-1’ in a ‘device.credential-set’ relation.
Currently, to make cred-1 available (visible, usable) to resources of Univ.Engg, you have to share it with that tenant.
| # | resource | Owner | shared-with |
| 1 | device-1 | Univ.Engg | |
| 2 | cred-1 | Univ.Phy | Univ.Engg |
Shared With Variations
System
Company-1
Campus-1
Department-1
Department-2
Campus-2
| Owner | Resource | Shared With | Details |
| Company-1 | R1 | Company-1 | R1 becomes a private object |
| Company-1 | R1 | Company-1, system | A Tenant Resource shared with system [there are a few scenarios where this is useful] |
| Campus-2 | R1 | company1.Campus-1, company1.Campus-2 | Sharing with other tenants [in the sub hierarchy] |
| Campus-1 | R1 | Campus-1.* | Using wildcards in sharing-with. R1 will be shared with all sub tenants. Since sub tenants can be added or removed during the life cycle of a deployment, sharing is spread to all the sub tenants available at the time of invocation. |
User.Owner
User object has an ‘owner’ property, just like any other resource.
But, there is a special meaning to ‘user.owner’.
Users need to be authenticated in the system.
Authentication is done with an ‘Identity Provider’, such as an LDAP.
Identity Providers are associated with tenants.
So, a user is authenticated against the provider traced via User.owner
User.can-read-data-of And User.can-change-data-of
A user could be created at a higher level (user.owner) but to limit the user to a subset of tenants there are two properties.
‘can-read-data-of’ controls which tenant data a user can read.
‘can-change-data-of’ controls which tenant data a user can change.
When a top level tenant does not have sub-tenants, user.can-read-data-of will be fixed to the tenant. User.can-change-data-of can be used to disable writes [by omitting a value]. If decided to allow writes , the value will be fixed to the tenant.
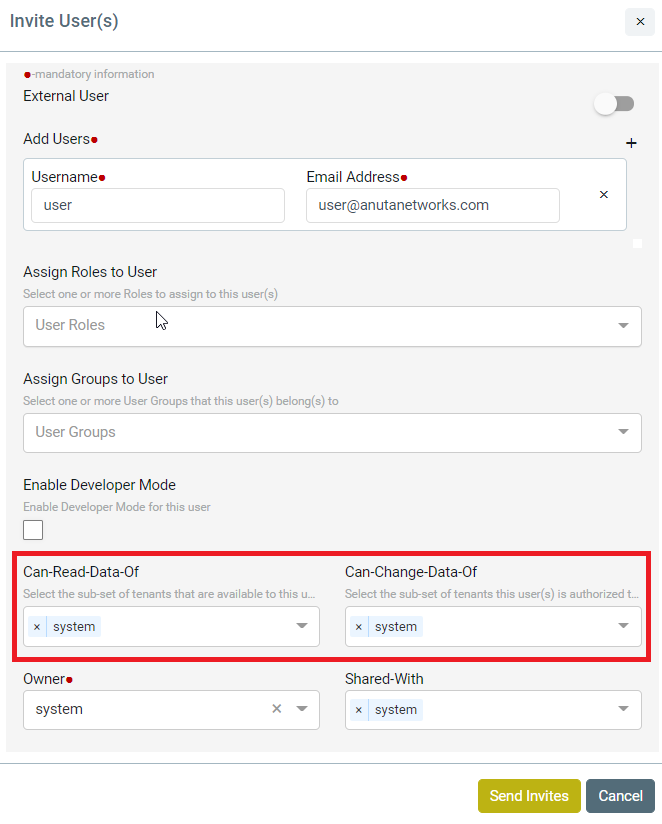
| NOTE: Except Monitoring and Alerts all other components are MT Enabled. |
Creating Tenants
Before instantiating a service, there should be at least a single Tenant created in ATOM.
- Navigate to Administration > Tenants
- Select the Tenants folder > click Add
- In the Create Tenant screen, enter the following:
- Name: Enter an alphanumeric string of not more than 32 characters
- Description: Enter a description for the Tenant
- TenantId: Enter a unique identifier for the Tenant
- Dry Run: This option does not allow ATOM to send the configurations to the devices while creating services. By default, this option is unselected.
- Select the checkbox to allow ATOM to push the commands on to the devices.
User Management
The control of users and groups is a core element of ATOM system administration.Users can also be grouped (based on the function) to have read permissions, write permissions, execute permissions or any combination of read/write/execute permissions for files owned by that group.
Managing Users in ATOM not only covers creating users but also configuring or assigning the privileges for each user or similar group of users to perform tasks in ATOM. Apart from creating the access or deny permissions in ATOM locally, you can import existing LDAP or AD users into ATOM and extend the necessary permissions to them too.
User management and Authentication works in ATOM as shown in the diagram below. The user information is saved in KeyCloak. OAuth Proxy acts as a gatekeeper checking all the incoming requests and ensuring the requests are coming from an authenticated client. If the proxy sees an non-authentic call, it redirects the request to a login screen served by the identity provider, which is KeyCloak.
User management in ATOM includes the following:
- “Roles”
- “Creating Authentication Mode Priority”
- “Managing Users”
- “Configuring Access Control”
- “Managing OpenLDAP Users”
- “Managing Active Directory Users”
- “Managing TACACS Users”
Roles
A set of system‐defined permissions are grouped into roles and are available in ATOM by default. These roles can be assigned to a user during the creation of users in ATOM.
- ROLE_SYSTEM_ADMIN: Administrator of the root tenant (‘system’). Every other tenant is either a direct child of the system or a sub tenant (descendent) of a top level tenant. System admin is given permission to onboard tenants and manage ‘system’ tenant resources.
- ROLE_TENANT_ADMIN: Is the equivalent of ROLE_SYSTEM_ADMIN (gets blanket permissions on all resources) but limited to resources of the specific tenant (‘user.owner)’ .
-
ROLE_USER_ADMIN: Gives all access to user mgmt objects (users, Groups, rbac rules [rule list and everything down] etc), but limited to user.owner.
-
ROLE_WORKFLOW_ADMIN: Allows a user all permissions on all workflow resources.
This avoids having to create individual workflow permissions.
Note that other permissions (rpc, data node etc) are still needed to be given explicitly, because this role only covers ‘Workflow resources’ only.
Creating Authentication Mode Priority
Starting from the 5.8.7 release, the admin can set the priority of the authentication modes in ATOM. By setting the priority of the authentication modes, the admin can enable the login failover to another authentication mode, if the first authentication mode (as arranged in the order of priority) fails. ATOM fails to the local authentication mode, if all the authentication modes as defined in the priority list fail.
To create the authentication mode priority in ATOM, do the following:
- Navigate to Administration > Users & Tenants> Authentication Mode Priority in the left pane.
- In the right pane click Add Auth Priority and in the Create Auth Priority screen, click Entities > auth-modes
- Enter values in the fields as described below:
- Priority: Set the priority for the authentication mode. (1 is the highest priority)
- Authentication Mode ‐ Select the authentication mode from the available authentication modes (TACACS, OpenLDAP, Active Directory and Local)
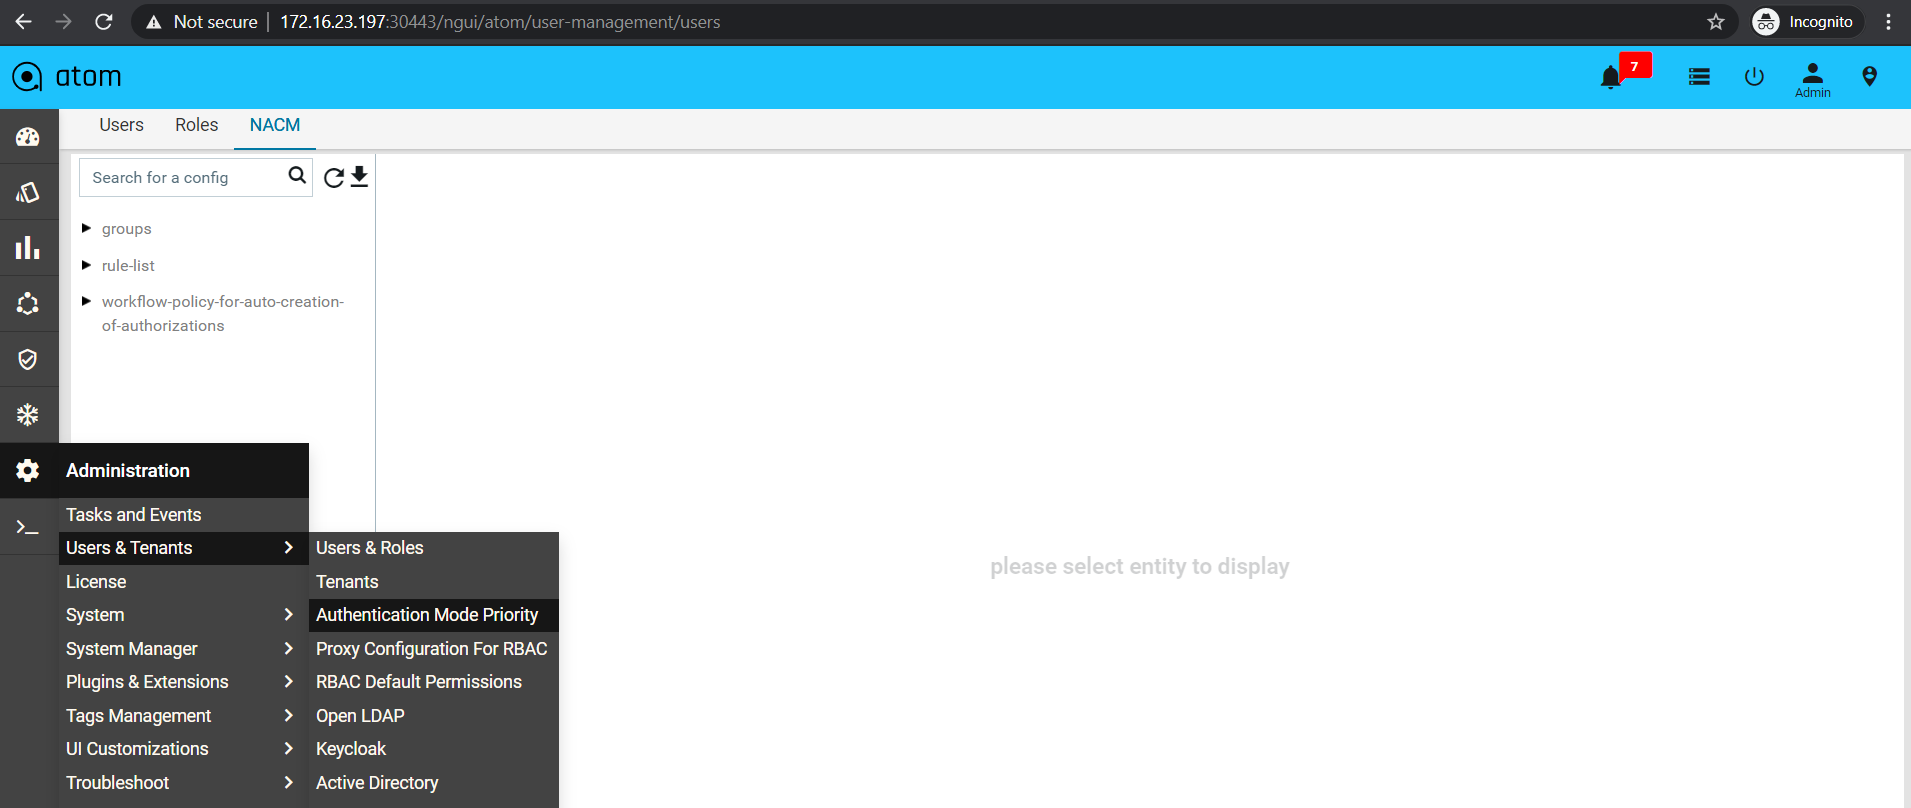
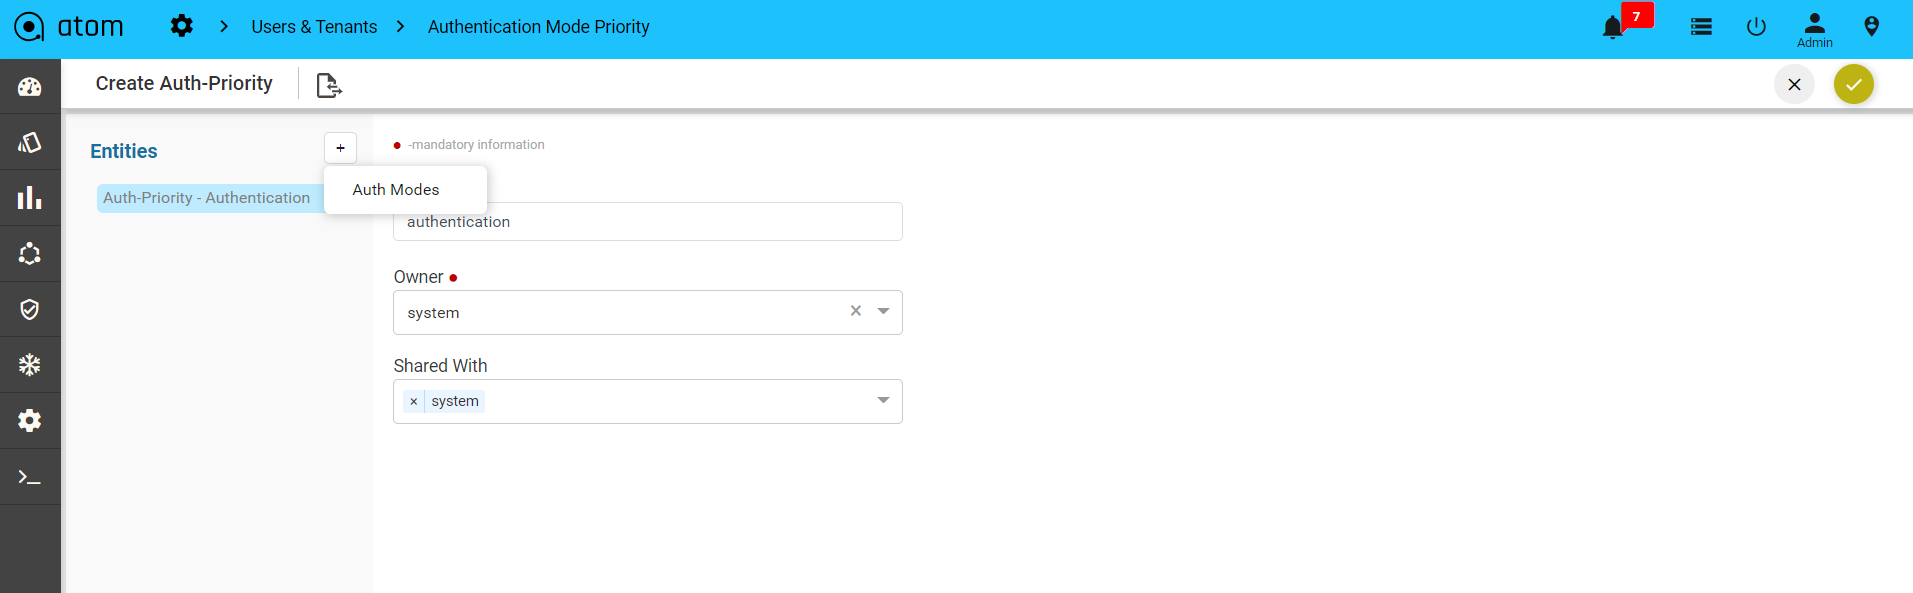
After setting the priority for each of the authentication modes, you can view the list as shown below:
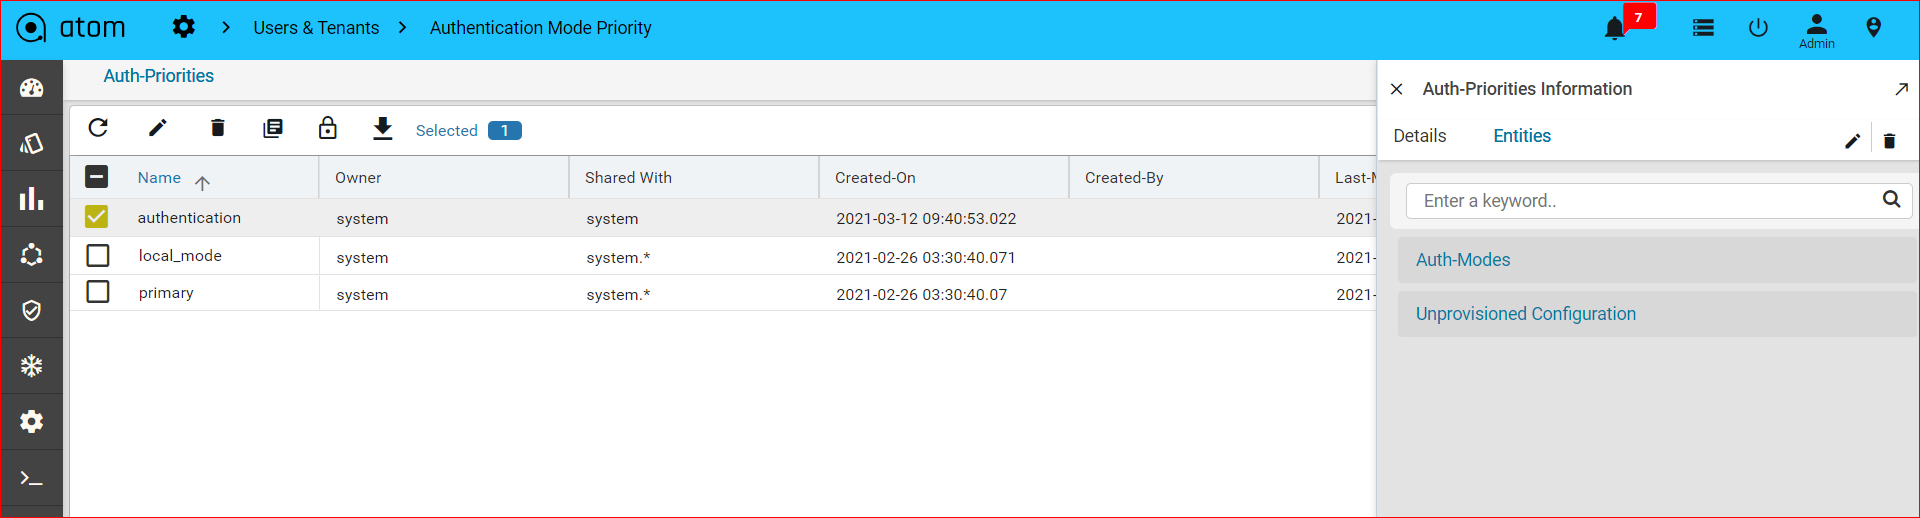
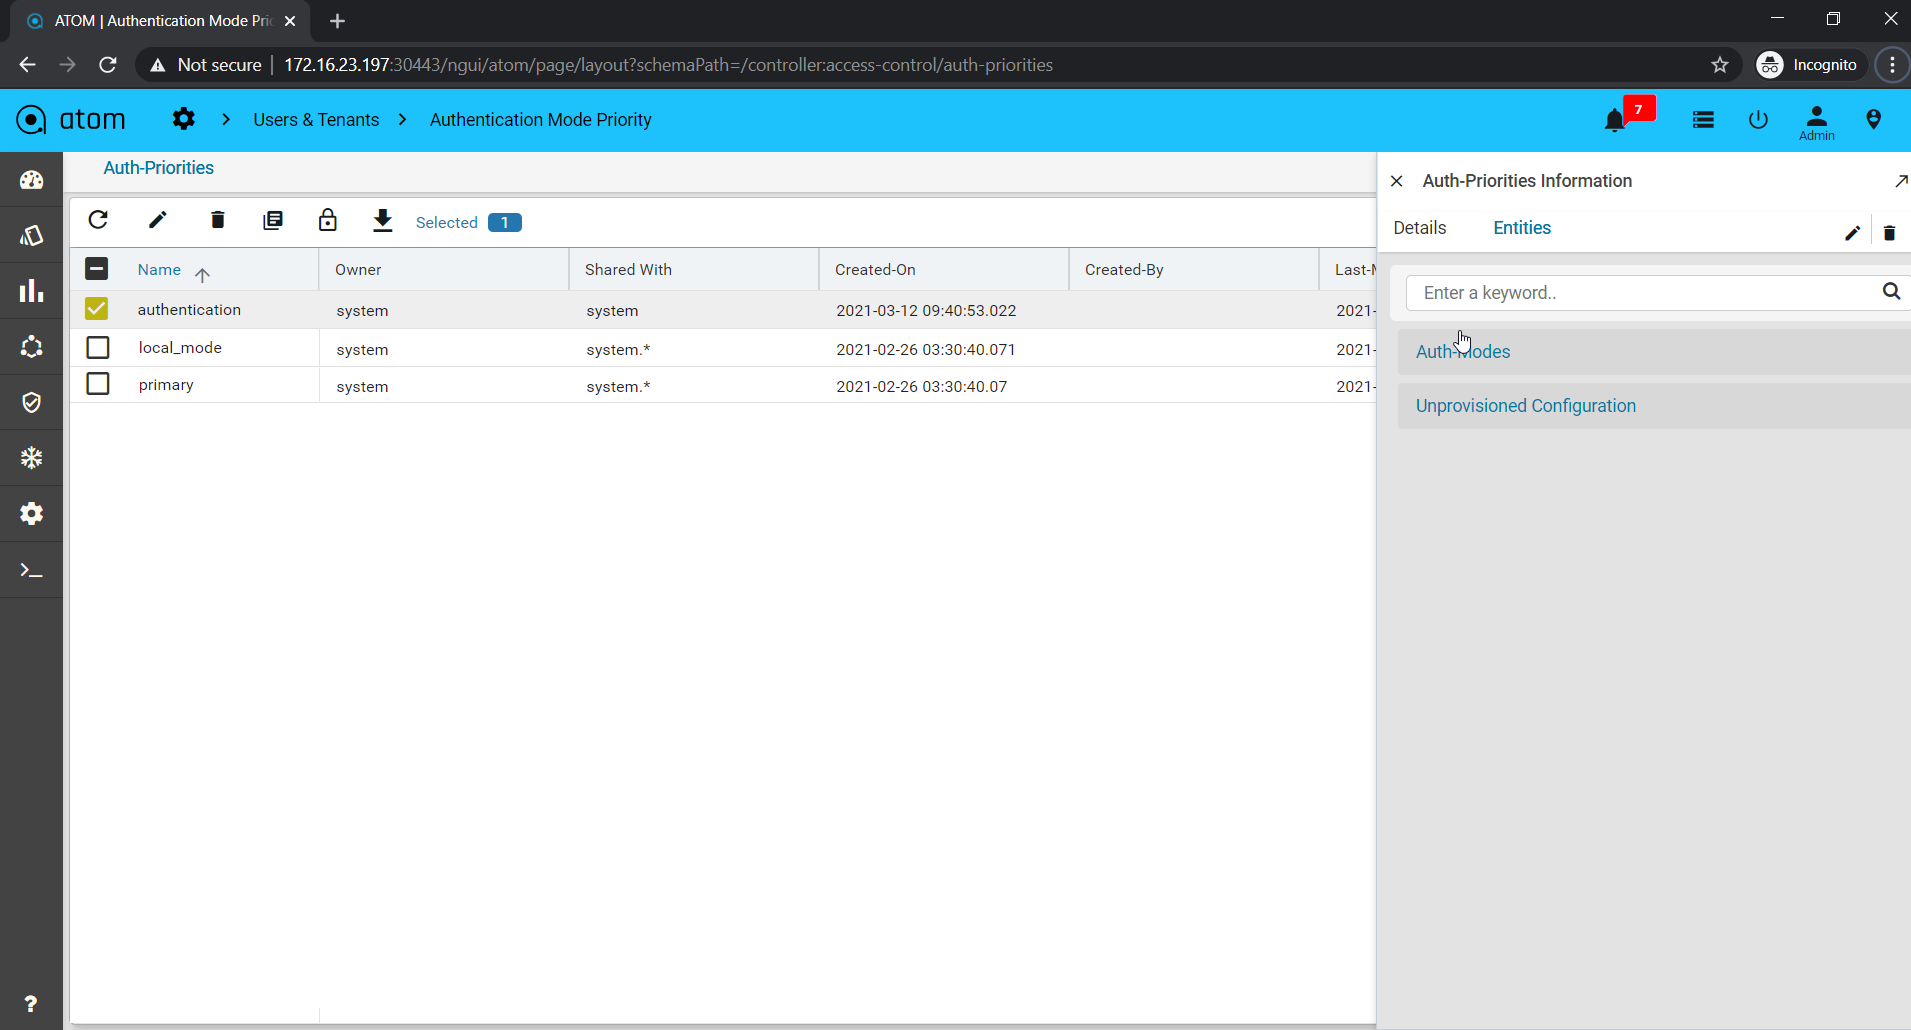
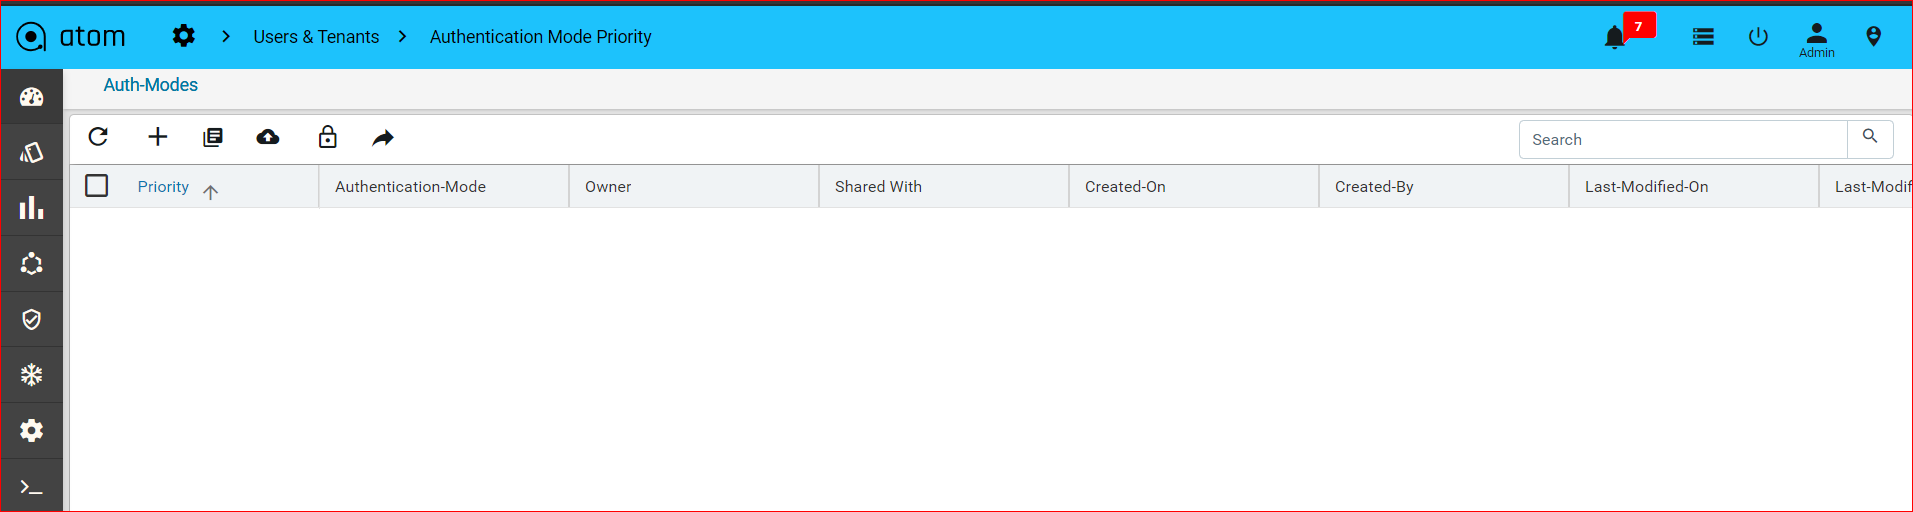
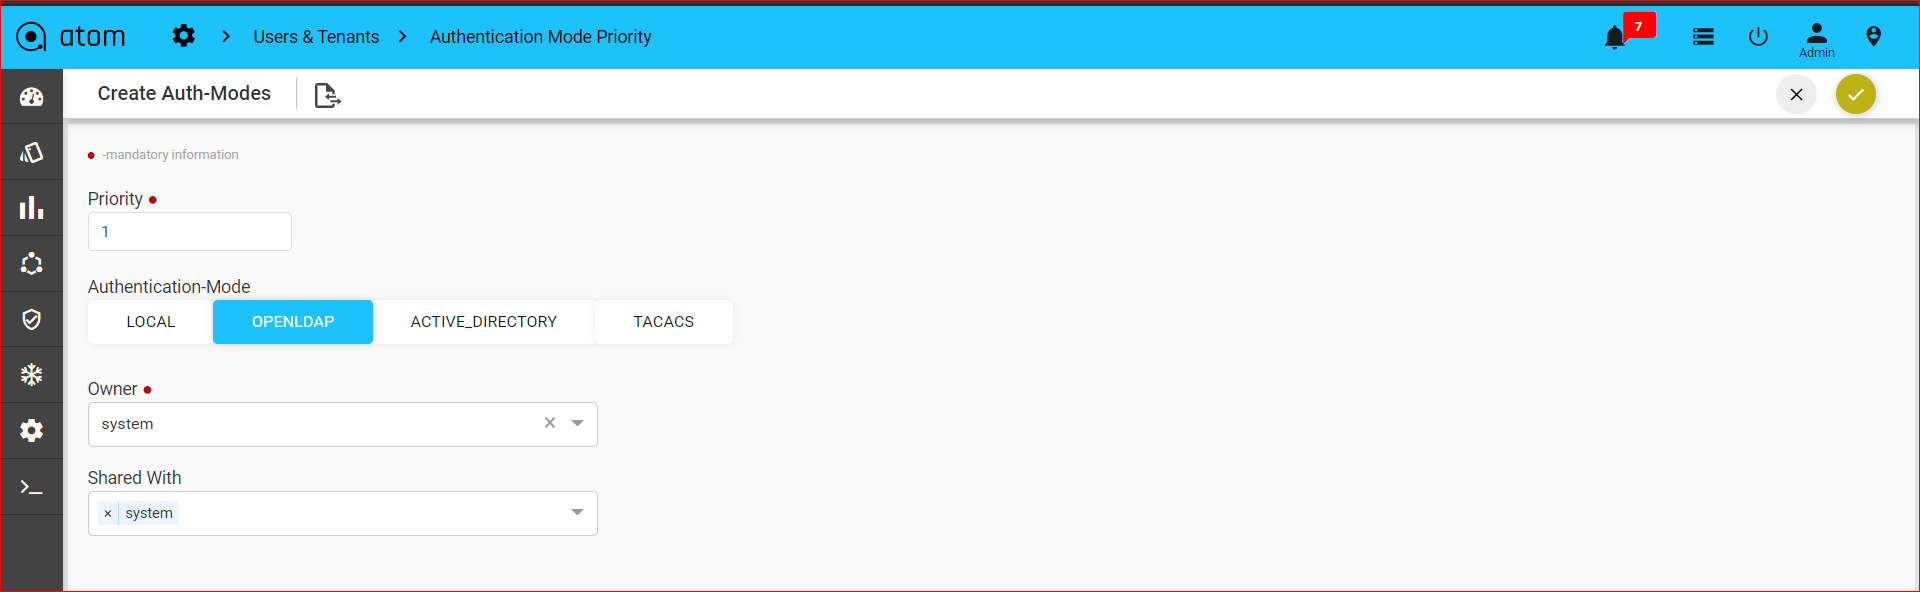
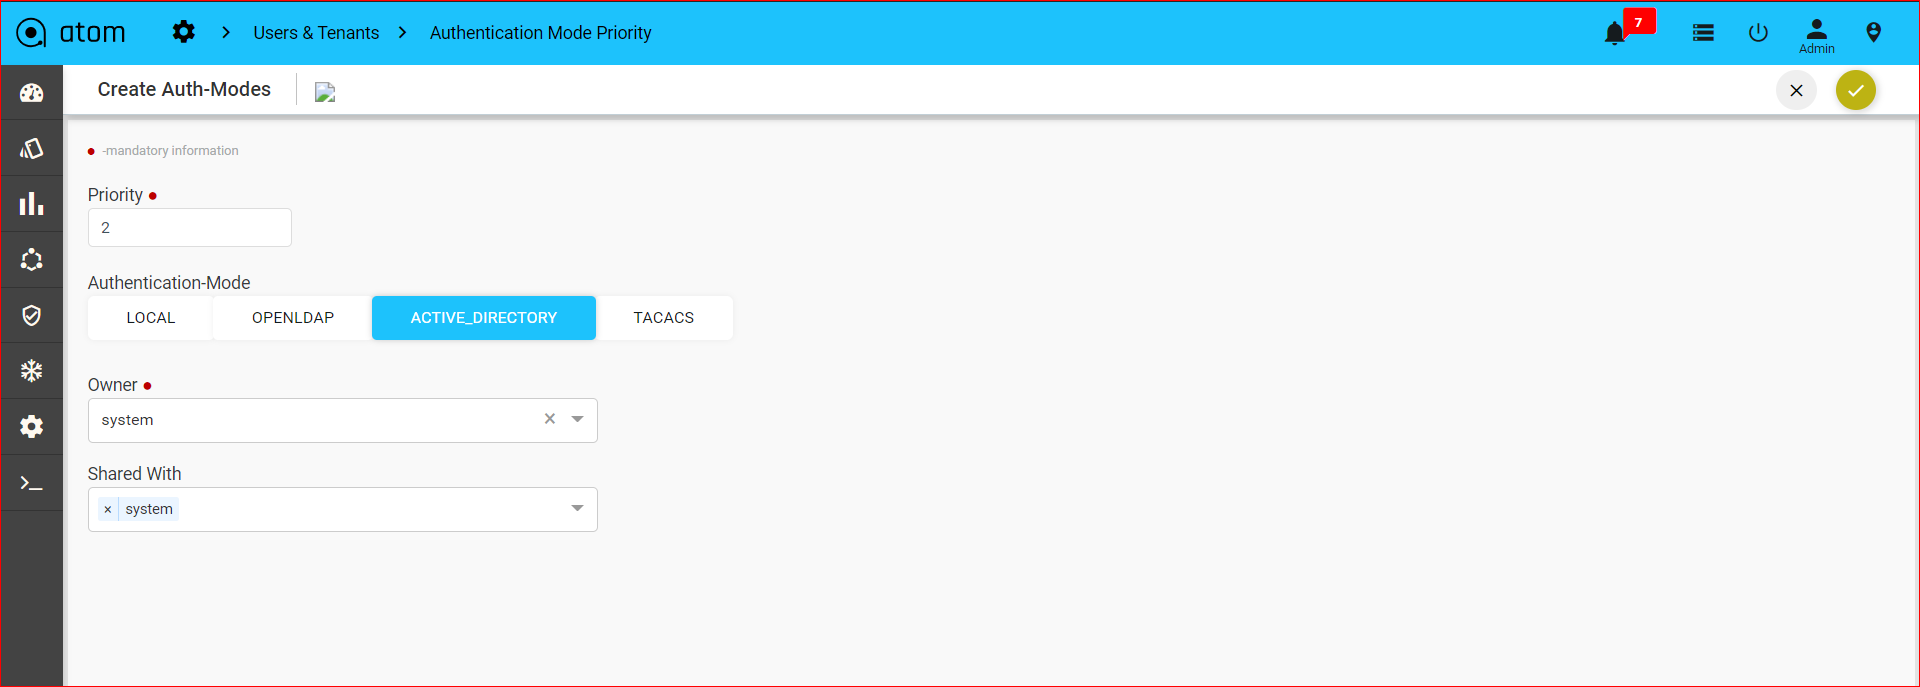
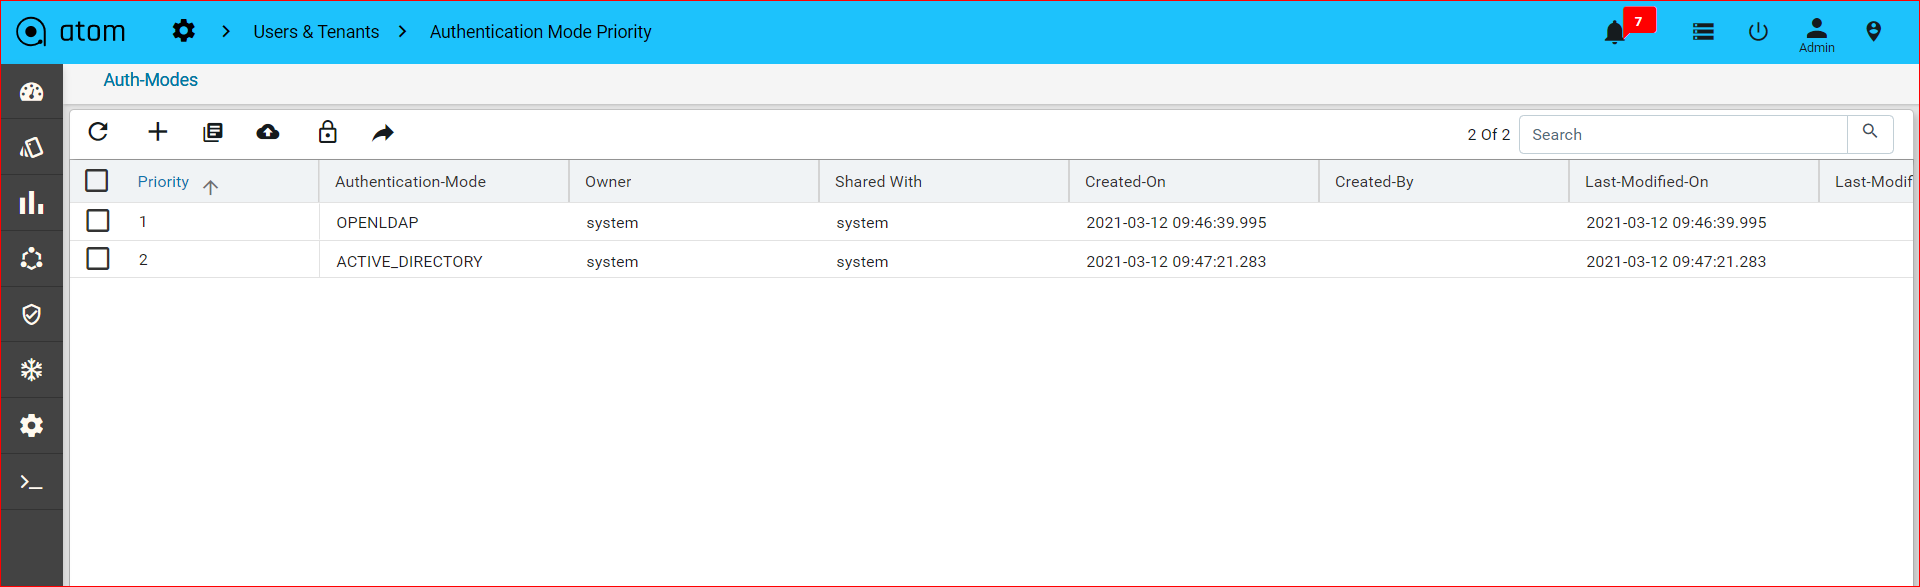
The authentication mode priority thus set can be assigned to a user at the time of creation of the user in ATOM
Managing Users
An Administrator can add local users to ATOM and configure their email accounts to receive notifications from ATOM. Apart from local users, ATOM lets its customers integrate their central authentication servers to streamline the user login process and automate administrative tasks such as user creation and role assignment. User data is synchronized from customer authentication servers into ATOM.
Adding a New User
To add Users in ATOM, do the following:
- Navigate to Administration > Users & Tenants > Users & Roles and click Add.
- In the User Invitation screen, enter the values in the following fields:
- External User: Enable this button to create AD, LDAP, or TACACS users in ATOM. When this button is not enabled, a local user is created in ATOM.
| Note: A local user will be required to reset his account password on first login attempt. An external user can directly login to ATOM using the link in their invitation email. |
-
- Add User: The administrator can invite one or more users to ATOM at once. To add more than one user, click on the + button.
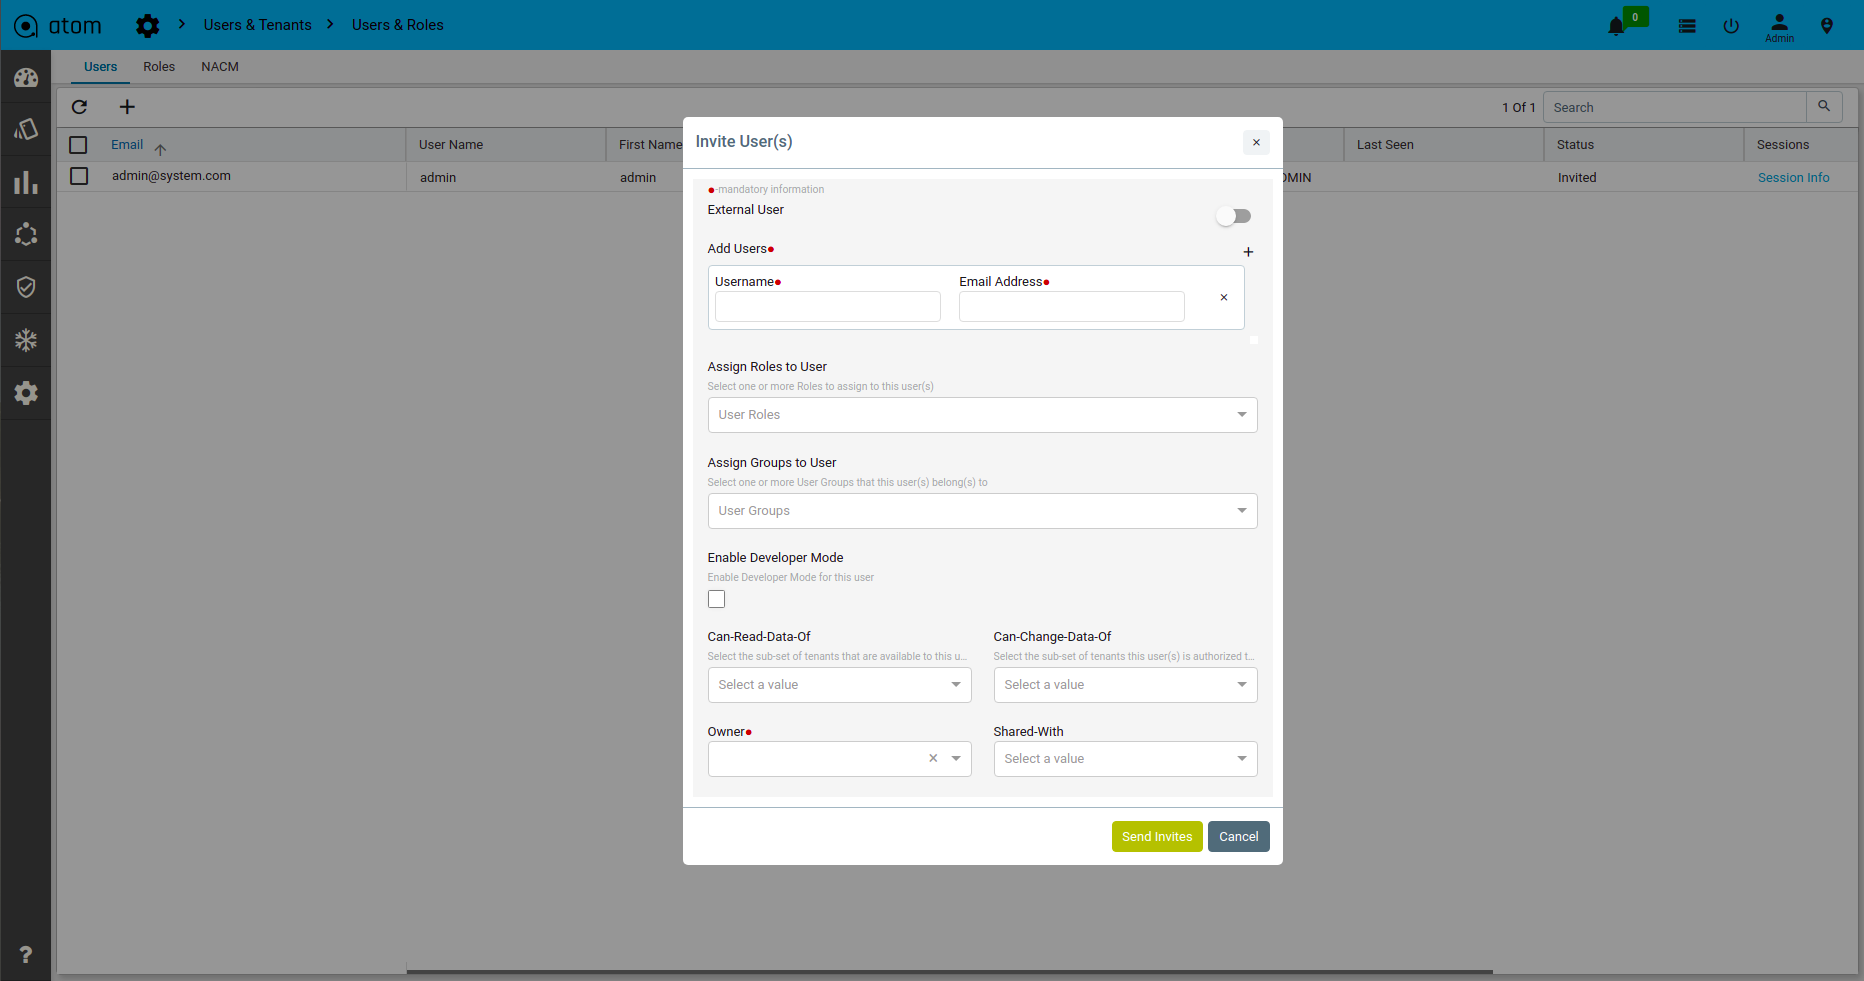
-
-
- Username: Enter an alphanumeric string of not more than 36 characters.
-
| Note: While creating AD, LDAP, or TACACS users in ATOM, the name entered in the Username field should be the same as that created in the respective authentication server. |
-
-
- Email Address: Enter a valid email ID. Invitation emails to join ATOM Cloud will be sent to this address.
- Assign Roles to User: User can be assigned relevant Role(s) from the list of system-defined Roles. Each Role is a set of system-defined permissions given to the user.
- Assign Groups to User: User can be put into pre-defined Group(s) to apply the access control privileges on them as a whole.
- Enable Developer Mode: In developer mode users have access to many tools to work with Atom platforms.
- Can-Read-Data-Of: Select the tenants, whose data this user can read.
- Can-Change-Data-Of: Select the tenants, whose data this user can change.
- Owner: Select the owner of this user.
- Shared-With: Select the tenants with whom this user should be shared.
-
Editing an Existing User
User details can be edited by selecting an user. When a user is edited, the user is taken to the same form seen for adding a user. However, fields such as Username, Email Address and External User are non-editable as these form the fundamental identifiers for the user.
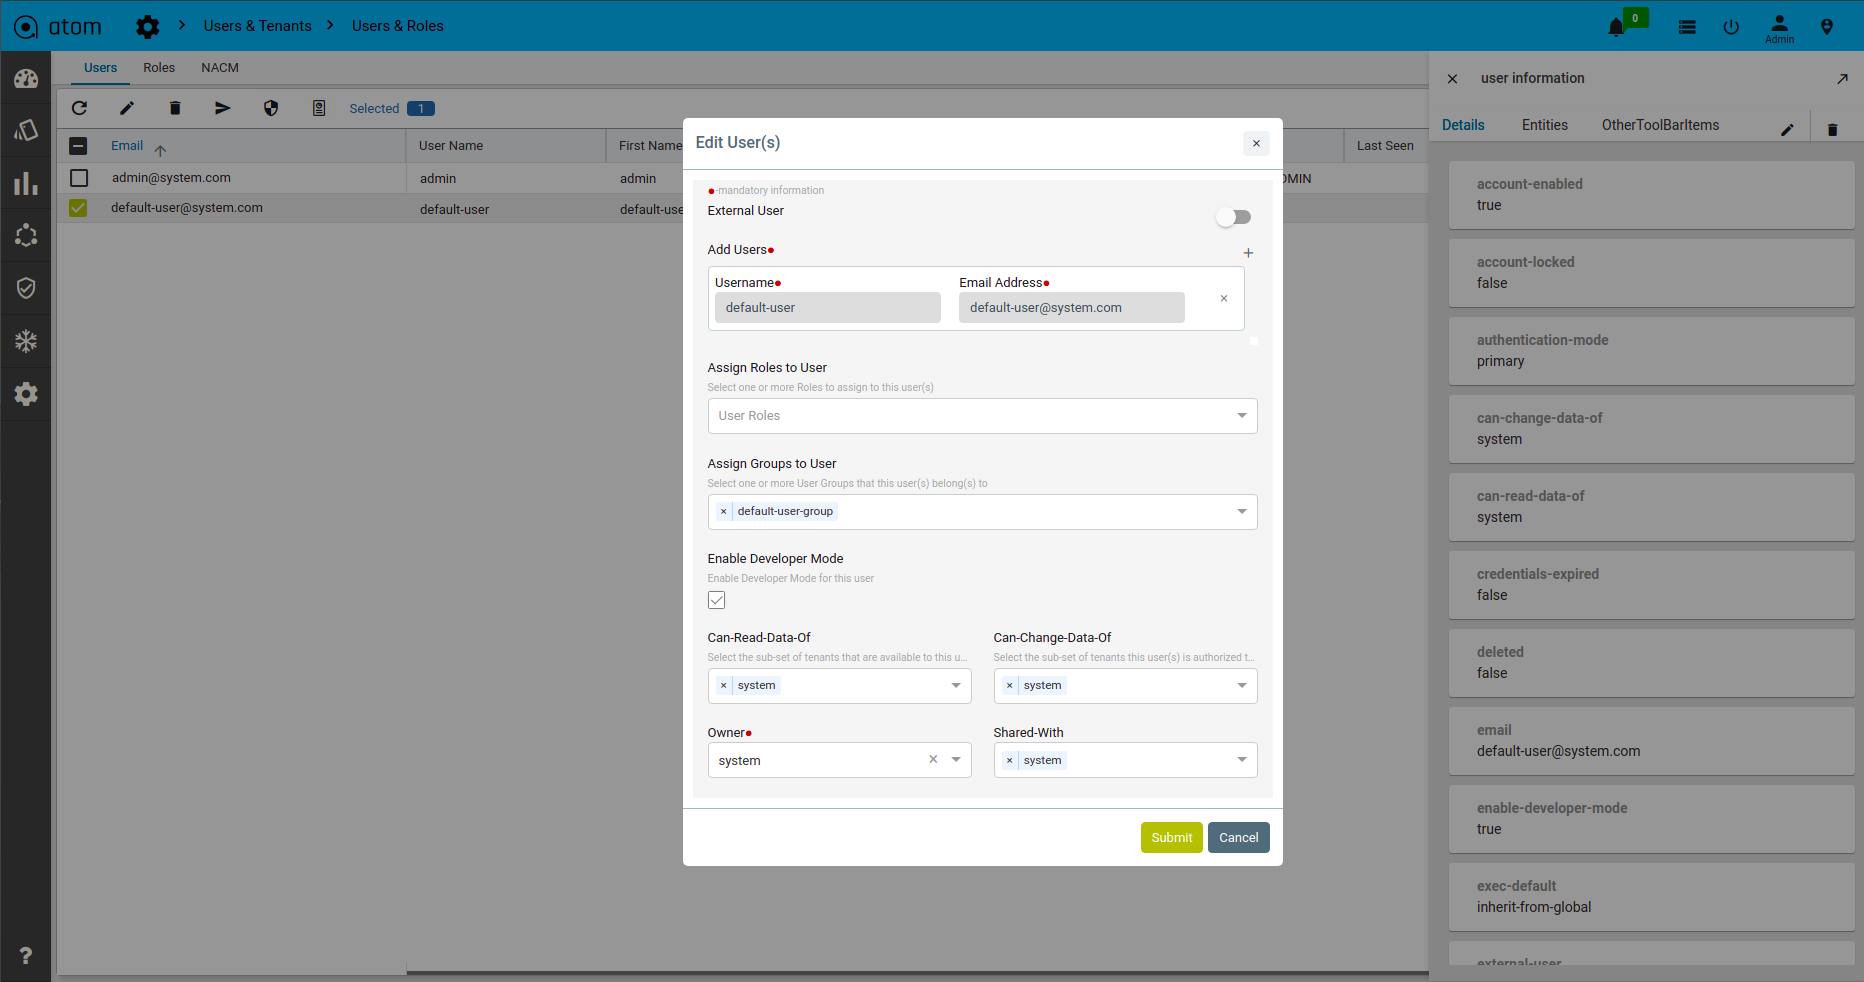
Resend User Invite
If the invitation to ATOM Cloud needs to be resent to the user’s email address, the administrator can select the user and click on the resend invite icon.
Block/Unblock User
At any instance, the administrator can Enable or Disable a user account by this option. When blocked, the user will not be allowed to login to ATOM.
Assigning Role to the User
From the drop‐down menu, select the role that should be assigned to the user. These roles are defined earlier as in the section, “Creating Roles”.
Creating SNMPv3 users
SNMPv3 users are required when the users or third party applications require additional authentication and access control provided by SNMPv3.
- Navigate to Administration > Users & Tenants > Add User
- In the Create user screen, click user >entities> snmpv3 in the right pane.
- In the right pane, enter values in the following fields:
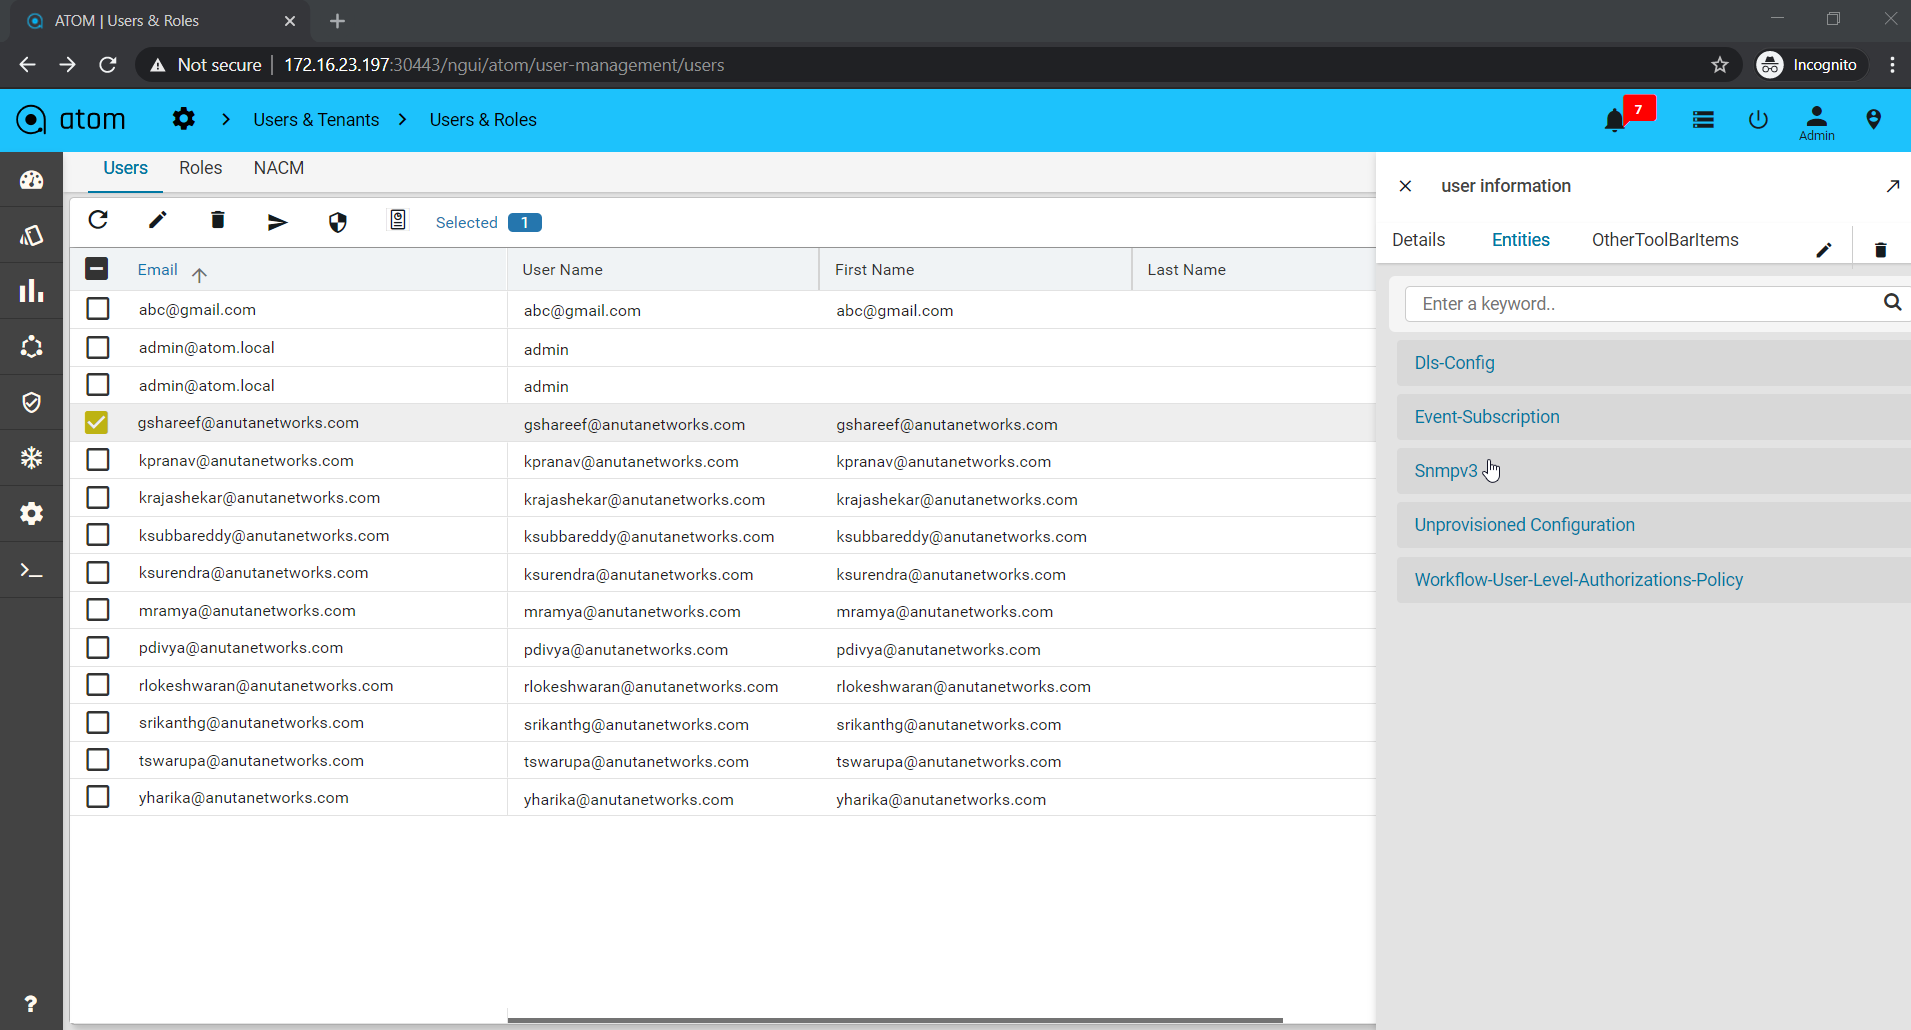
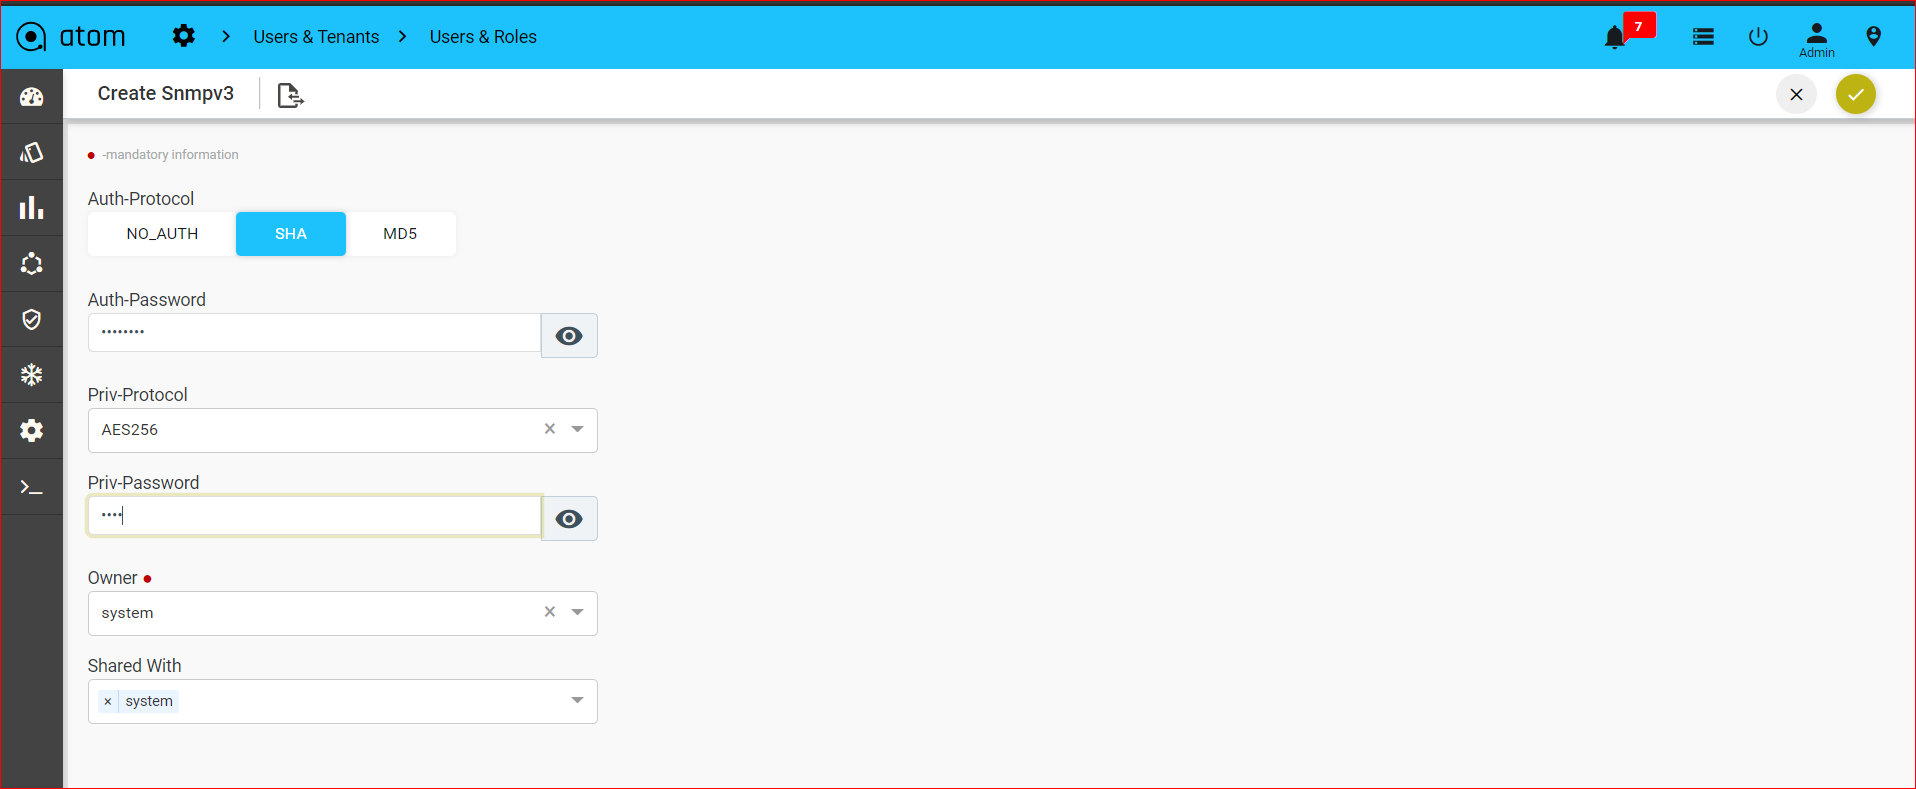
-
- Authentication Protocol: Enter the mode of authentication when SNMPv3 is enabled.
- Privacy Protocol: Enter the requisite privacy protocol depending on the selected authentication protocol.
Subscribing to Events
Email notifications can be configured to be sent to the created user when a specific event or events occur in ATOM.
- Navigate to Administration > Users & Tenants > Add User
- In the Create user screen, click user >entities> event subscription in the right pane.
- Fill the values in the fields described below:
- Click Add to subscribe to a specific event or click Add all to add all the events available in ATOM.
An email is triggered and sent to the user when any of the events occur in ATOM.
You can configure the mail to be sent immediately after the occurence of the event or schedule the mail notifications to be sent at periodic intervals as illustrated in the screenshot below:
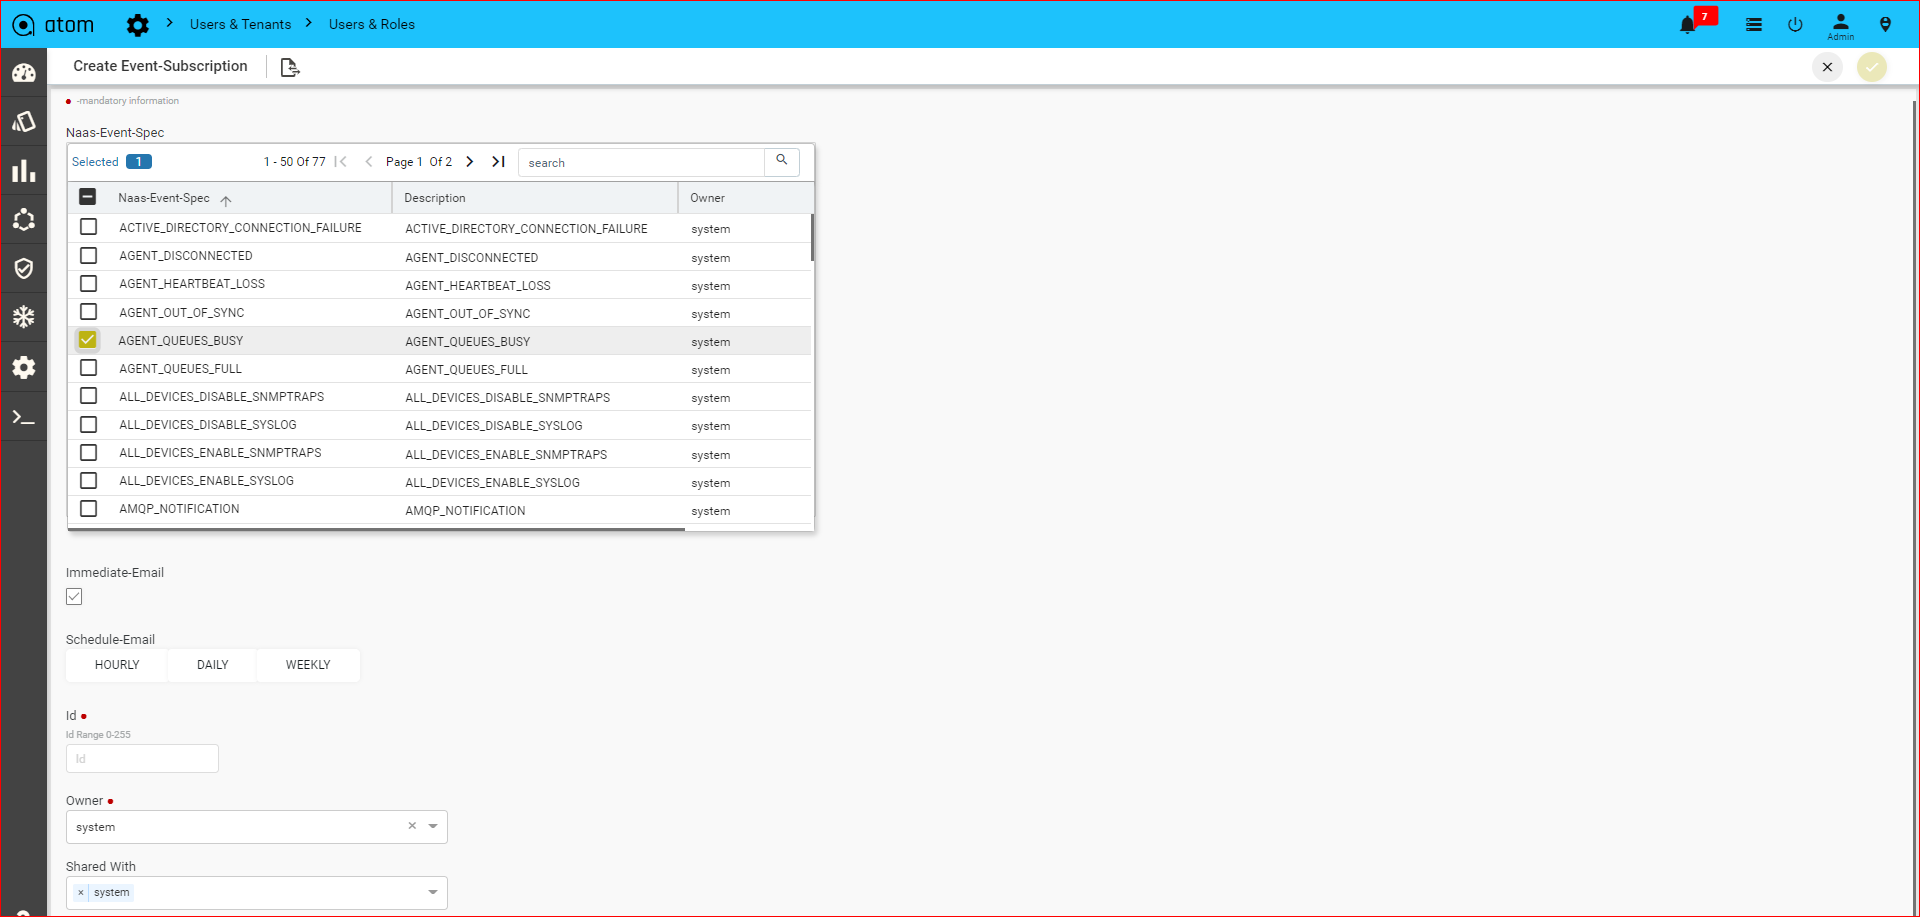
Workflow-User-Level-Authorization
If it is decided to have user level permissions what should be the default permissions? That question is answered by the global configuration at /controller:nacm/workflow-policy-for-auto-creation-of-authorization
If it is needed to customize those permissions for a specific user? That question is answered by this model
Using this model you can use
1.enable the user level permissions
2.choose to use the global default or customize
Here three options are there
DISABLE:: Is the default selection.Using this option you can explicitly disable the auto creation of permission for this user.
ENABLE:Enables global defaults for this user.
READ-ONLY-PERMISSION:Enables the read only permissions out of the global defaults
OVERRIDE-GLOBAL-CONFIG:Enables user level permission creation for this user,and, for those permissions you’re going to specify here, explicitly.
- Navigate to Administration > Users & Tenants > Add User
- In the Create user screen, click user >entities> workflow-user-level-permission-authorization in the right pane.
- By default workflow-user-level- authorization is disabled it.
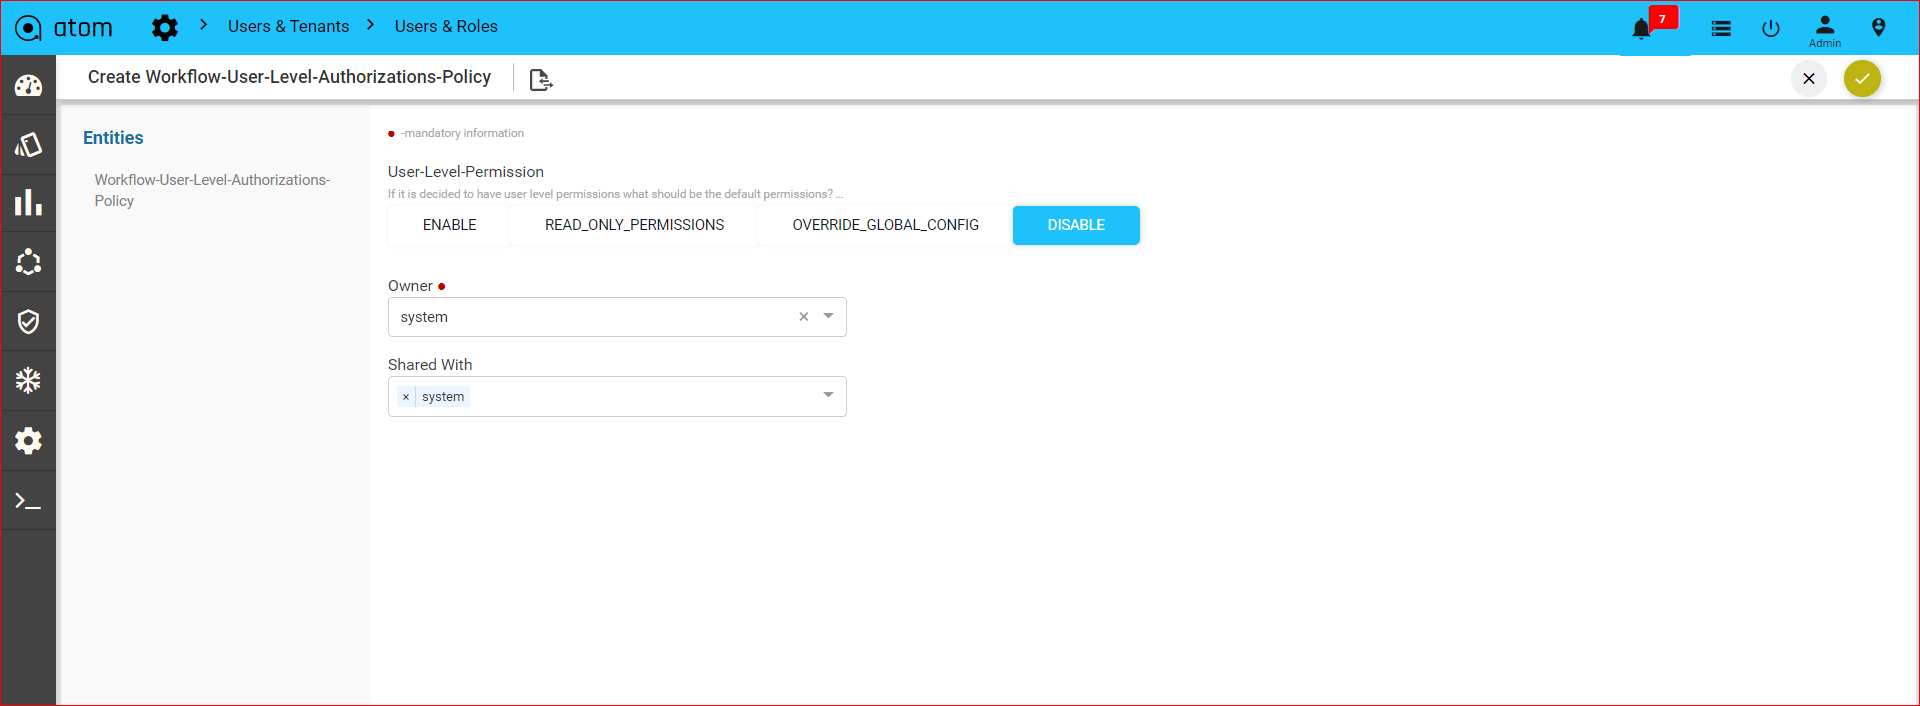
Configuring Access Control
By implementing NACM developed by NETCONF, ATOM enables administrators to allow or deny access to protocol operations and data to a set of users. Access Control in ATOM is achieved by a combination of “Rule‐list” and “User Groups”. Rules are grouped into Rule‐list and users are assigned to User Groups to control access to resources managed by ATOM.
To set the global access control settings in ATOM, do the following:
- Navigate to Administration > Users & Tenants > Access Control
- Click Edit to modify the global settings for access control.
As an administrator, you can set the default access control settings which are applicable to all entities in ATOM
- Enable NACM: Select this option to set a group of read, write, and execute options that should be applicable by default to all the entities in ATOM.
- Read Default: The default value is “permit” for all the operations/objects(Controls whether read access is granted if no appropriate rule is found particular read request)
- Write Default: The default value is “deny” for all the operations/objects(Controls whether create,update or delete access is granted if no appropriate rule is found particular write request)
- Exec Default: The default value is “permit” for all the operations/objects(Controls whether exec access is granted if no appropriate rule is found particular protocol operation request)
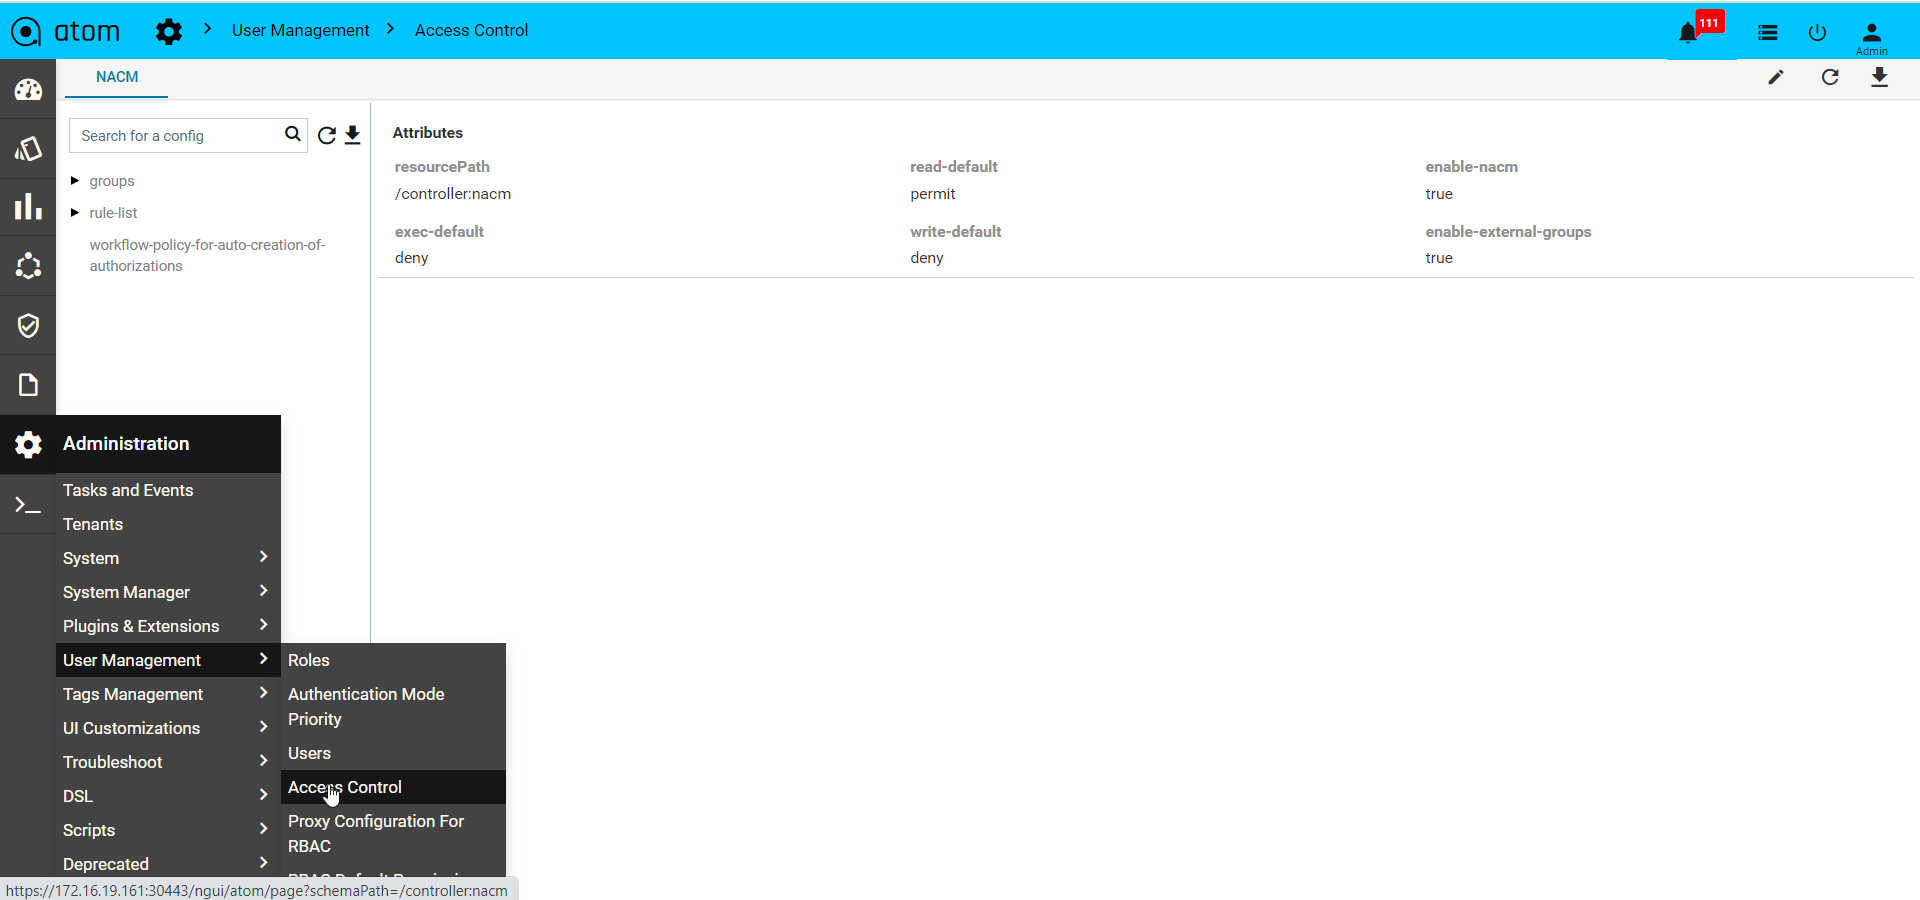
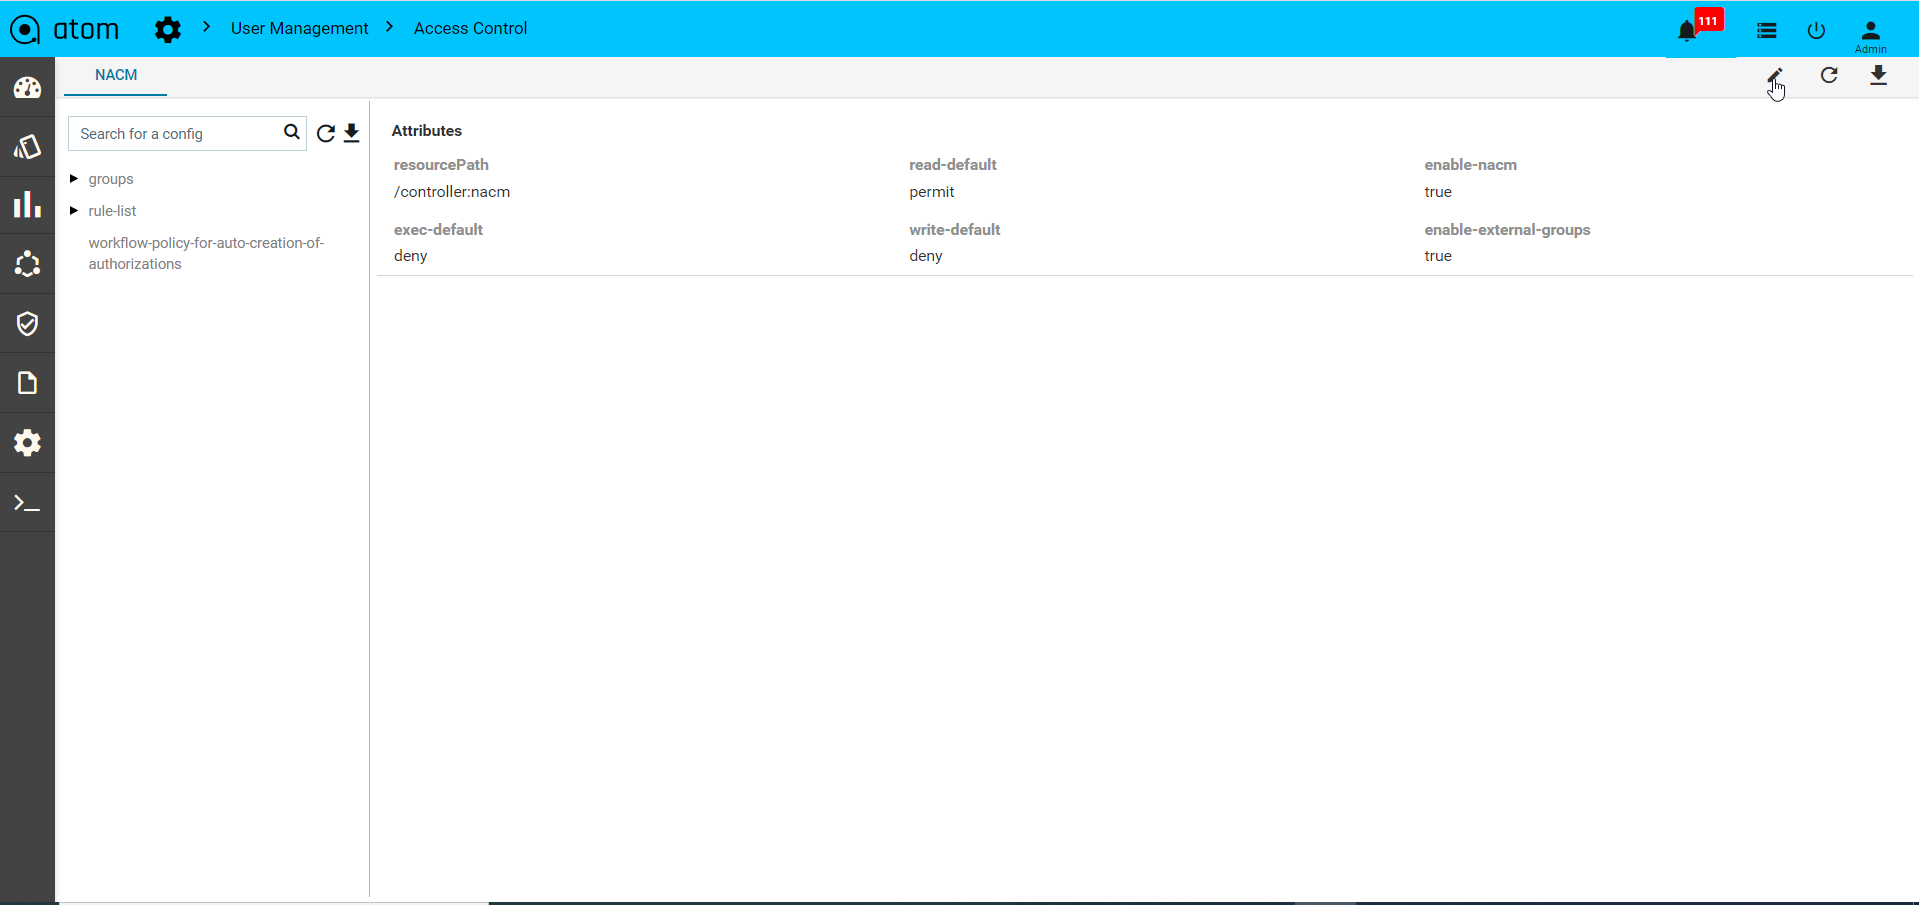
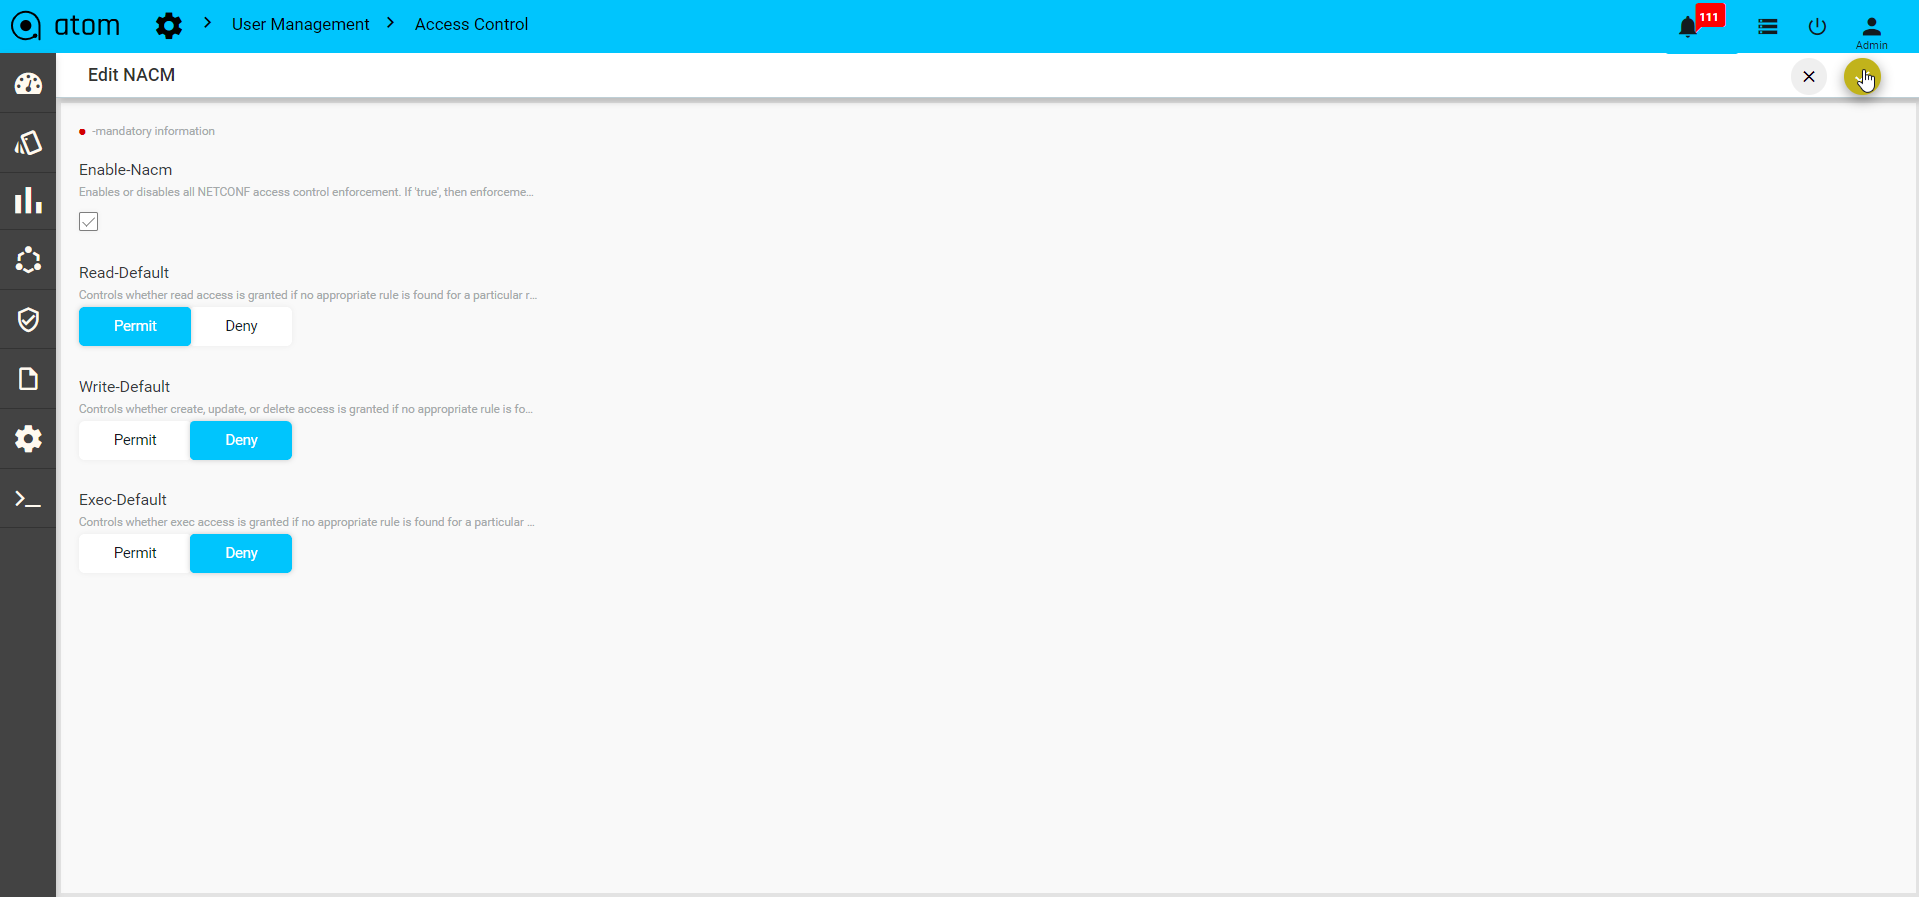
| Note: These default settings that are entered in the above screen can be overridden by the values set by a specific rule created for an entity. |
Adding User Groups
You can organize users to groups and apply the access control privileges on them as a whole.
To create a User Group:
- Navigate to Administration >Users & Tenants >Users & Roles> click NACM
- In the Details pane, on the right, click Groups > Add Group
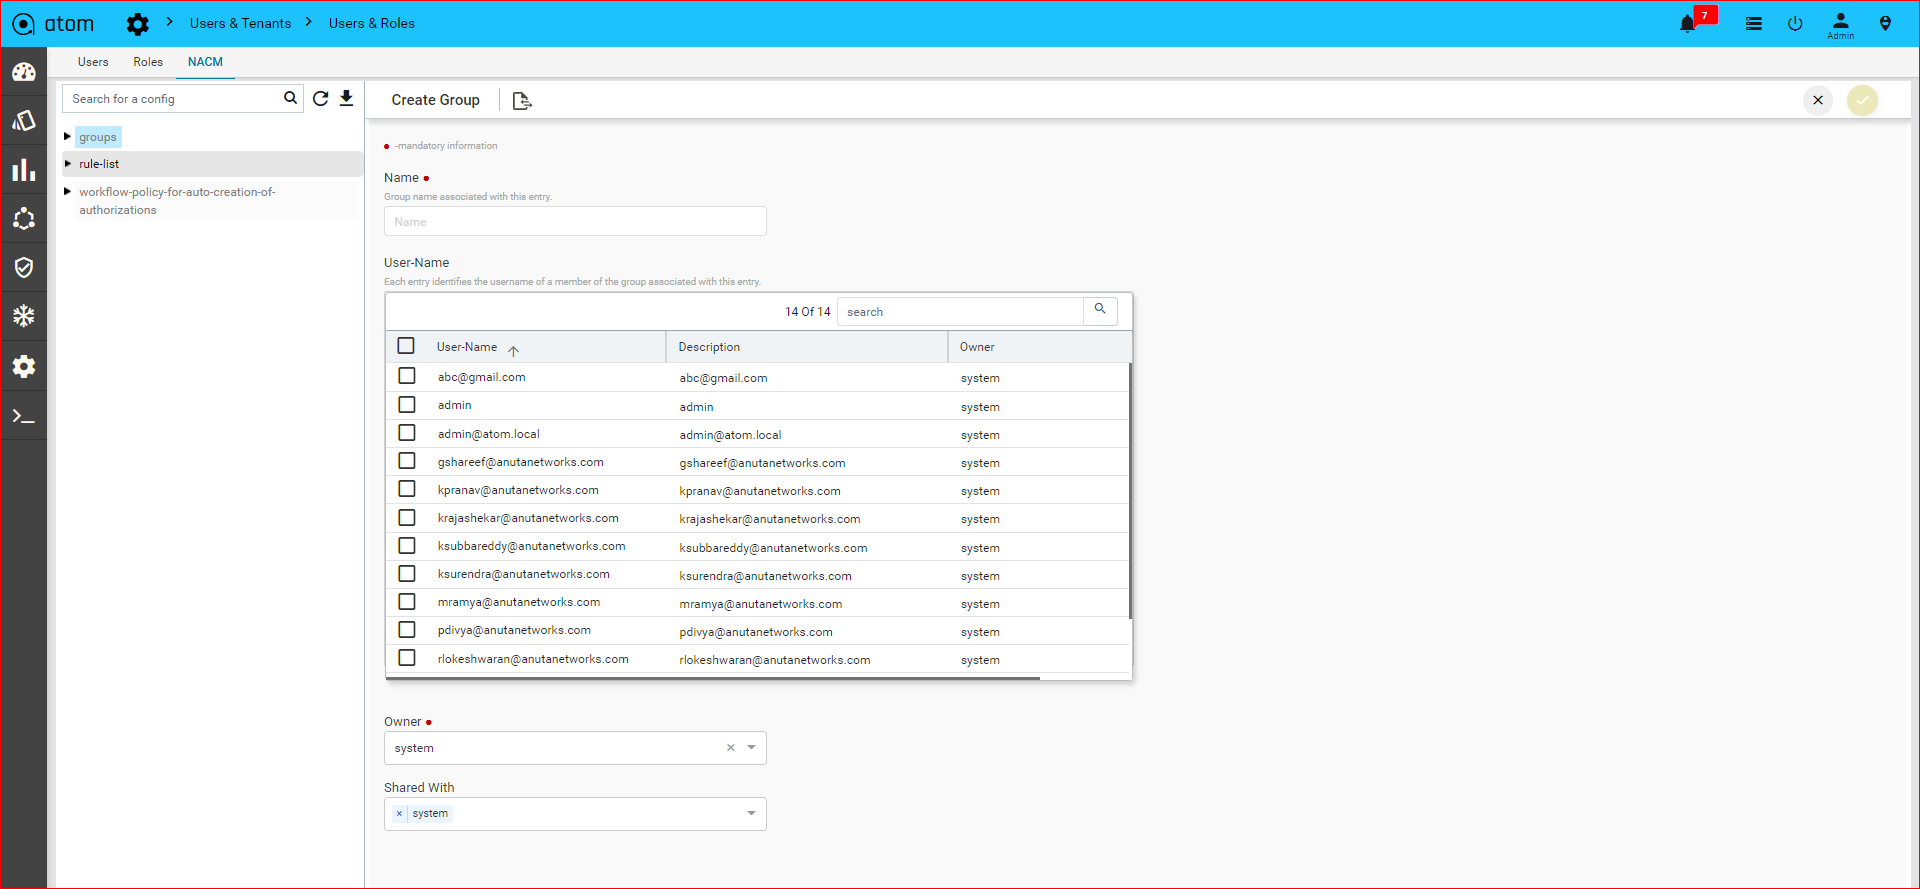
- Name: Enter the name for the User Group
- Select a user to this group.
Creating Rule lists
Rule lists are an aggregated list of rules created in ATOM.
- Navigate to Administration > Users & Tenants >Users & Roles> click NACM
- In the Entities pane, on the right, click Rule-list > Add(+)
- Name: Enter the text that will be used as a name for the rule list.
- Select a group (user group) to which the created rules in the Rule list should be assigned.
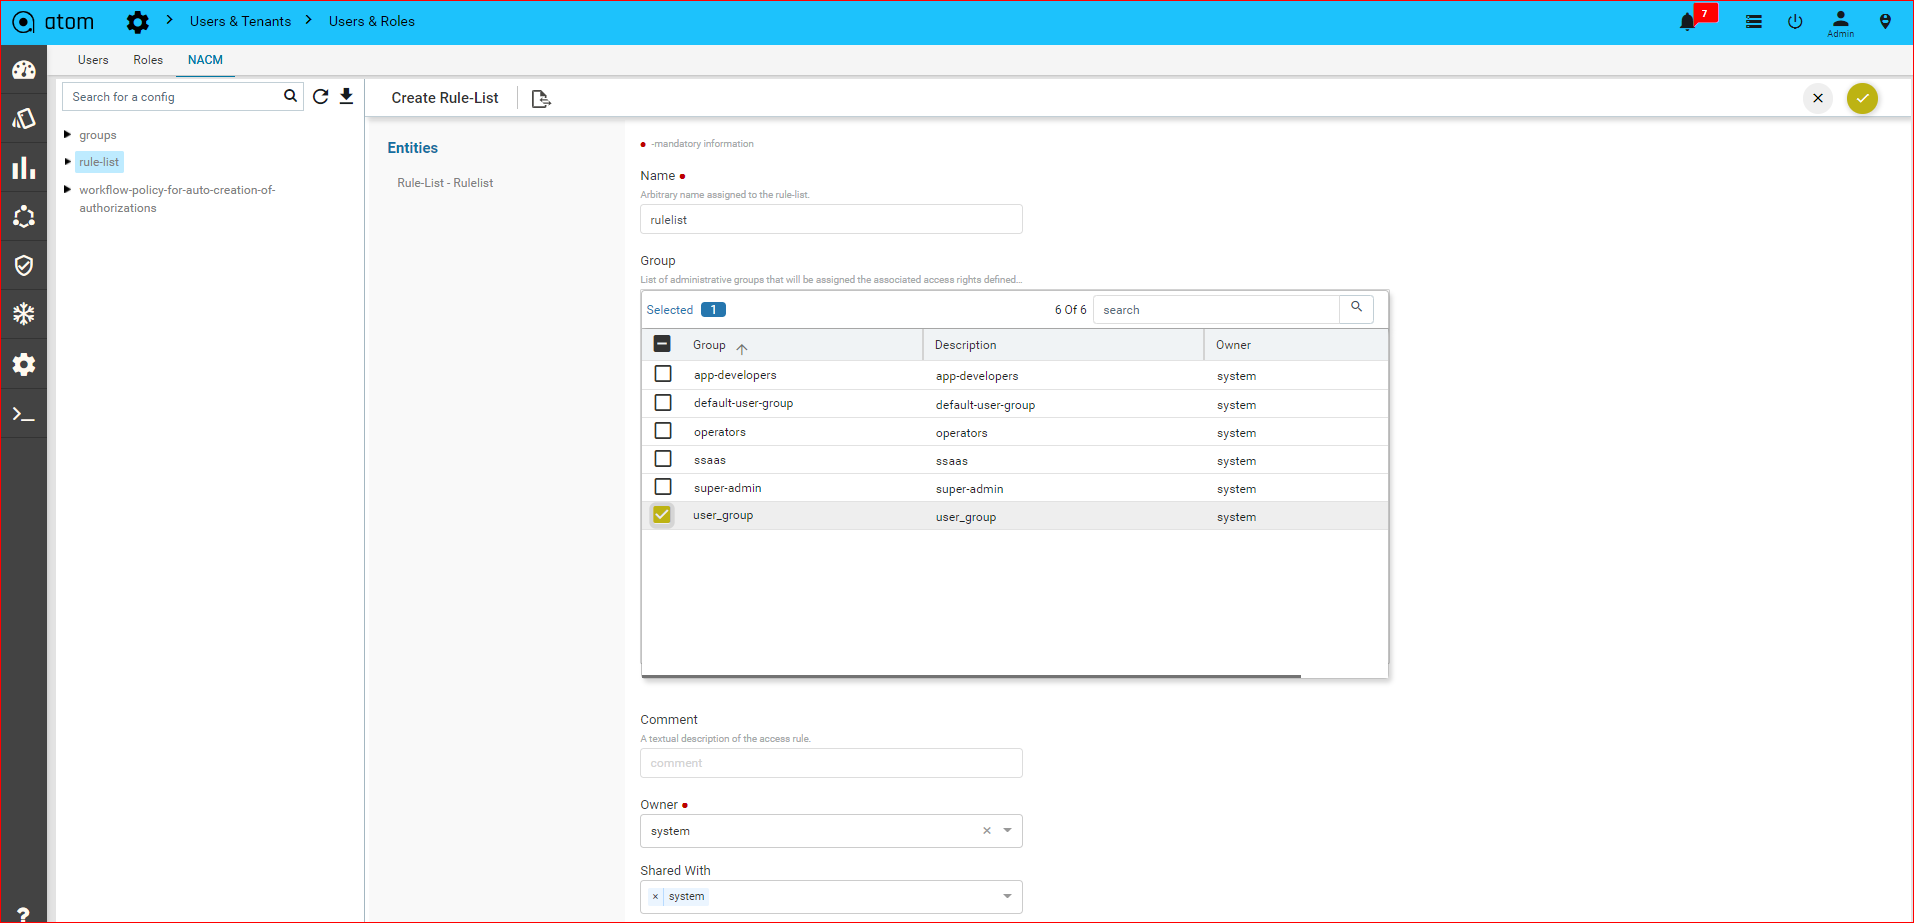
Creating Rule V2
Rules are the conditions that identify individual objects in the system. Rules also capture whether a user of a network object should be “granted” or “denied” RPC permission.
RPC : Choose a remote procedure call (RPC) on which the access control needs to be applied.
- Click the created Rule‐list > Entities > Rule V2 > Add(+)
- In the Create rule screen, enter values in the fields explained below:
Create a Rule v2, “rulev2” to be given the multiple RPCs in drop down Permit-RPC-Exec(Ex:Run device inventory, Extended inventory are etc) and Deny-RPC-Exec(Ex:Topology inventory, run dsl are etc)
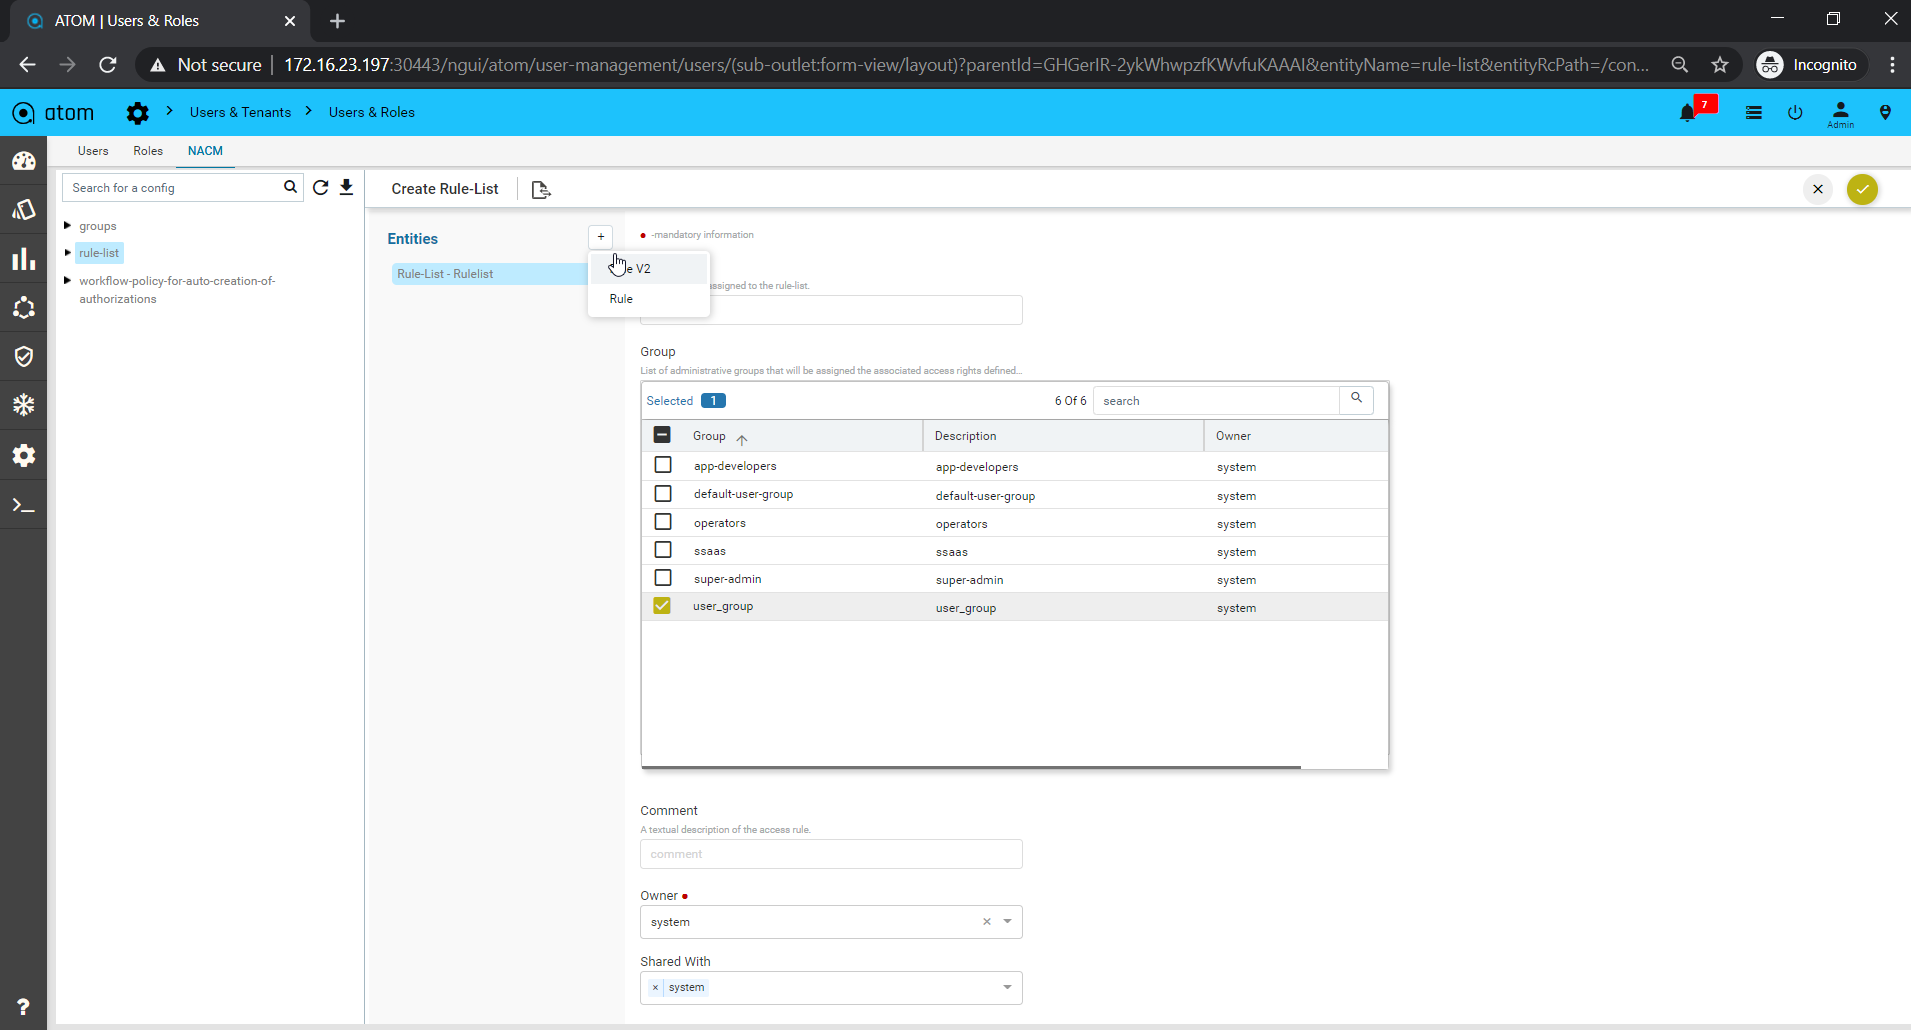
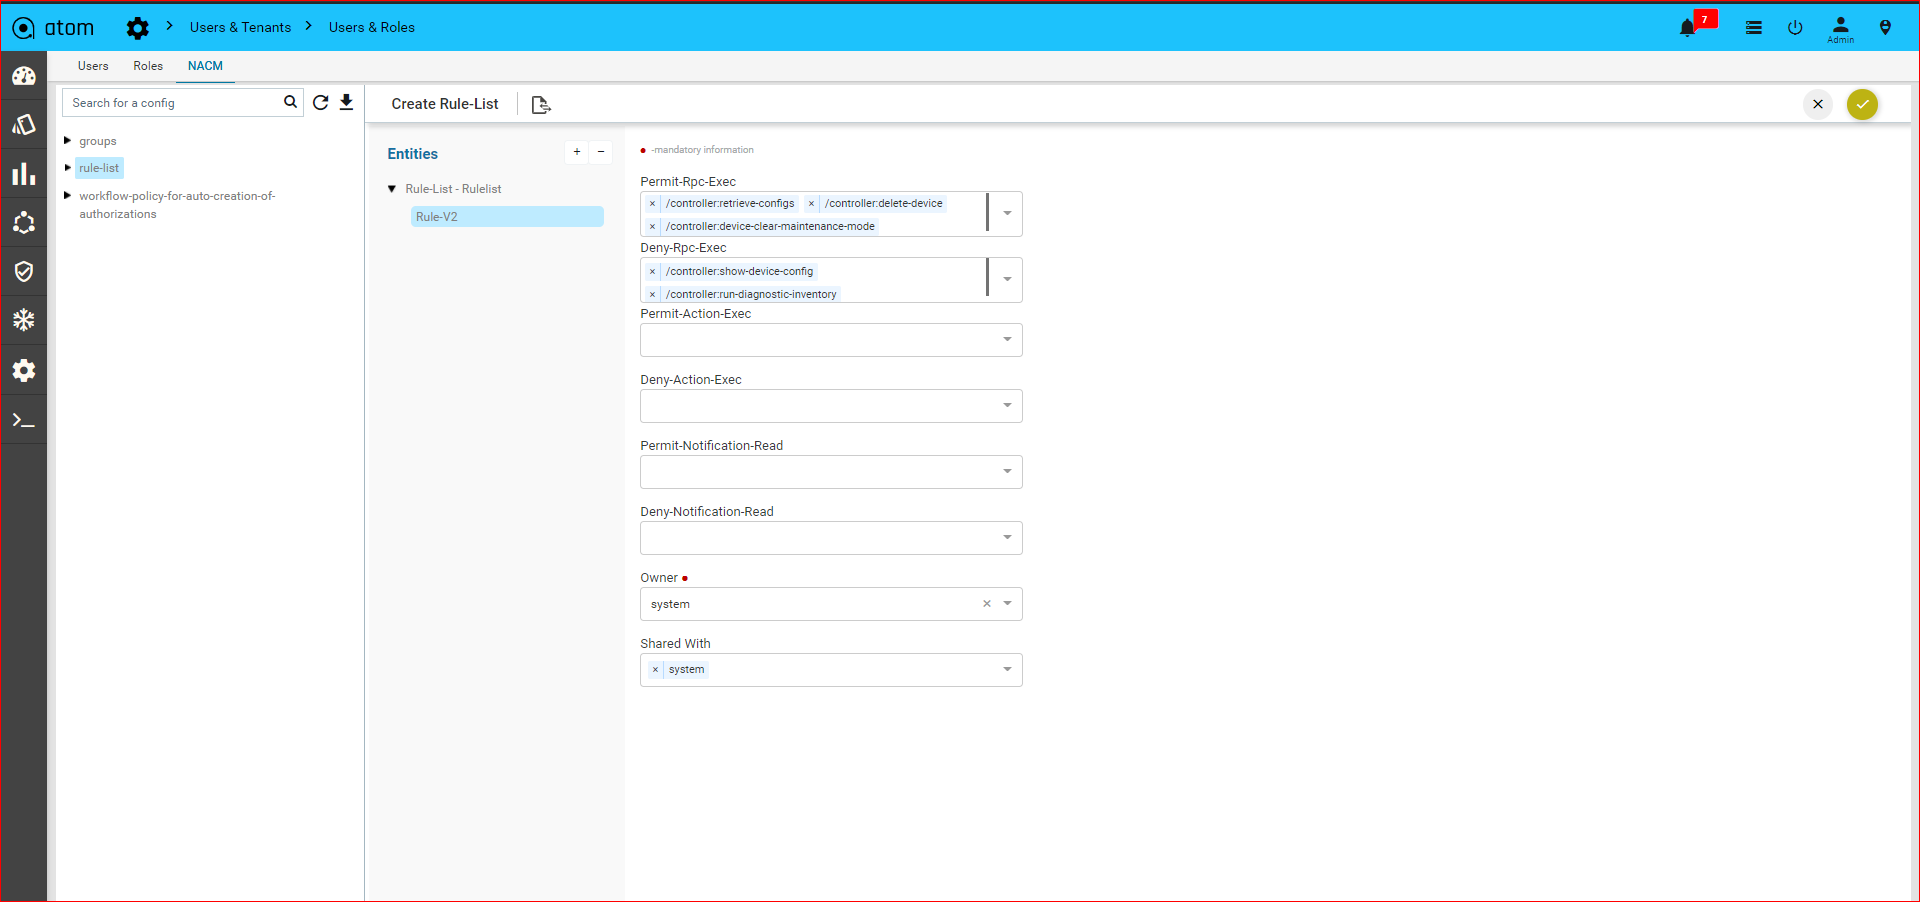
- Select a rule v2 that will be shown the below permit and deny data node,to grant either allow or deny access to the rule determined to match a particular request.
- Permit datanode
- Deny datanode
Click on rule v2 to add(+) permit data node to fill the below details
- Id :Enter string or number(Ex:2)
- Path : Enter the path of the object in the data tree on which the rule should be applied. This is applicable only for the rule type, ‘data-node’ Select the single or multiple Data node paths
- Access operations : Select any of the operations on the ATOM entity that needs to be controlled.
- * [This symbol indicates all the operations (Create, Update, Delete, Read) are included]
- Create read update delete
- Read create
- Read update
- Read delete
- Various operation to be tested
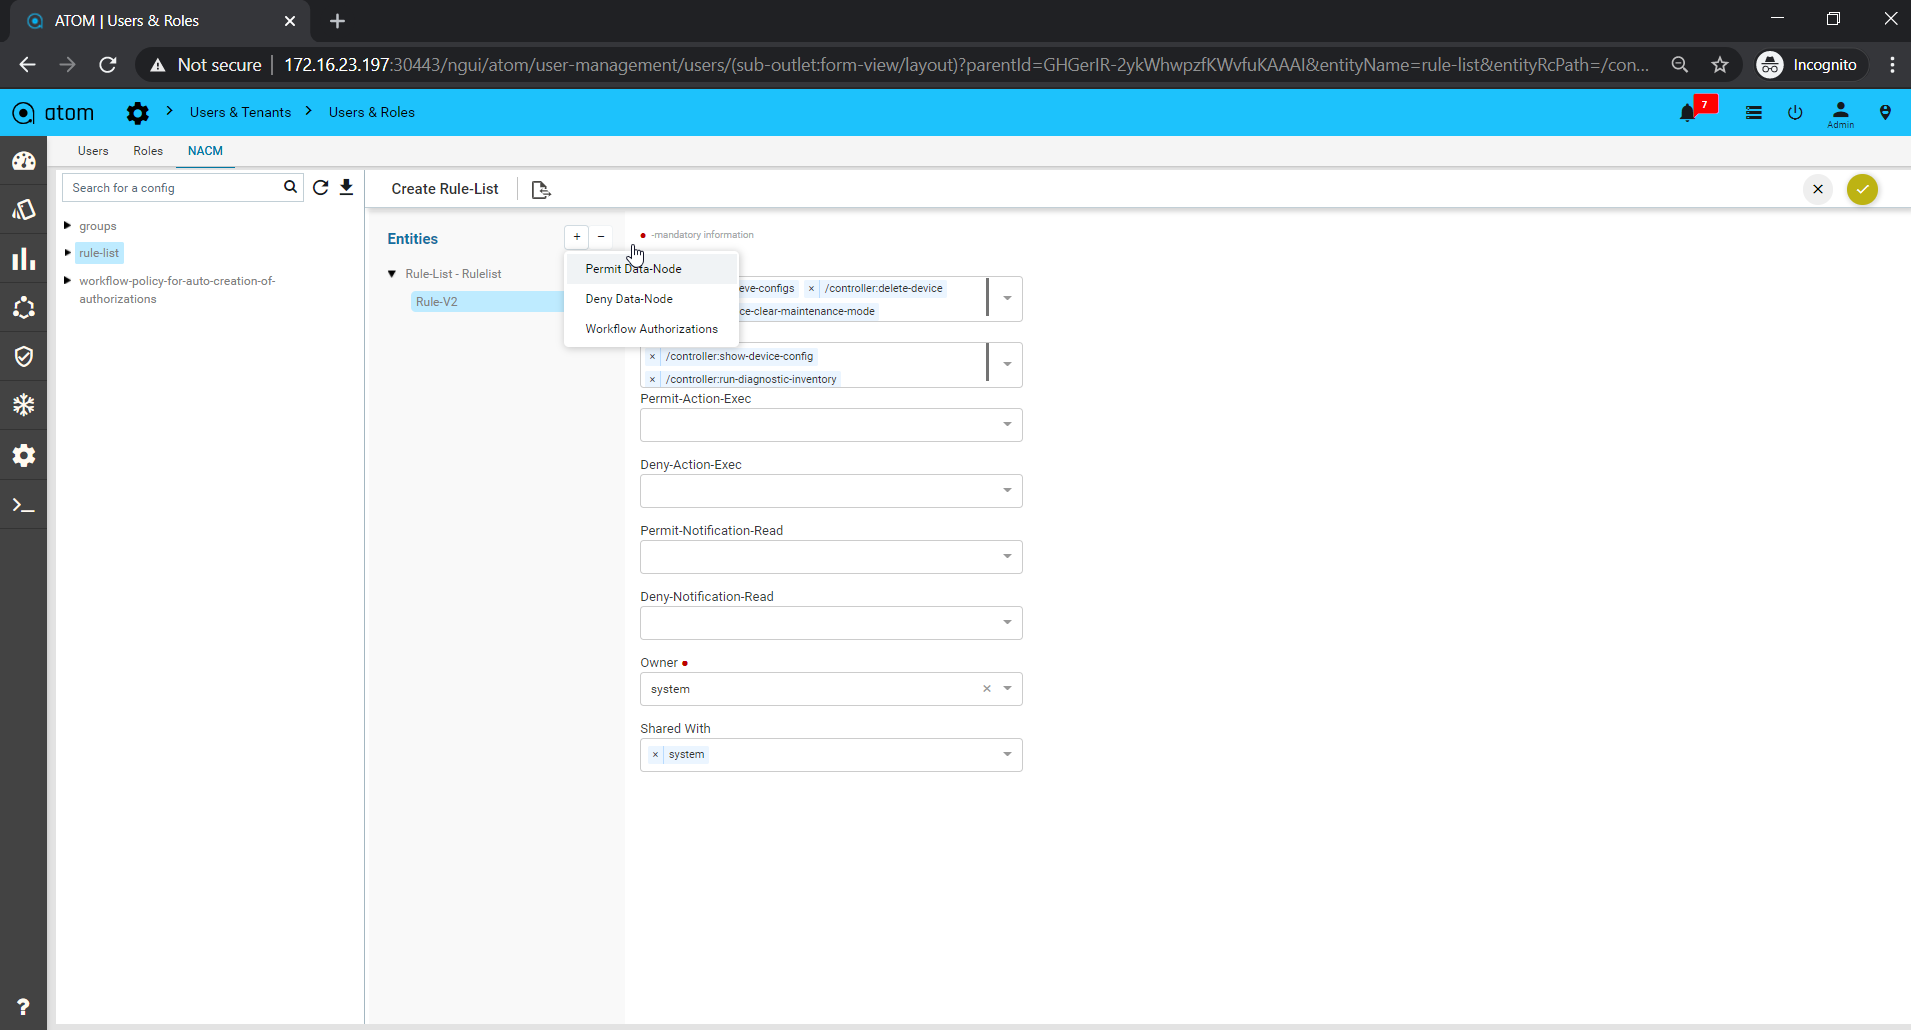
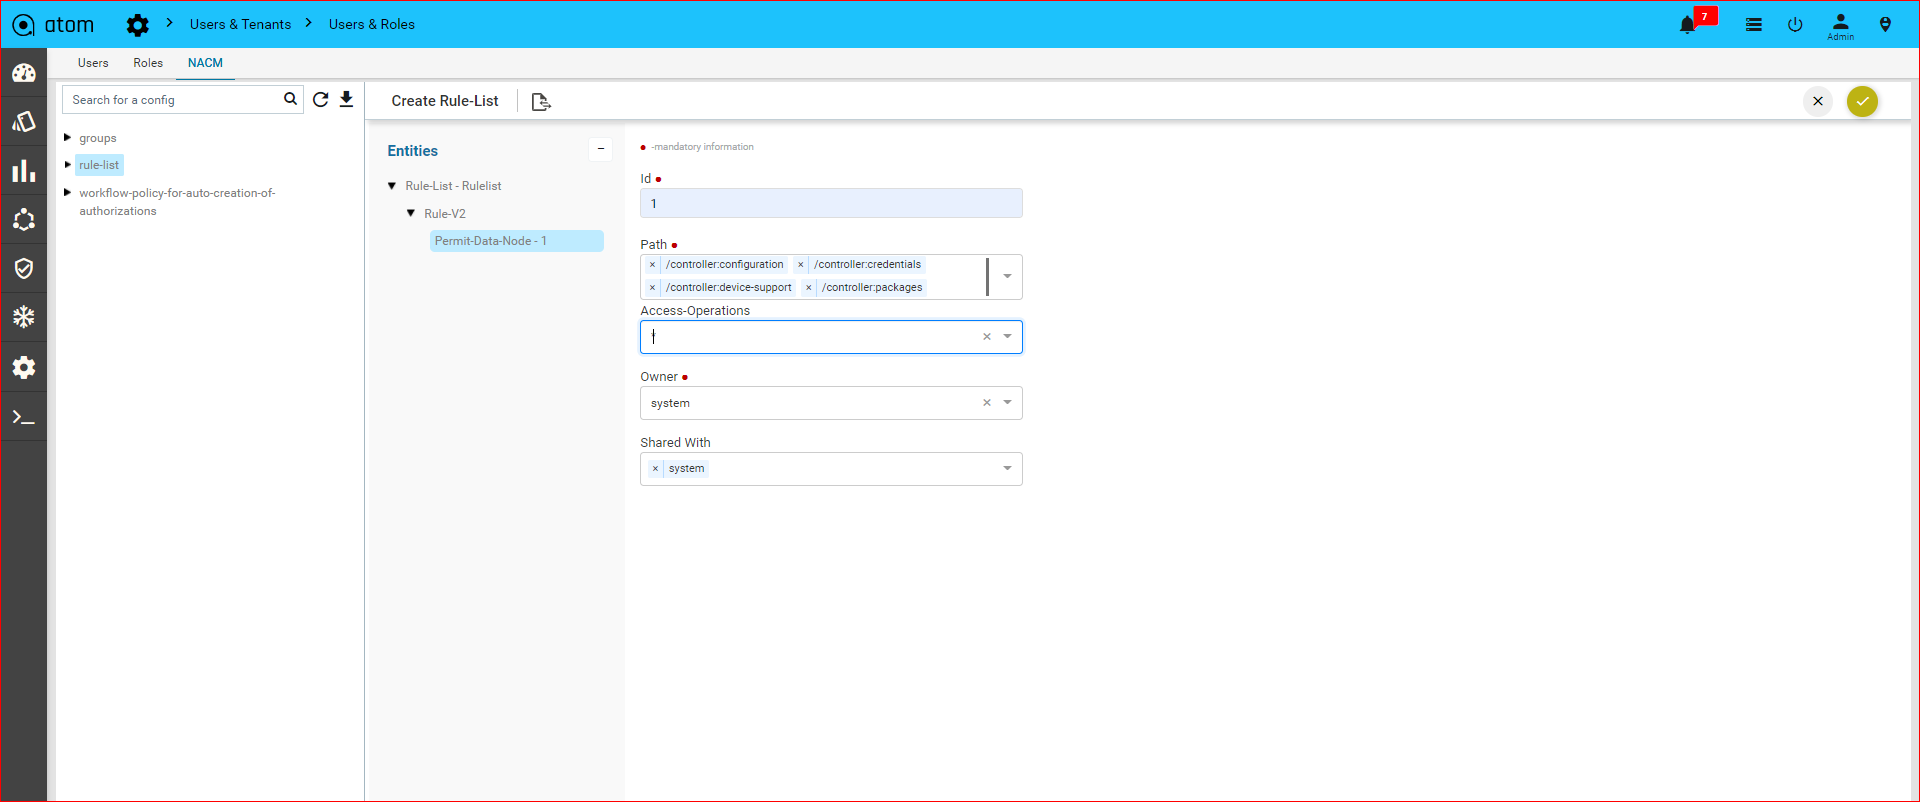
Click on rule v2 to add(+) deny data node to fill the below details
- Id :Enter string or number(Ex:3)
- Path : Enter the path of the object in the data tree on which the rule should be applied. This is applicable only for the rule type, ‘data-node’ Select the single or multiple Data node paths
- Access operations : Select any of the operations on the ATOM entity that needs to be controlled.
- * [This symbol indicates all the operations (Create, Update, Delete, Read) are included]
- Create read update delete
- Read create
- Read update
- Read delete
- Various operation to be tested
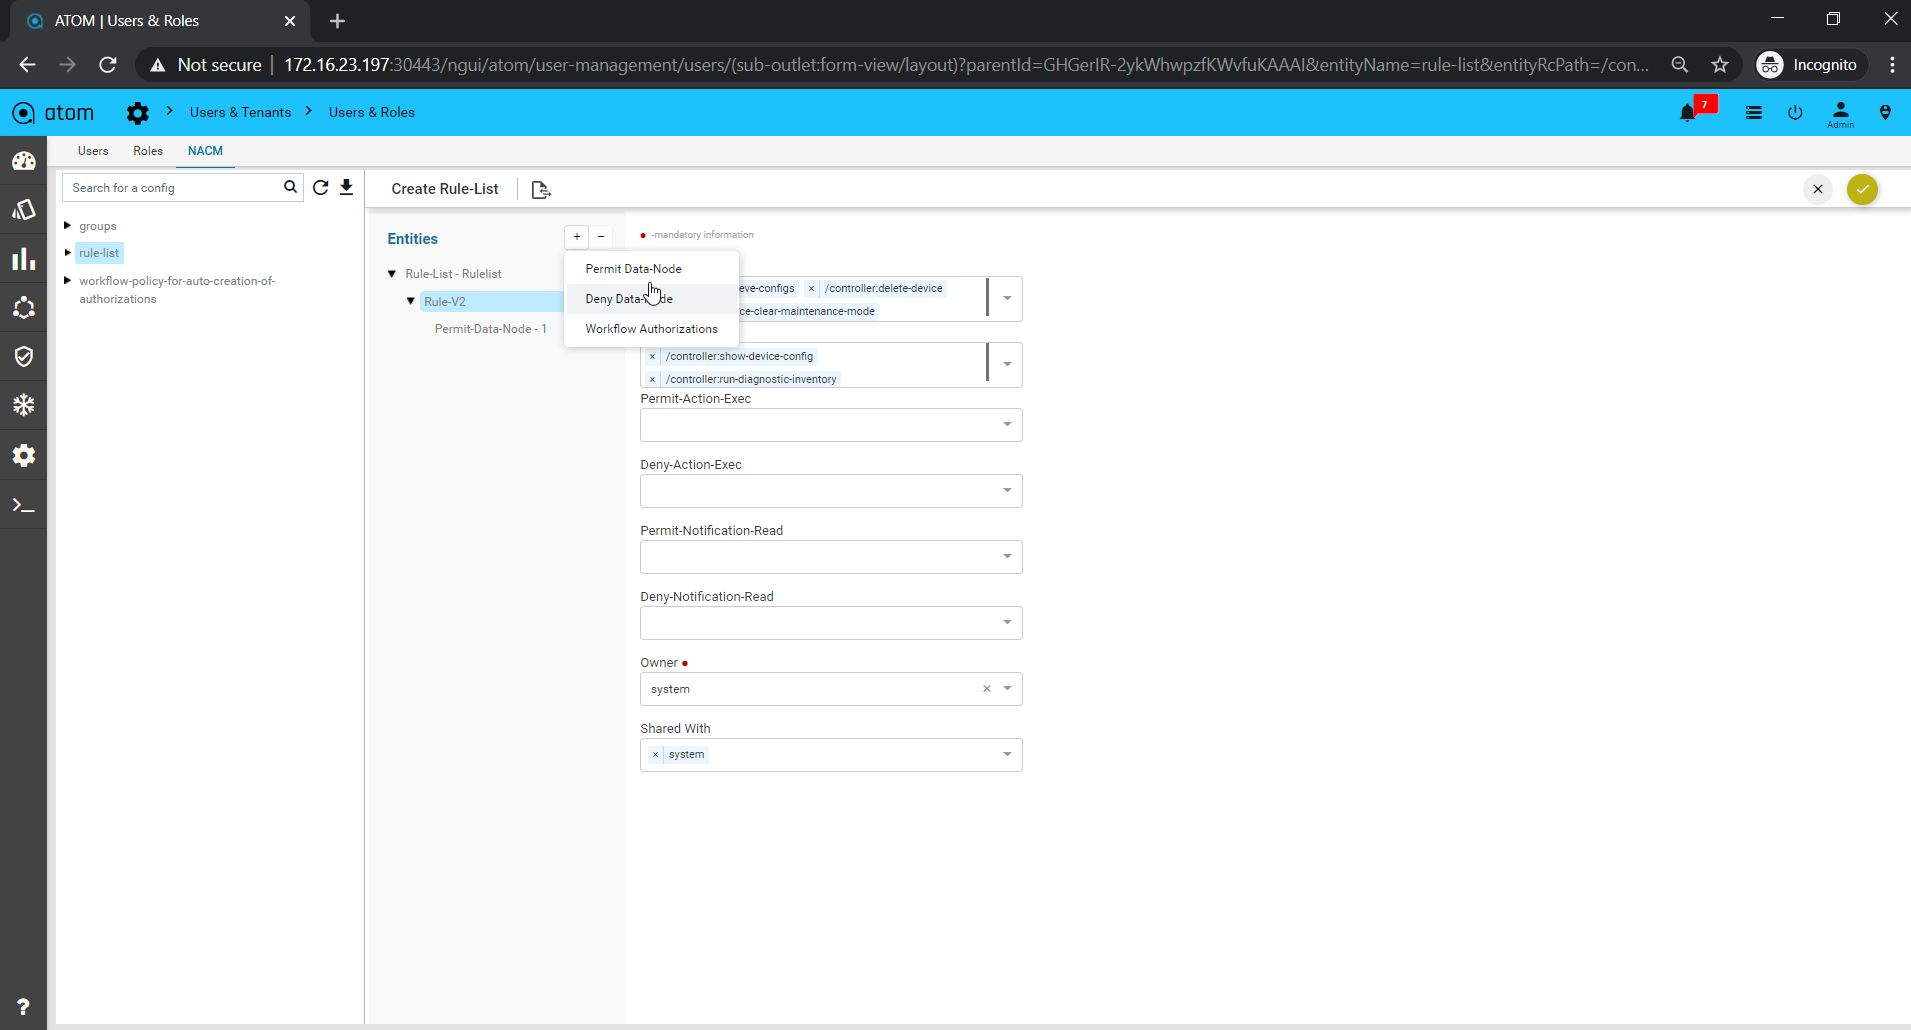
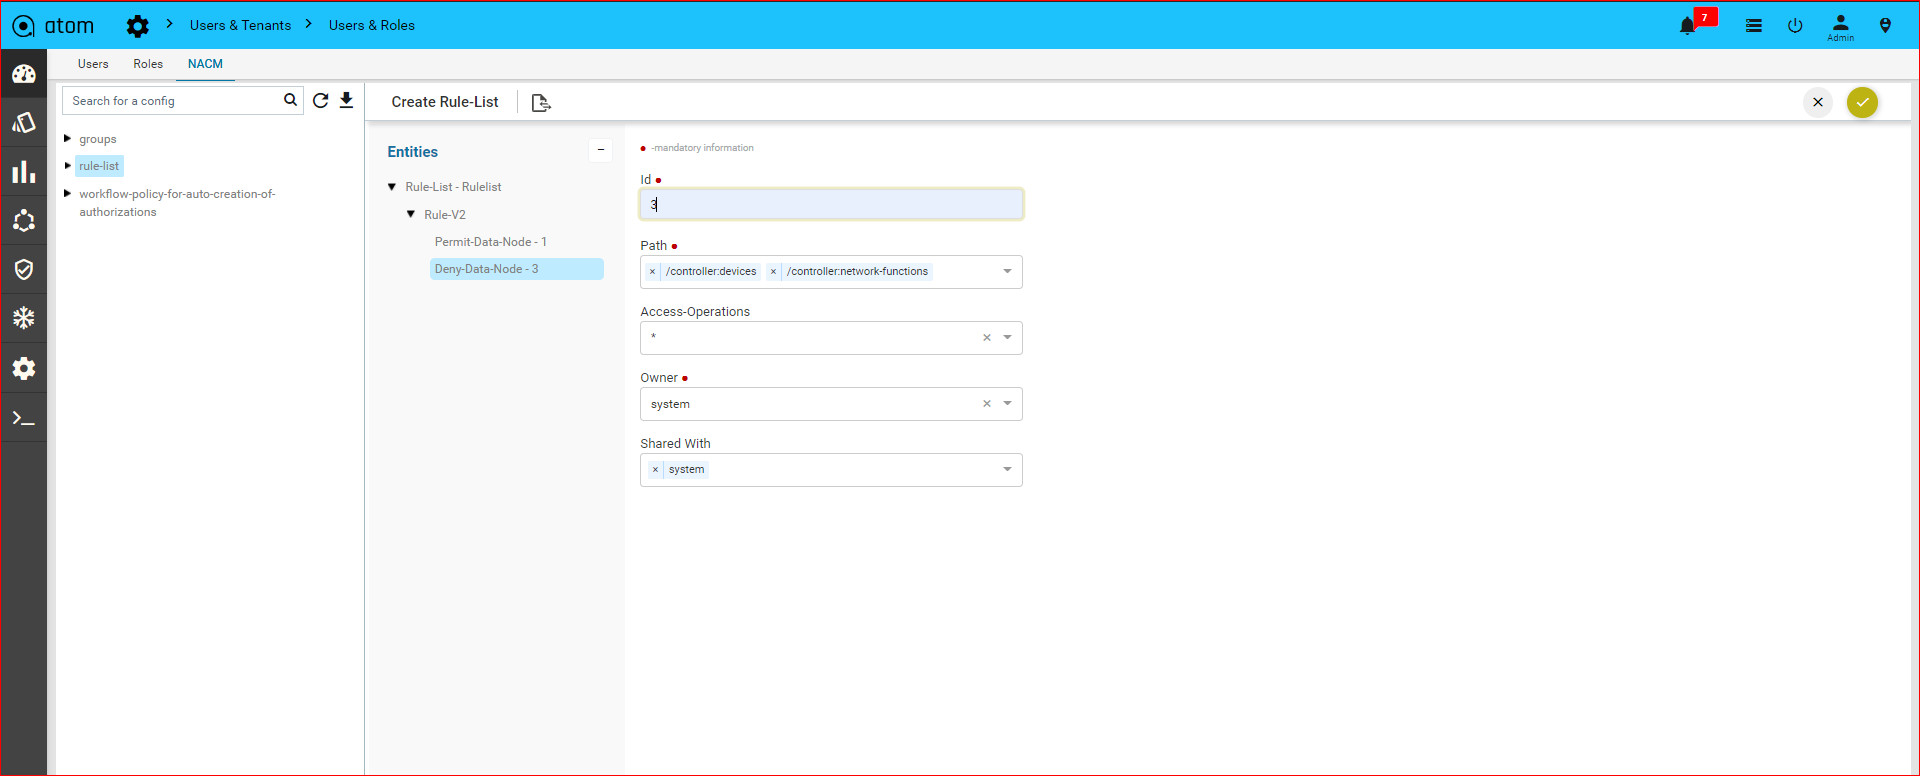
Workflow Authorization under rule v2:
Camunda allows users to authorize access to the data it manages. This makes it possible to configure which user can access which process instances, tasks, etc…If it is needed to customize those permissions for a specific workflow user
Deployment: The option is weather package is upload/load/unload and delete the package
Click on Workflow authorization to add(+) to fill the below details for Deployment
- Id :Id is the hardcoded
- Resource type : Select the resource type is Deployment
- Resource id : Select (*) from resource id drop down to be accessed by all packages or any specific package resource id.
- Grant type:
- Grant:Ranges over users and groups and grants a set of permissions. Grant authorizations are commonly used for adding permissions to a user or group that the global authorization revoked.
- Revoke::Ranges over users and groups and revokes a set of permissions. Revoke authorizations are commonly used for revoking permissions to a user or group that the global authorization grants.
- User group: You can select a subset of groups to mapped it.
- Permissions: A Permission defines the way an identity is allowed to interact with a certain resource. (ALL,Create, Read, Delete)
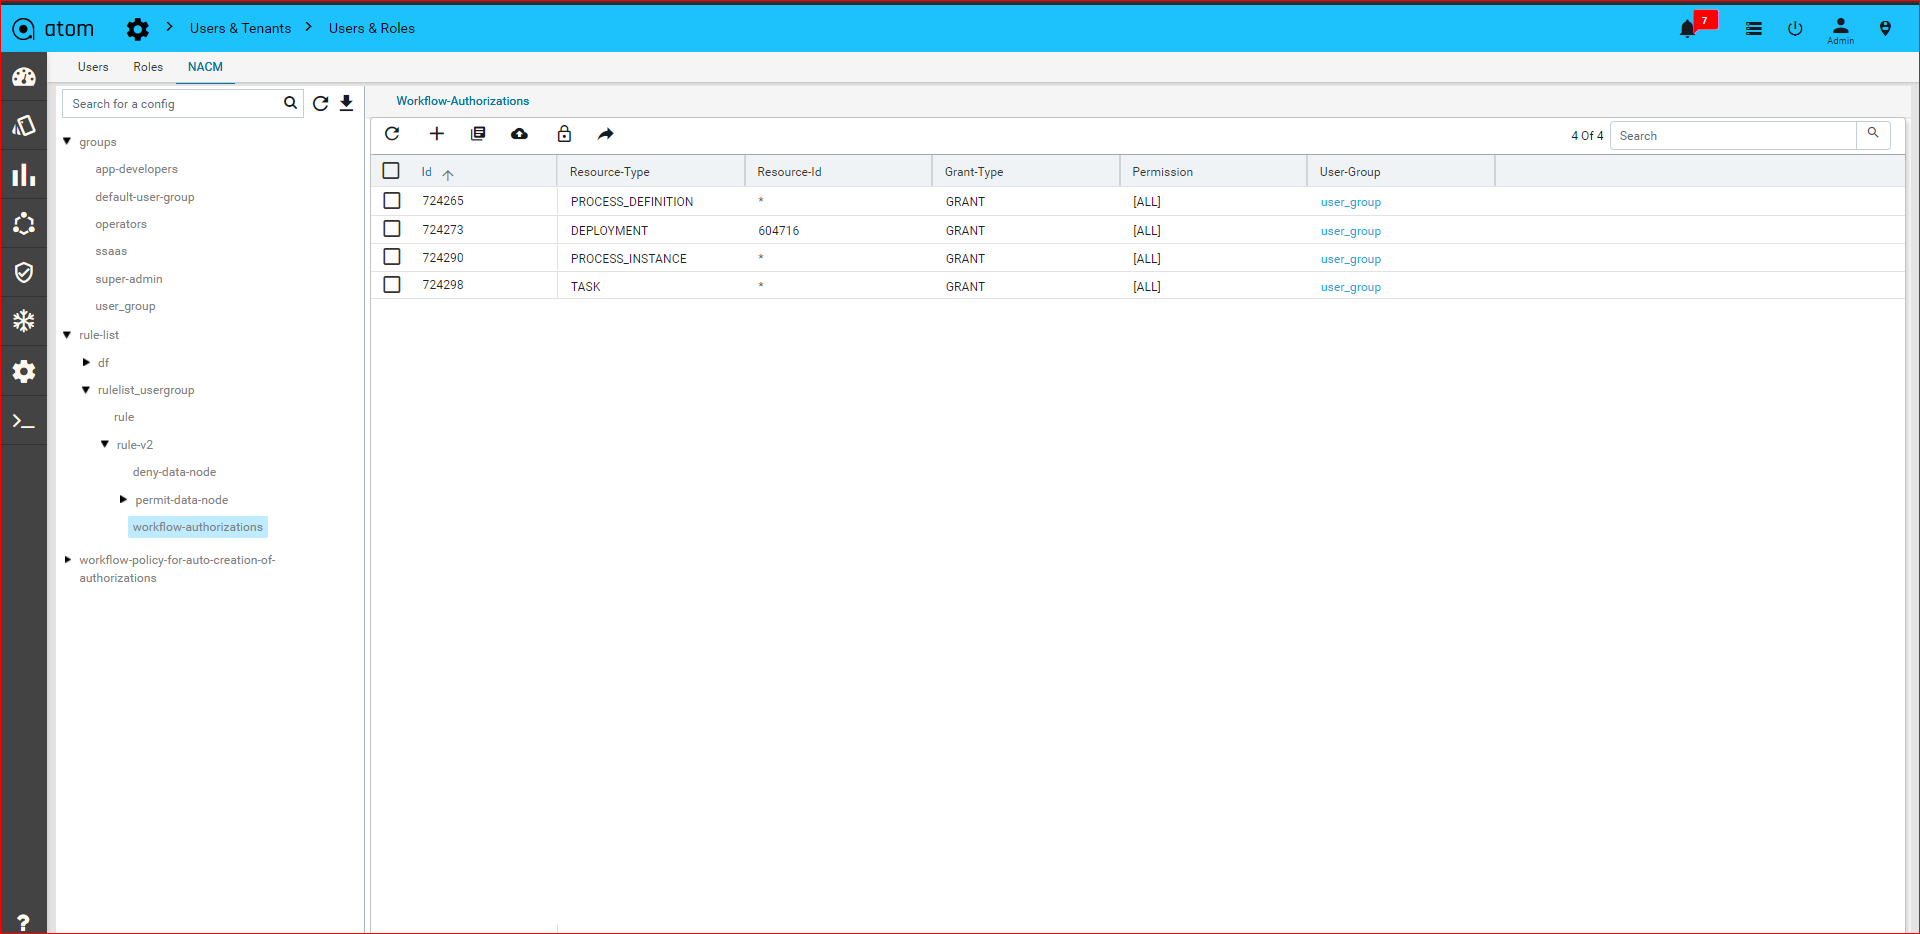
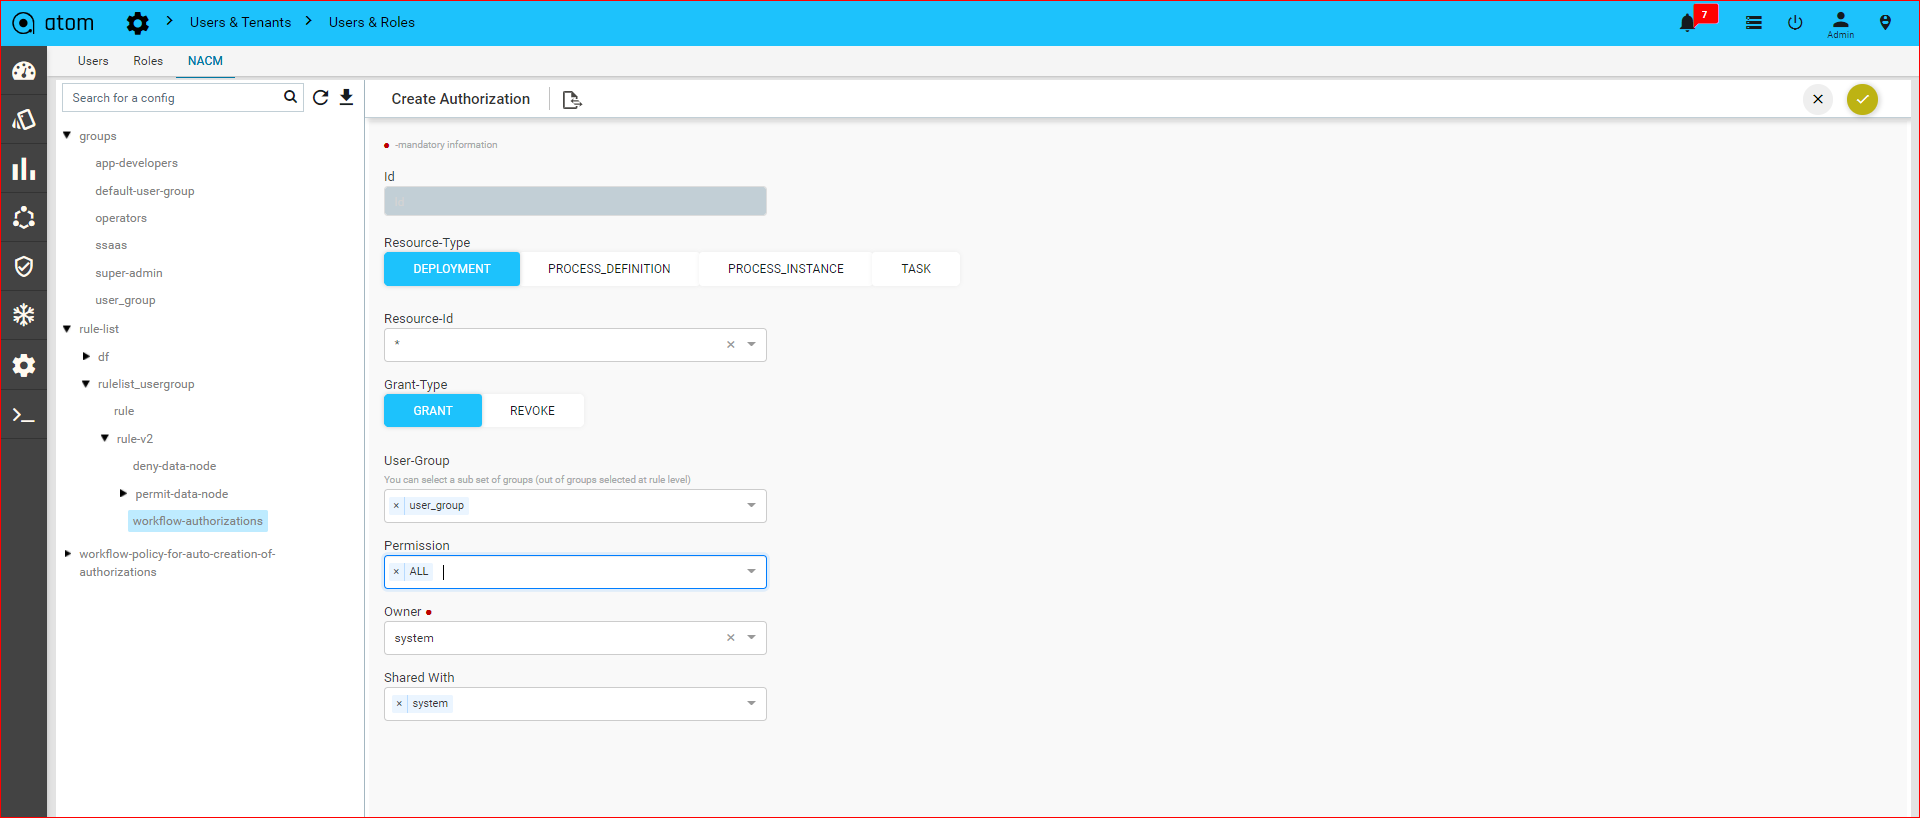
Process definition: This option is access the workflow grid with specific workflow or all based on given process definition
Click on Workflow authorization to add(+) to fill the below details for process definition
- Id :Id is the hardcoded
- Resource type : Select the resource type is process definition
- Resource id : Select (*) from resource id drop down to be accessed by all workflows or give any specific workflow of resource id.
- Grant type:
- Grant:Ranges over users and groups and grants a set of permissions. Grant authorizations are commonly used for adding permissions to a user or group that the global authorization revoked.
- Revoke::Ranges over users and groups and revokes a set of permissions. Revoke authorizations are commonly used for revoking permissions to a user or group that the global authorization grants.
- User group: You can select a subset of groups to mapped it.
- Permissions: A Permission defines the way an identity is allowed to interact with a certain resource.Choose the various permission (ALL,Create instance, Read, Delete- instance,Update-instance,update-history,Migrate-instance,Update-task-variable, Update-task)
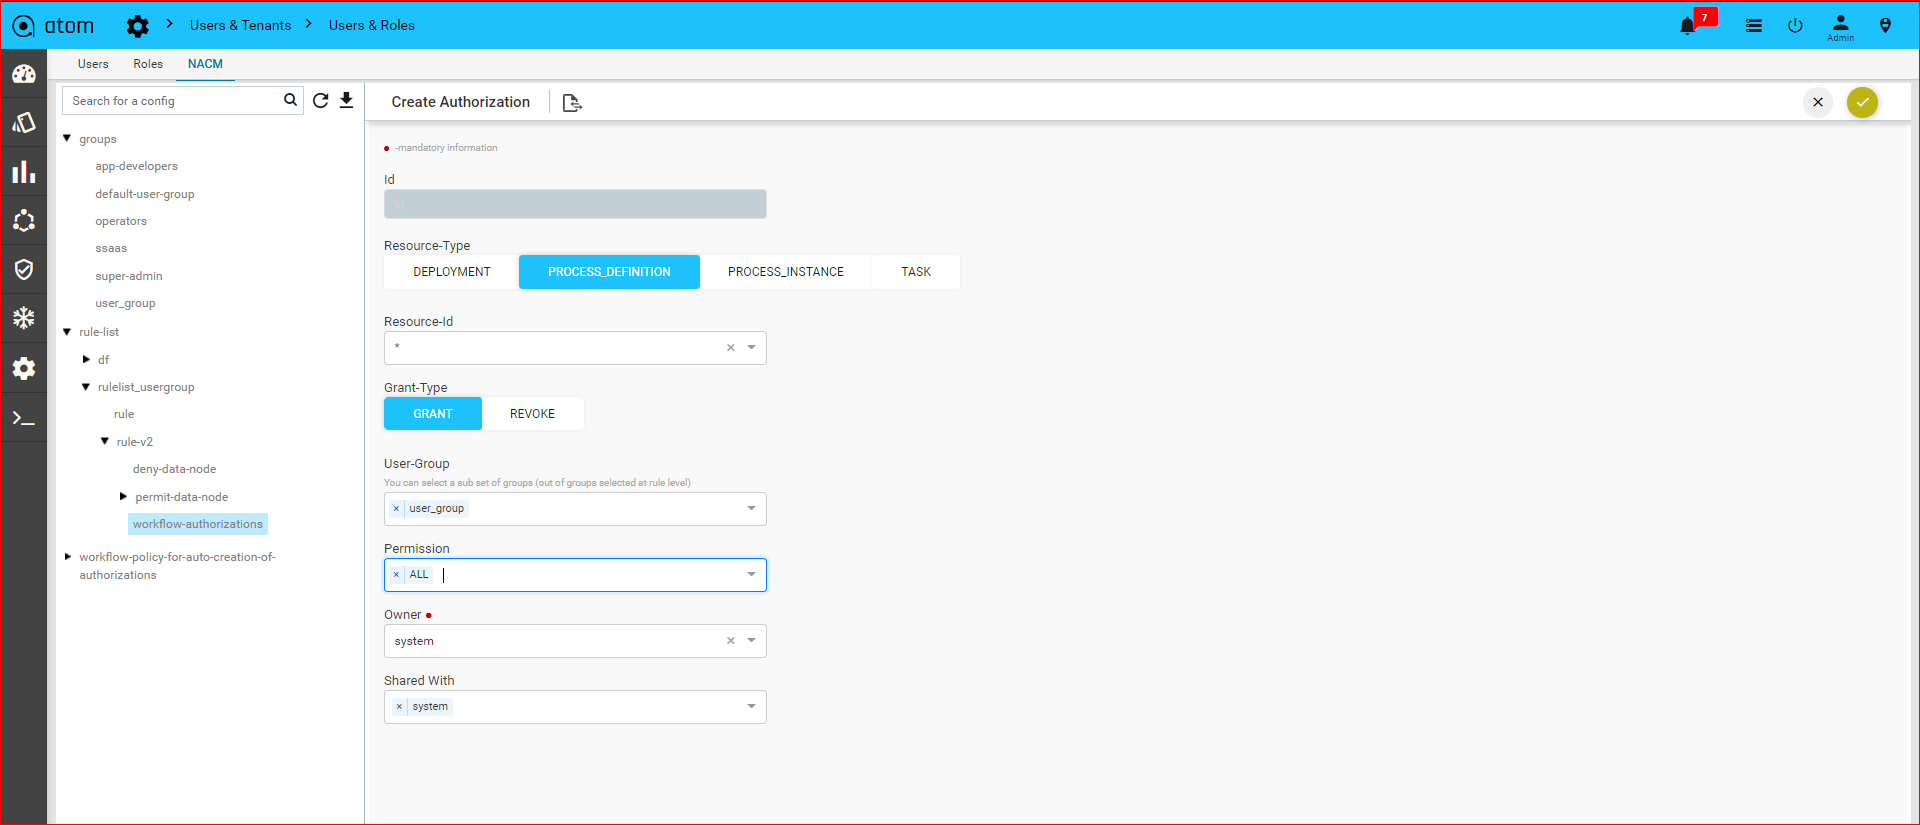
Workflow instance: This option is a workflow instance and is a running instance of a workflow definition.
Click on Workflow authorization to add(+) to fill the below details for Workflow instance
- Id :Id is the hardcoded
- Resource type : Select the resource type is Workflow instance
- Resource id : Select (*) from resource id drop down to be accessed by all workflow instances or any specific workflow instance of resource id.
- Grant type:
- Grant:Ranges over users and groups and grants a set of permissions. Grant authorizations are commonly used for adding permissions to a user or group that the global authorization revoked.
- Revoke::Ranges over users and groups and revokes a set of permissions. Revoke authorizations are commonly used for revoking permissions to a user or group that the global authorization grants.
- User group: You can select a subset of groups to mapped it.
- Permissions: A Permission defines the way an identity is allowed to interact with a certain resource. Choose the various permission(ALL,Create, Update,Read, Delete)
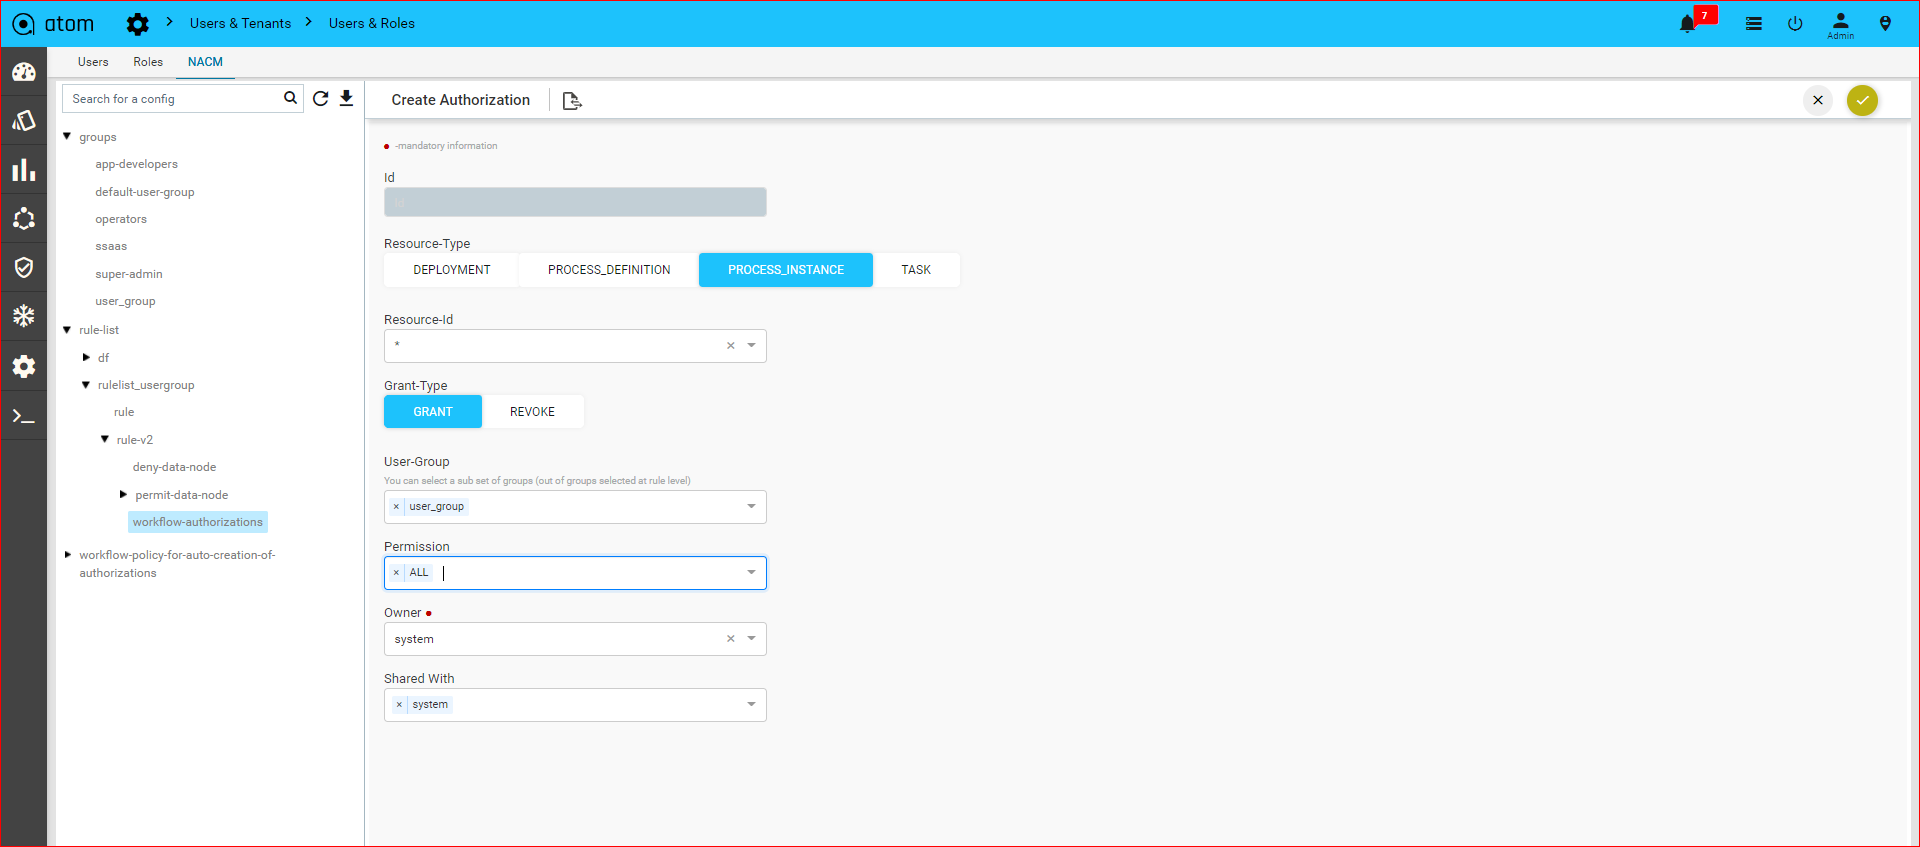
Tasks: This option is a user can perform different actions on a task, like assigning the task, claiming the task or completing the task. If a user has “Update” permission on a task (or “Update Task” permission on the corresponding process definition) then the user is authorized to perform all these task actions
Click on Workflow authorization to add(+) to fill the below details for Task
- Id :Id is the hardcoded
- Resource type : Select the resource type is Task
- Resource id : Select (*) from resource id drop down to be accessed by all workflow tasks or any specific workflow task of resource id.
- Grant type:
- Grant:Ranges over users and groups and grants a set of permissions. Grant authorizations are commonly used for adding permissions to a user or group that the global authorization revoked.
- Revoke::Ranges over users and groups and revokes a set of permissions. Revoke authorizations are commonly used for revoking permissions to a user or group that the global authorization grants.
- User group: You can select a subset of groups to mapped it.
- Permissions: A Permission defines the way an identity is allowed to interact with a certain resource.Choose the various permission(ALL,Create, Update,Read, Delete,Read-History,Task-Assign,Task-Work)
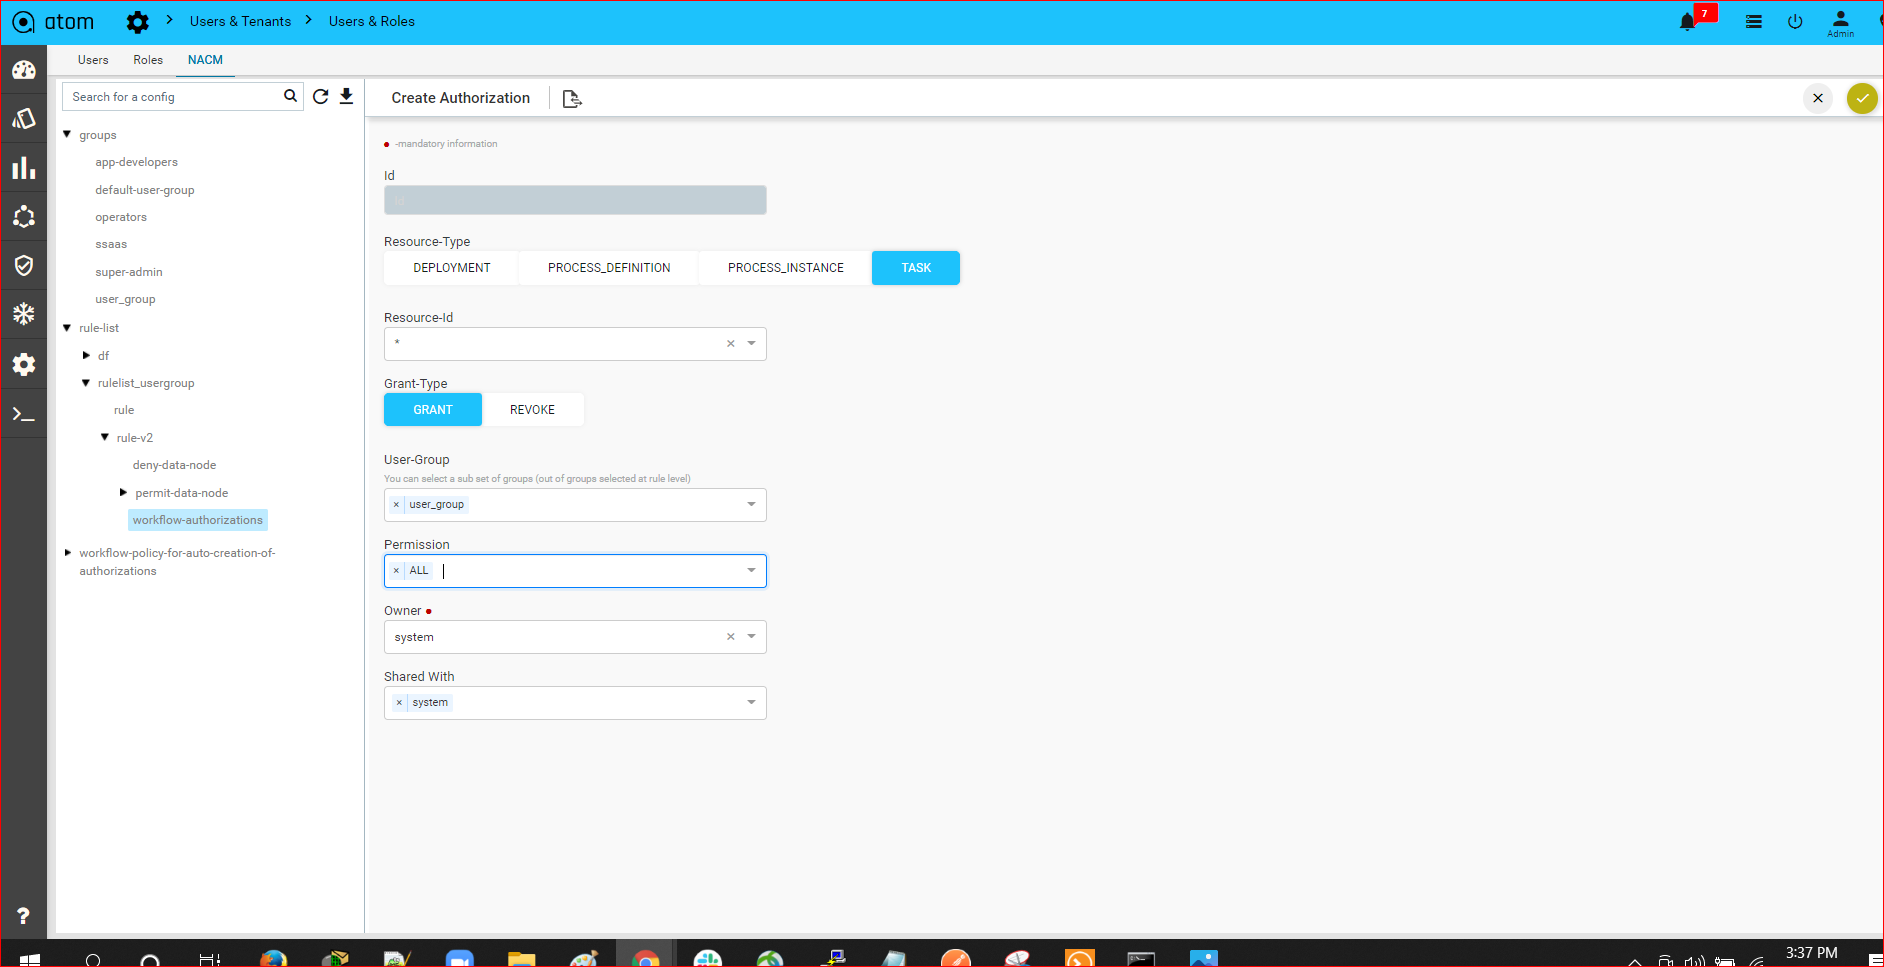
Note:: Need to be given the permit rpc exec in rule v2 based on given workflows & follow the workflow payload
| <output> <user-summary> <username>srikanth</username> <write-default>inherit-from-global</write-default> <read-default>inherit-from-global</read-default> <exec-default>inherit-from-global</exec-default> <roles/> <user-group> <name>group_disney</name> <rule-list> <name>rulelist_disney</name> <group>group_disney</group> <rule-v2> <permit-rpc-exec>/controller:retrieve-configs</permit-rpc-exec> <permit-rpc-exec>/controller:run-device-inventory</permit-rpc-exec> <permit-rpc-exec>/disney_ipv6_api:get-neighbor-devices</permit-rpc-exec> <permit-rpc-exec>/disney_ipv6_api:ipv6-junos-routing</permit-rpc-exec> <permit-rpc-exec>/disney_ipv6_api:isis-routing</permit-rpc-exec> <permit-rpc-exec>/disney_ipv6_api:servicemodel_update</permit-rpc-exec> <permit-rpc-exec>/disney_ipv6_config:append-task-details</permit-rpc-exec> <permit-rpc-exec>/disney_ipv6_config:execute-command</permit-rpc-exec> <permit-rpc-exec>/disney_ipv6_config:ipv6-addition</permit-rpc-exec> <permit-rpc-exec>/disney_ipv6_config:ipv6-routing</permit-rpc-exec> <permit-rpc-exec>/configarchive:config-diff</permit-rpc-exec> <workflow-authorizations/> <permit-data-node> <id>1</id> <access-operations>read create update delete</access-operations> <path>/ipam:ipv6-pools</path> </permit-data-node> <permit-data-node> <path>/controller:devices</path> <id>2</id> <access-operations>*</access-operations> </permit-data-node> </rule-v2> </rule-list> <group-level-workflow-authorizations> <authorization>ID:3585112 GRANT PROCESS_DEFINITION ipv6_configs [ALL]</authorization> <authorization>ID:3591653 GRANT PROCESS_DEFINITION interface_ipv6_configuration [ALL]</authorization> <authorization>ID:3610357 GRANT PROCESS_DEFINITION ipv6_routing_configuration [ALL]</authorization> <authorization>ID:3611232 GRANT PROCESS_DEFINITION bgp_peer_configuration [ALL]</authorization> <authorization>ID:3585054 GRANT PROCESS_INSTANCE * [ALL]</authorization> </group-level-workflow-authorizations> </user-group> <user-level-workflow-authorizations/> </user-summary> </output> |
Integrating ATOM with Central Authentication Systems
By integrating with central authentication systems such as LDAP, AD or TACACS, the users created in these servers can login to ATOM using their credentials created in their respective servers.
Managing Active Directory Users
You can import users of Active Directory into ATOM and manage them as other users of ATOM.
For secure communication between the AD server and ATOM, import the security certificate into ATOM.
- Navigate to Administration >Users & Tenants > Active Directory
- In the Create Active Directory screen, enter the following:
-
- URL: Enter the URL address of the Active Directory(Ex:ldap://172.16.2.223)
- Domain: Enter the name of the domain(Ex:anutadev.com)
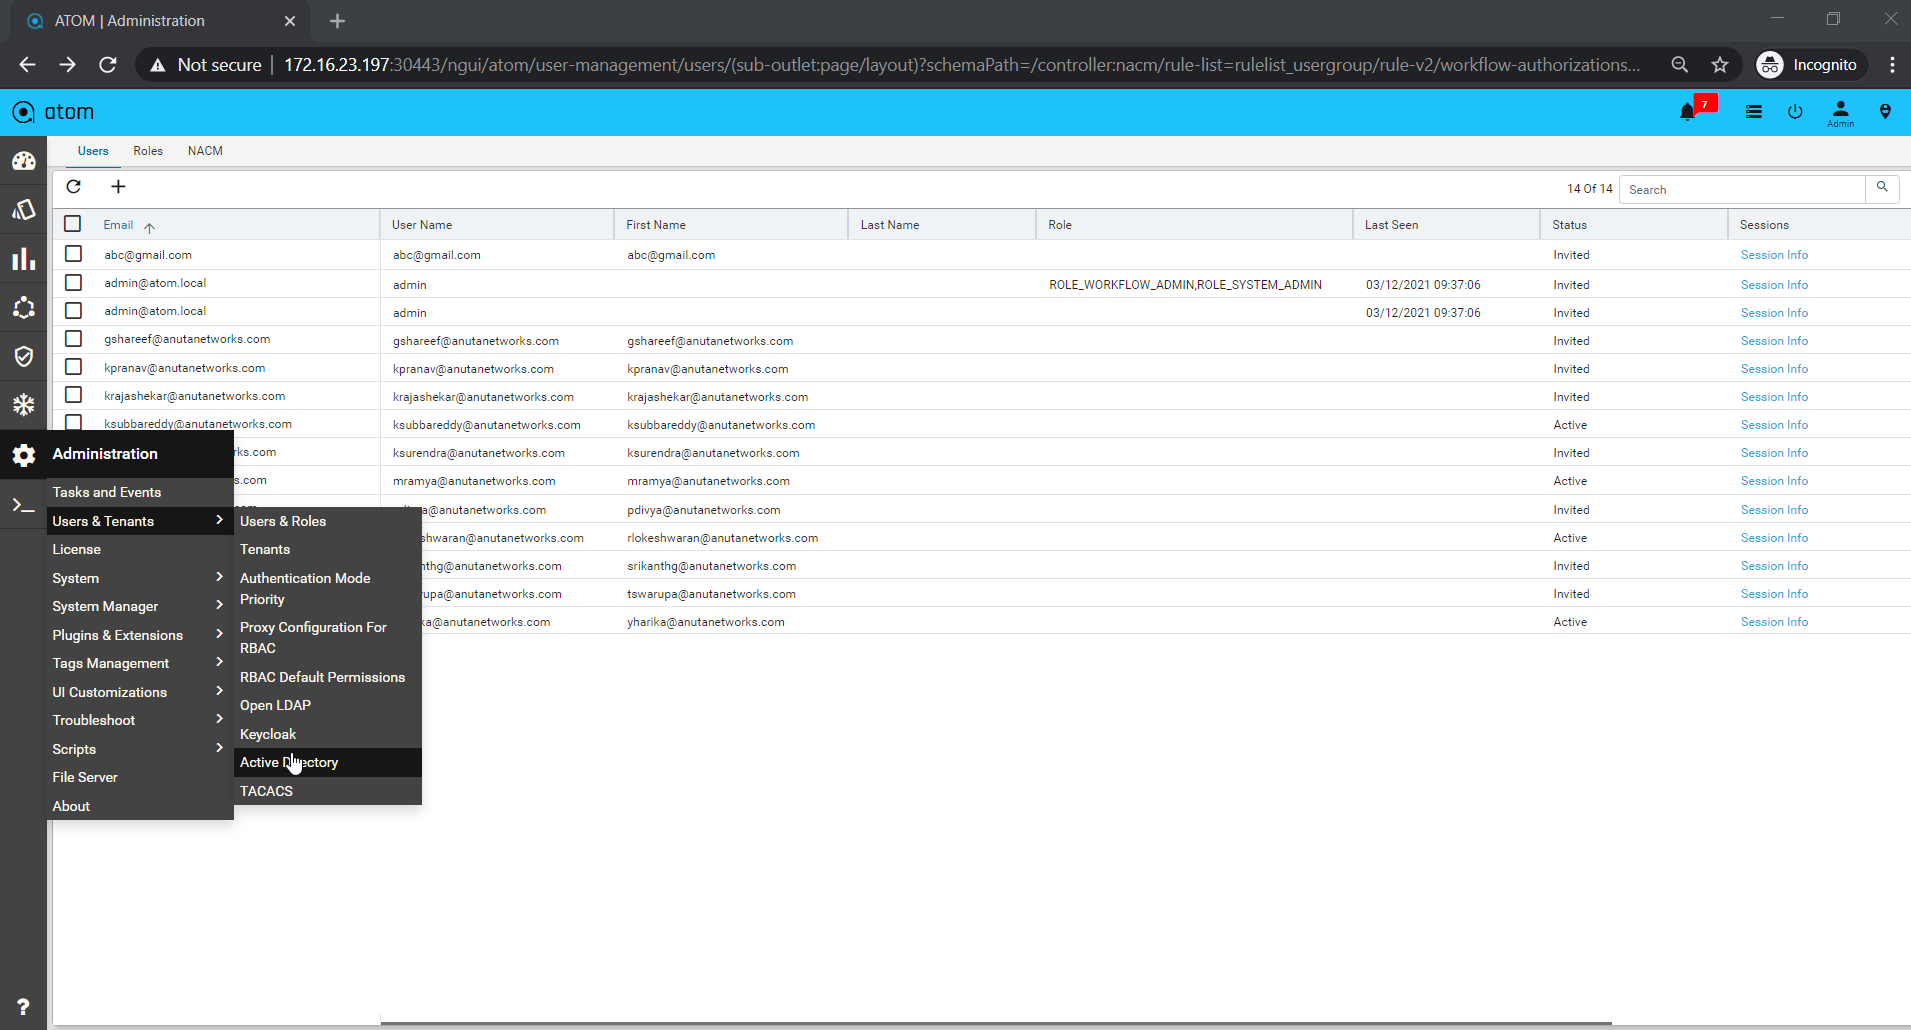
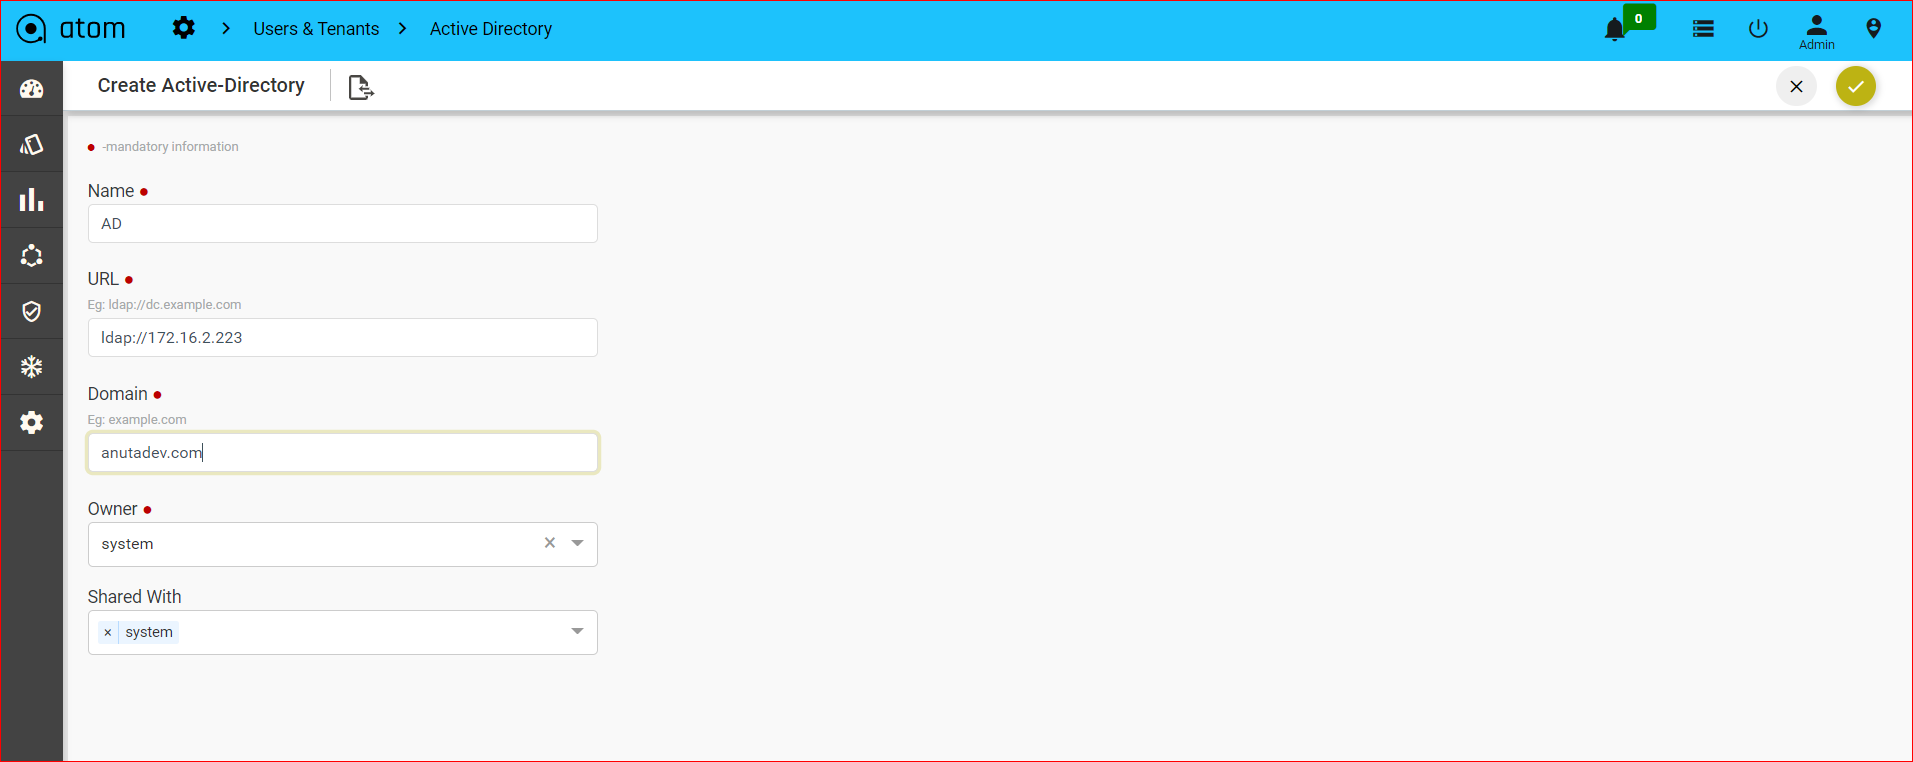
-
- Click Test Connectivity to test the connection between the ATOM and the AD servers.
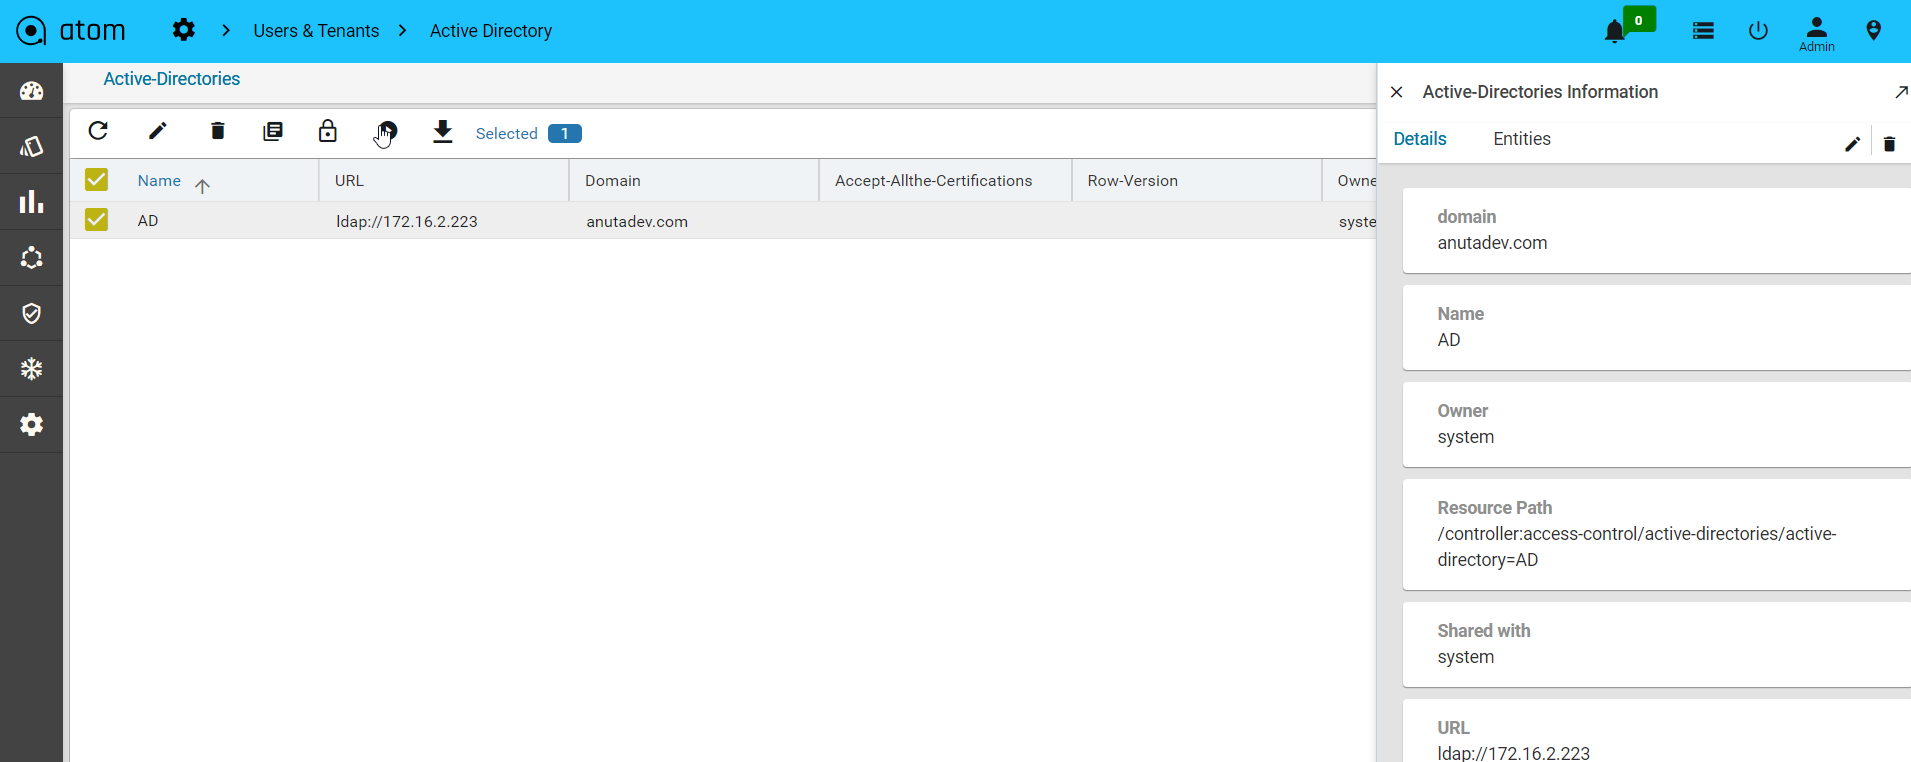
Managing OpenLDAP Users
You can import the existing LDAP users and user groups of a tenant, thus enabling the tenant users to login to ATOM using their LDAP credentials.
Importing OpenLDAP Users
Before you begin, ensure that the following conditions are met with:
- Users and groups are created in the LDAP server
- OpenLDAP users are created as Tenants in ATOM
To create LDAP users in ATOM:
- Navigate to Administration > Users & Tenants > OpenLDAP
- Click Add
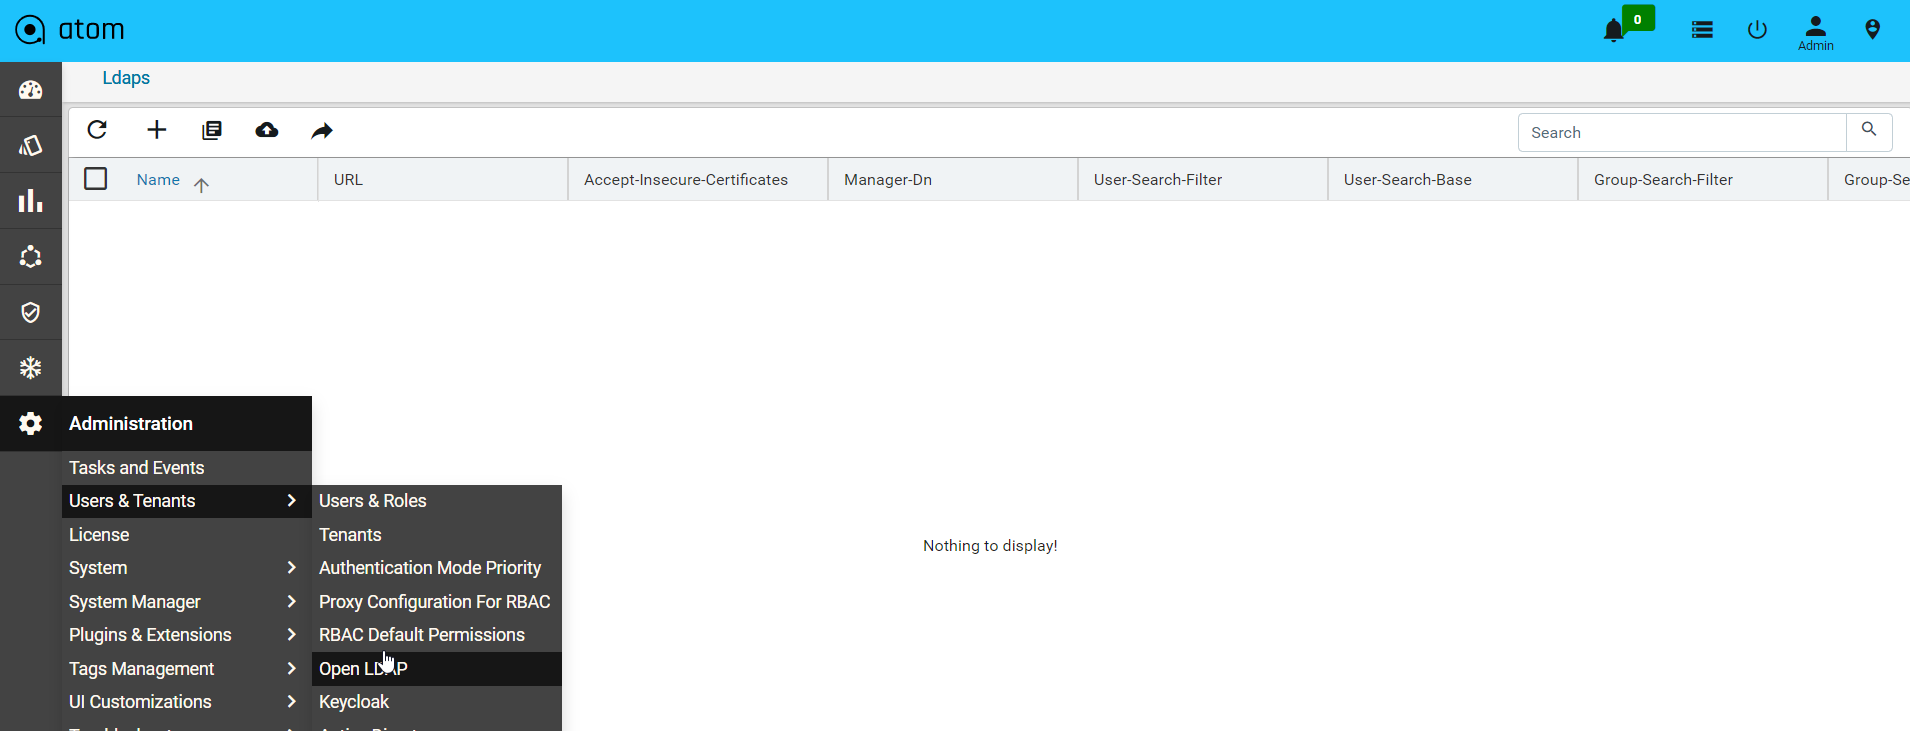
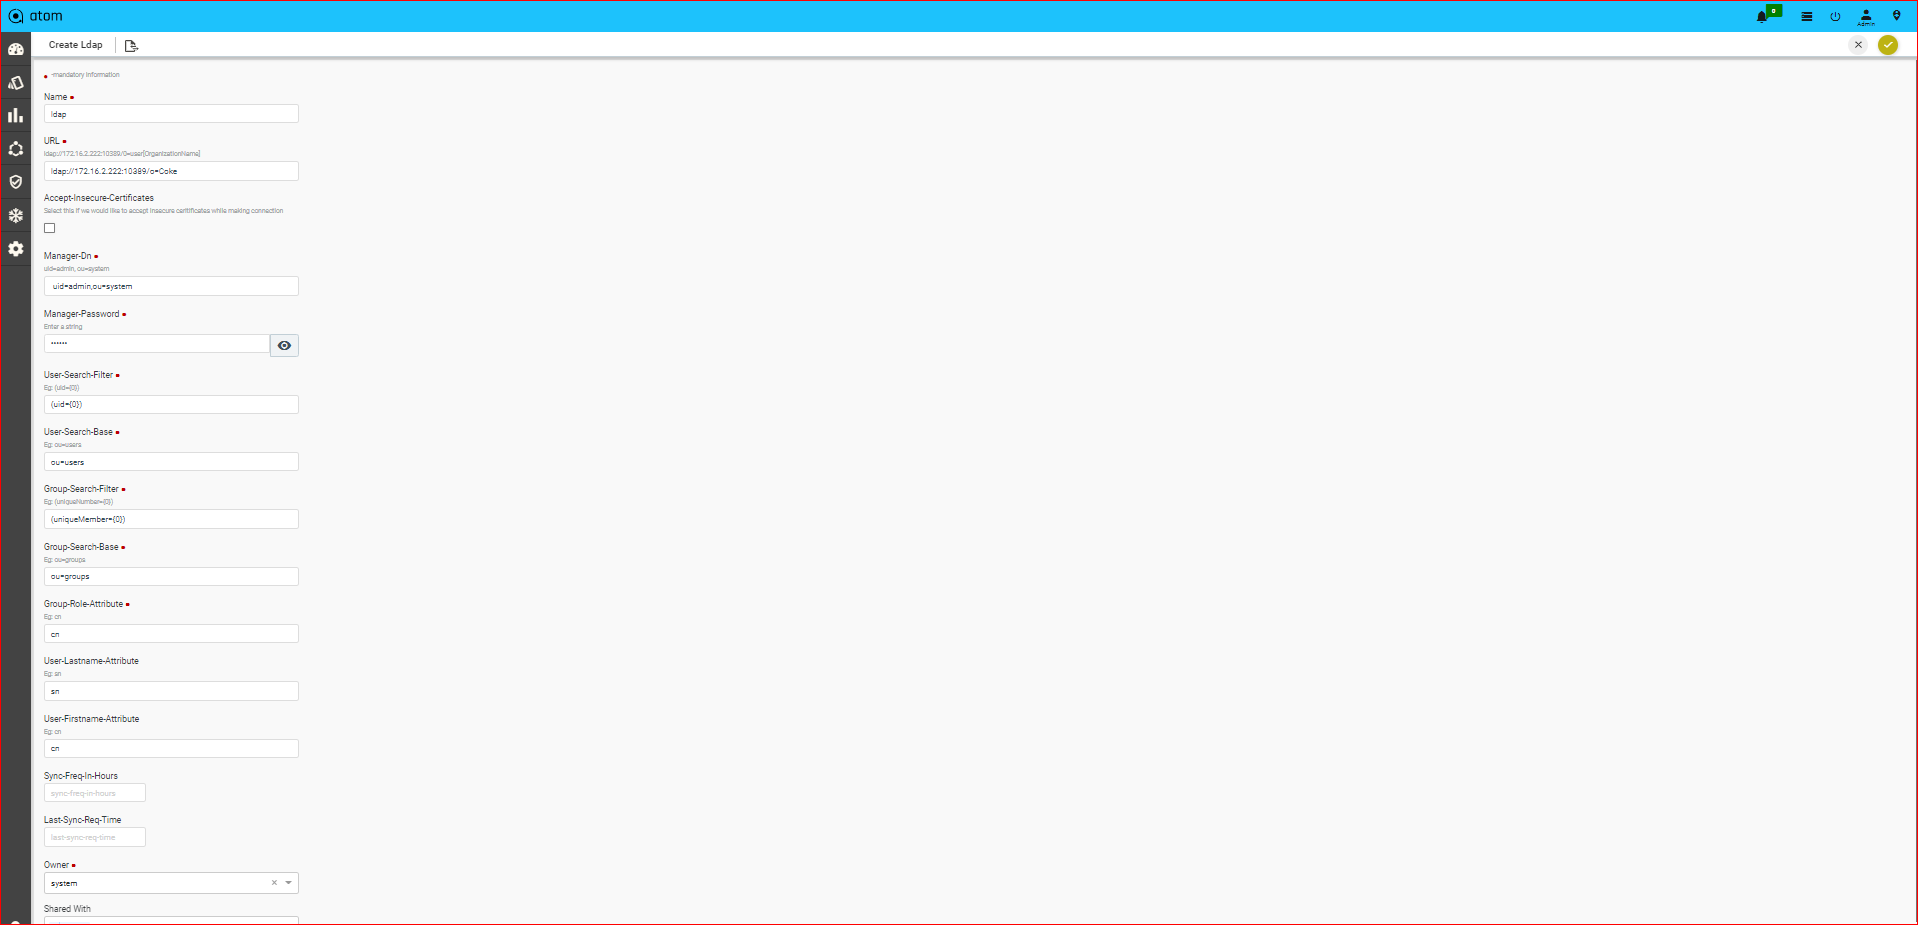
- In the Create OpenLDAP screen, enter the values in the following fields:
- URL: Enter the LDAP URL of the tenant. Include port number and base distinguished name (DN)
Example: “ldap://localhost:10389/o=nCloud”
- Manager Dn: Type the distinguished name (DN) of LDAP manager. This manager should have at least read permission.
Example: “uid=admin, ou=system”
- Manager Password: Type a password for the entered DN. Example: secret
- User Search Filter: Specify a search filter. This field determines the query to be run to identify the user record. Always include a query in brackets ‘(‘ ‘)’. Example: “(uid={0})”
- User Search Base: Specify a relative DN (from the root/base DN) where users are located. Example: “ou=users”
NOTE: In LDAP, {0} is a placeholder (token) for login user ID.
- Group Search Filter: This field determines the query to be run to identify the user in a group. Always include a query in brackets ‘(‘ ‘)’. Example: “(uniqueMember={0})”
- Group Search Base: Specify a relative DN (from the root/base DN) where user groups are located. Example: “ou=groups”
- Group Role Attribute: Specify the attribute name of role in a group. Example: “cn”
- User-Lastname Attribute: Attribute that contains user’s last name. Example: “sn”
- User- Firstname Attribute: Attribute that contains user’s first name. Example: “cn”
- Sync-Freq-in-Hours: Type the interval, in hours, at which ATOM should query the AD/LDAP directory to schedule an automatic update.
- Last-Syn-Req-Time: The timestamp of the last successful synchronization with the LDAP server is displayed.
After adding the LDAP user in ATOM, click Test Connectivity to check the connectivity between the ATOM server and LDAP server.
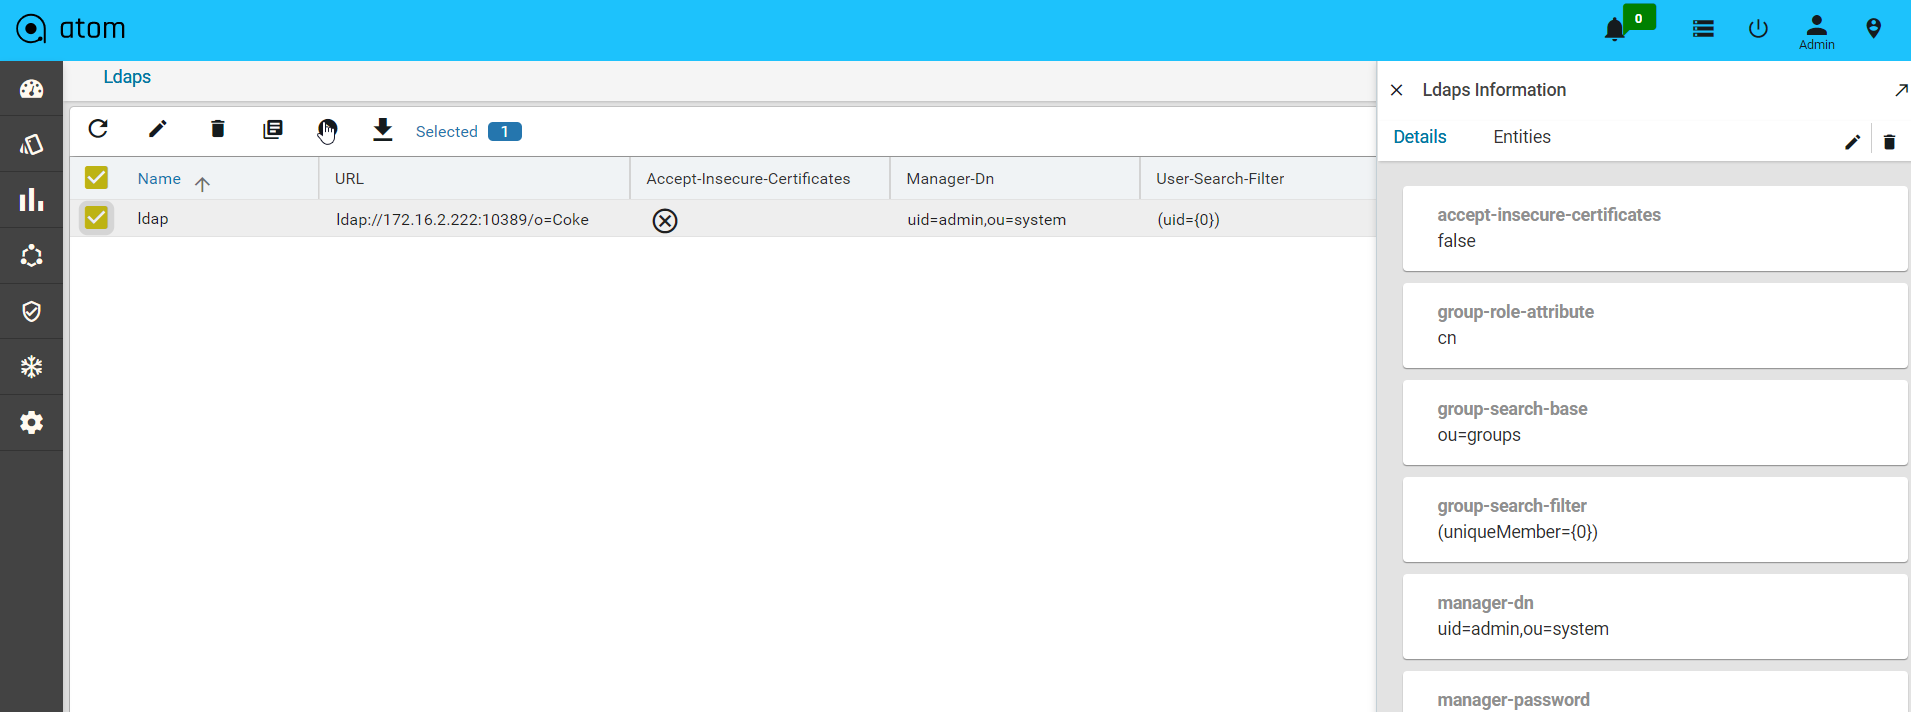
Managing TACACS Users
By integrating TACACS with ATOM, you can achieve a unified authentication system so that the same login credentials (username and password) can be used to access not only for managing network devices but for UNIX and Linux servers too. Therefore, the permissions and privileges to access the devices can be assigned and delegated through ATOM as systems rights.
To integrate the ATOM with TACACS, do the following:
- Navigate to Administration > Users & Tenants > TACACS > Add
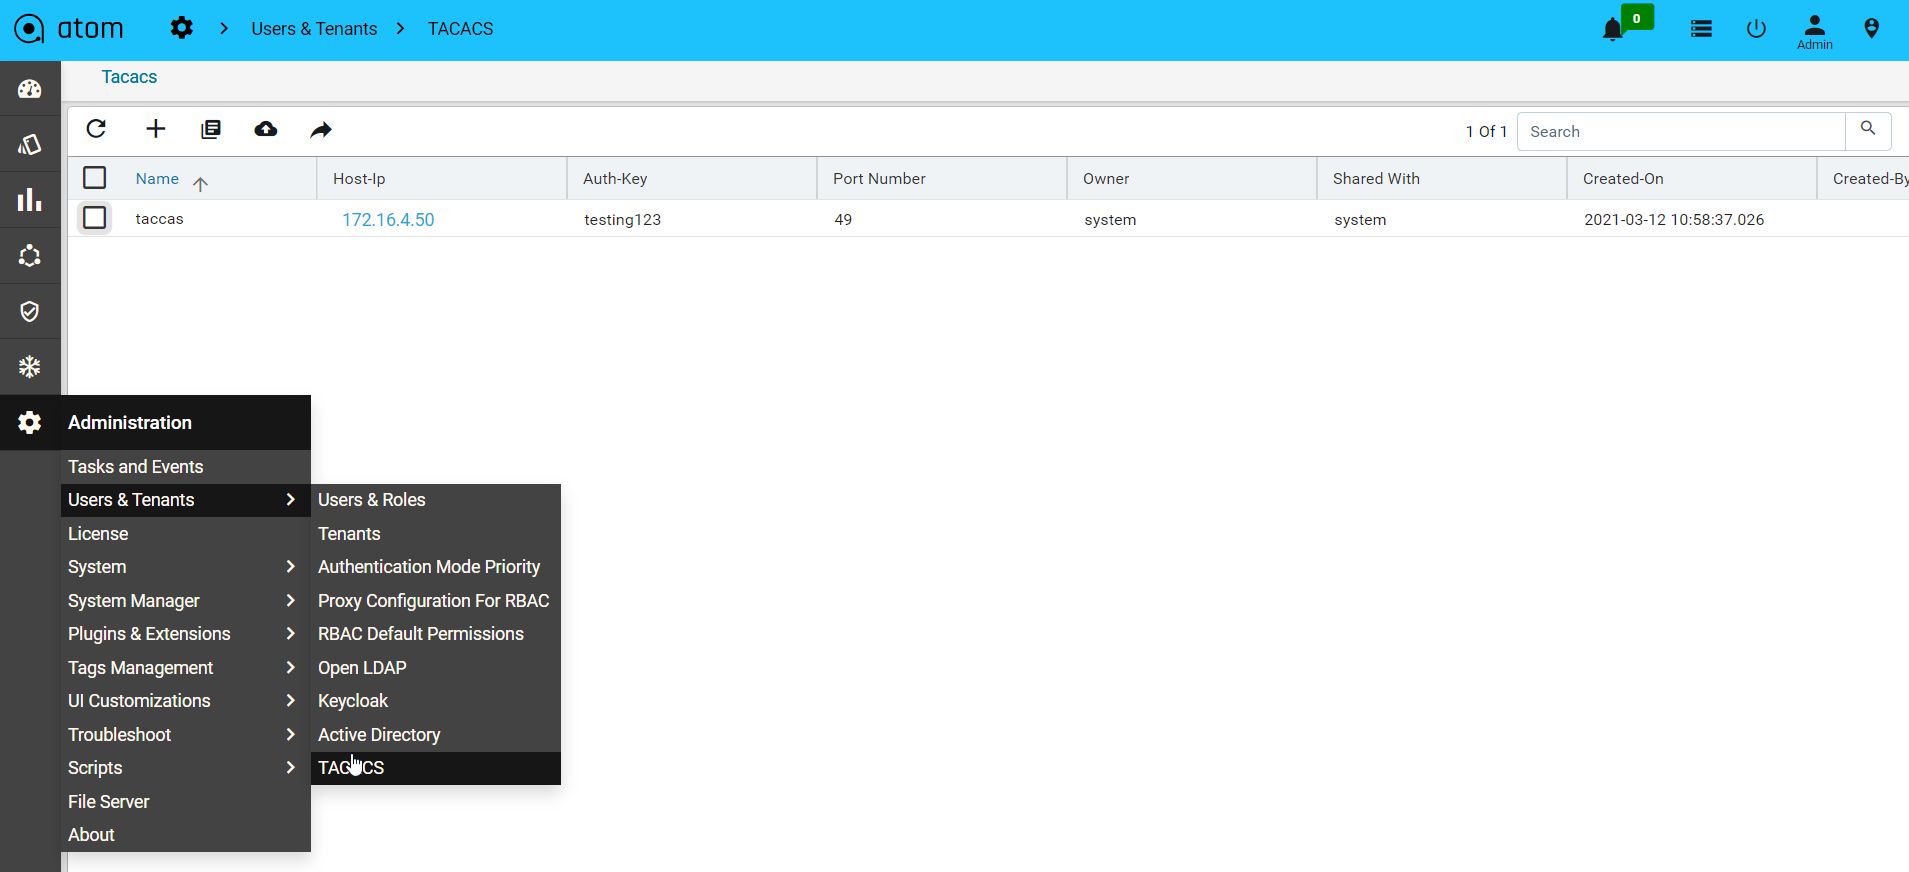
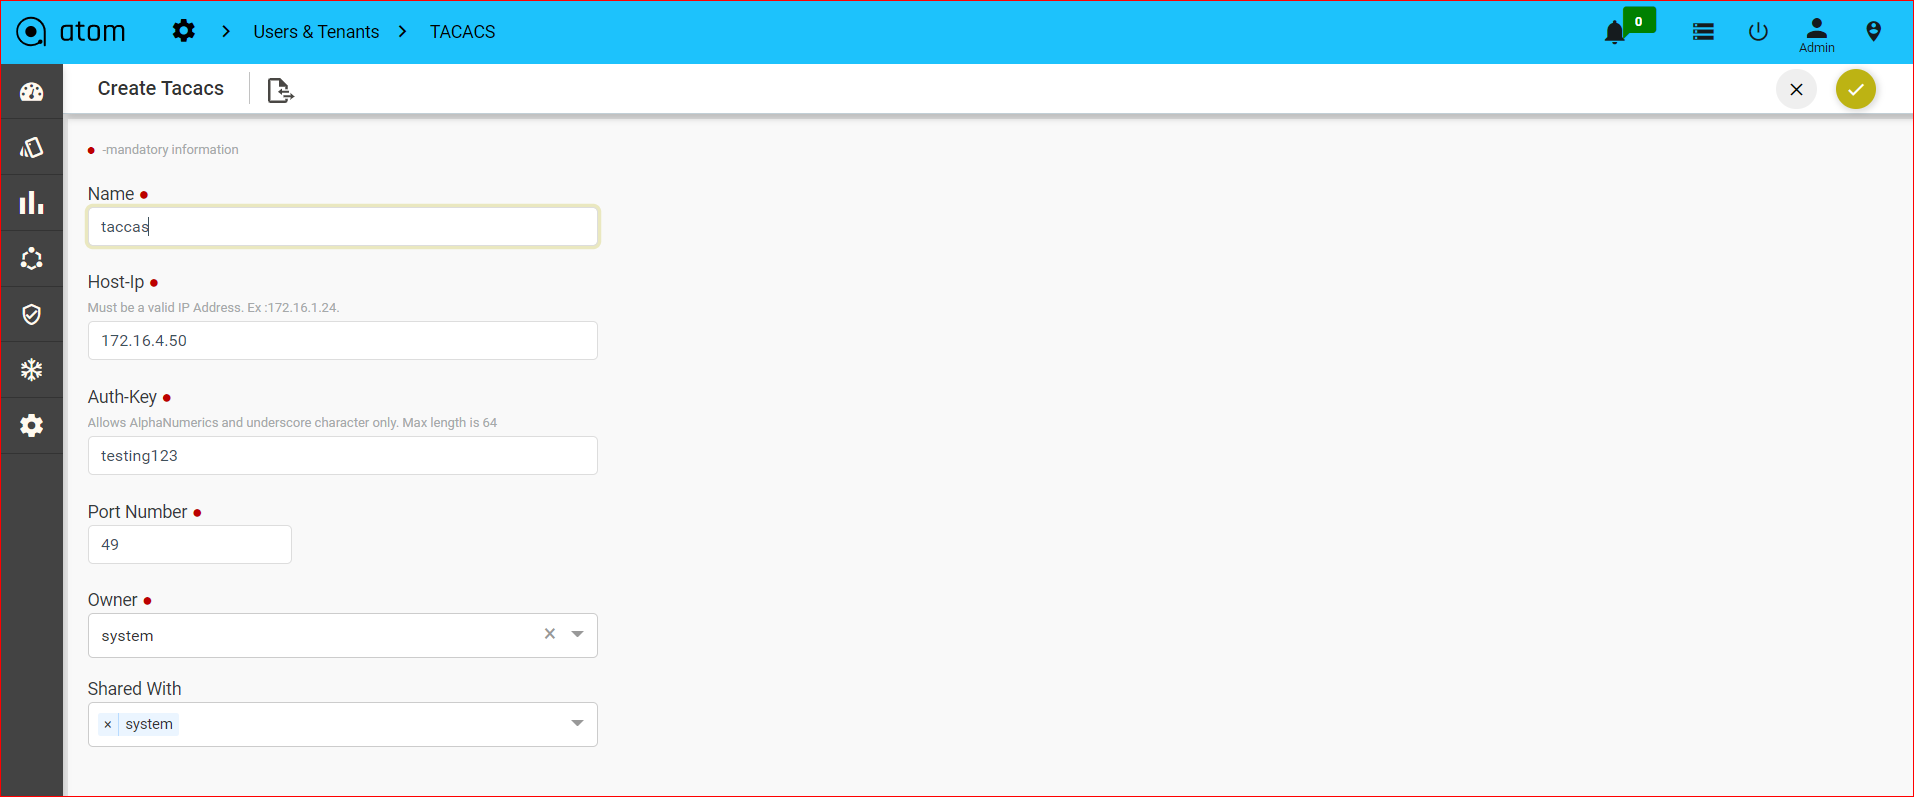
- In the Create TACACS screen, enter values in the following fields:
- Host Name: Enter the IP address of the host, which is hosting the TACACS server(172.16.4.50)
- Auth Key: Enter the key used to specify an encryption key for encrypting and decrypting all traffic between the ATOM server and the TACACS server(testing123)
- Port Number: Enter the TCP port number to be used when making connections to the TACACS+ daemon. The default port number is 49.
- Click the Test Connectivity button to test the connection between the ATOM and the TACACS servers(enter the name and the password to validate this connection).
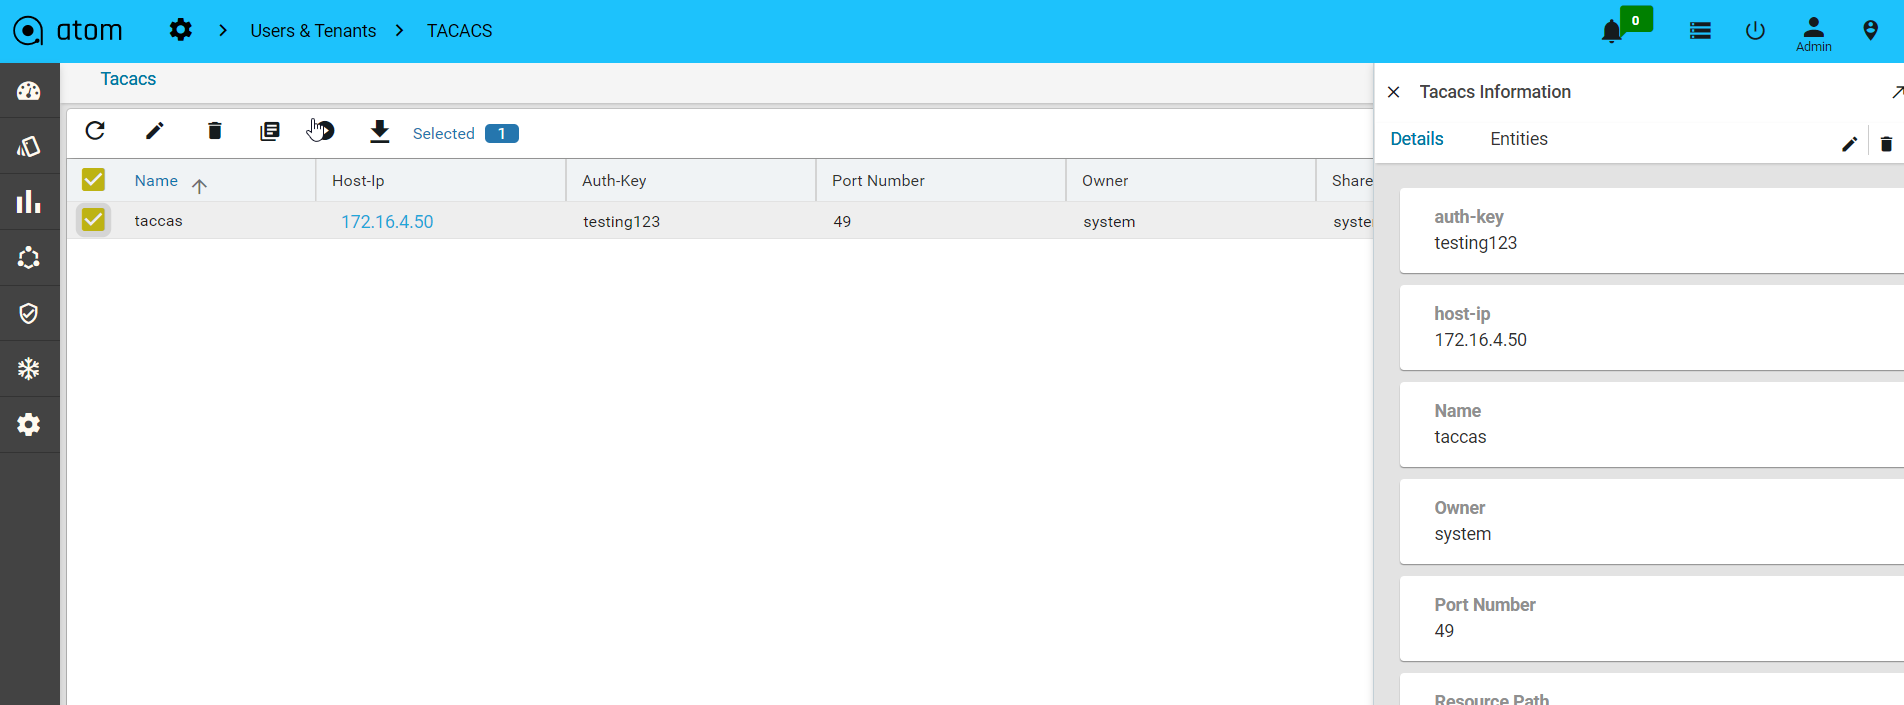
Customizing the Dashboard using DSL
DSL, Domain Specific Language, developed by Anuta can be used for representation and visualization of data derived from the devices managed by ATOM. DSL taps into YANG models, platform or third-party APIs to express code for model pre and post condition specification, rule expressions, rule logic, and RPC implementation logic. Some of the advantages that you can enjoy by implementing DSL are no more manual JAVA or Python code to carry out simple validations, side effect processing, ability to offer richer expressions than xpath 1.0 used by YANG, static analysis of business logic, side- effect analysis, advanced user experience, and ability to change logic on a live system.
Starting from the 7.x release, Dashboard, the landing page of ATOM, is organized into dashlets.
A dashlet is an individual component that can be added to or removed from a dashboard. Each dashlet is a reusable unit of functionality, providing a summary of the feature or the function supported by ATOM and is rendered as a result of the custom queries written in DSL.
You can customize the look of the Dashboard, by adding the dashlets of your choice, and dragging and dropping (the extreme right corner of the dashlet) to the desired location on the dashboard.
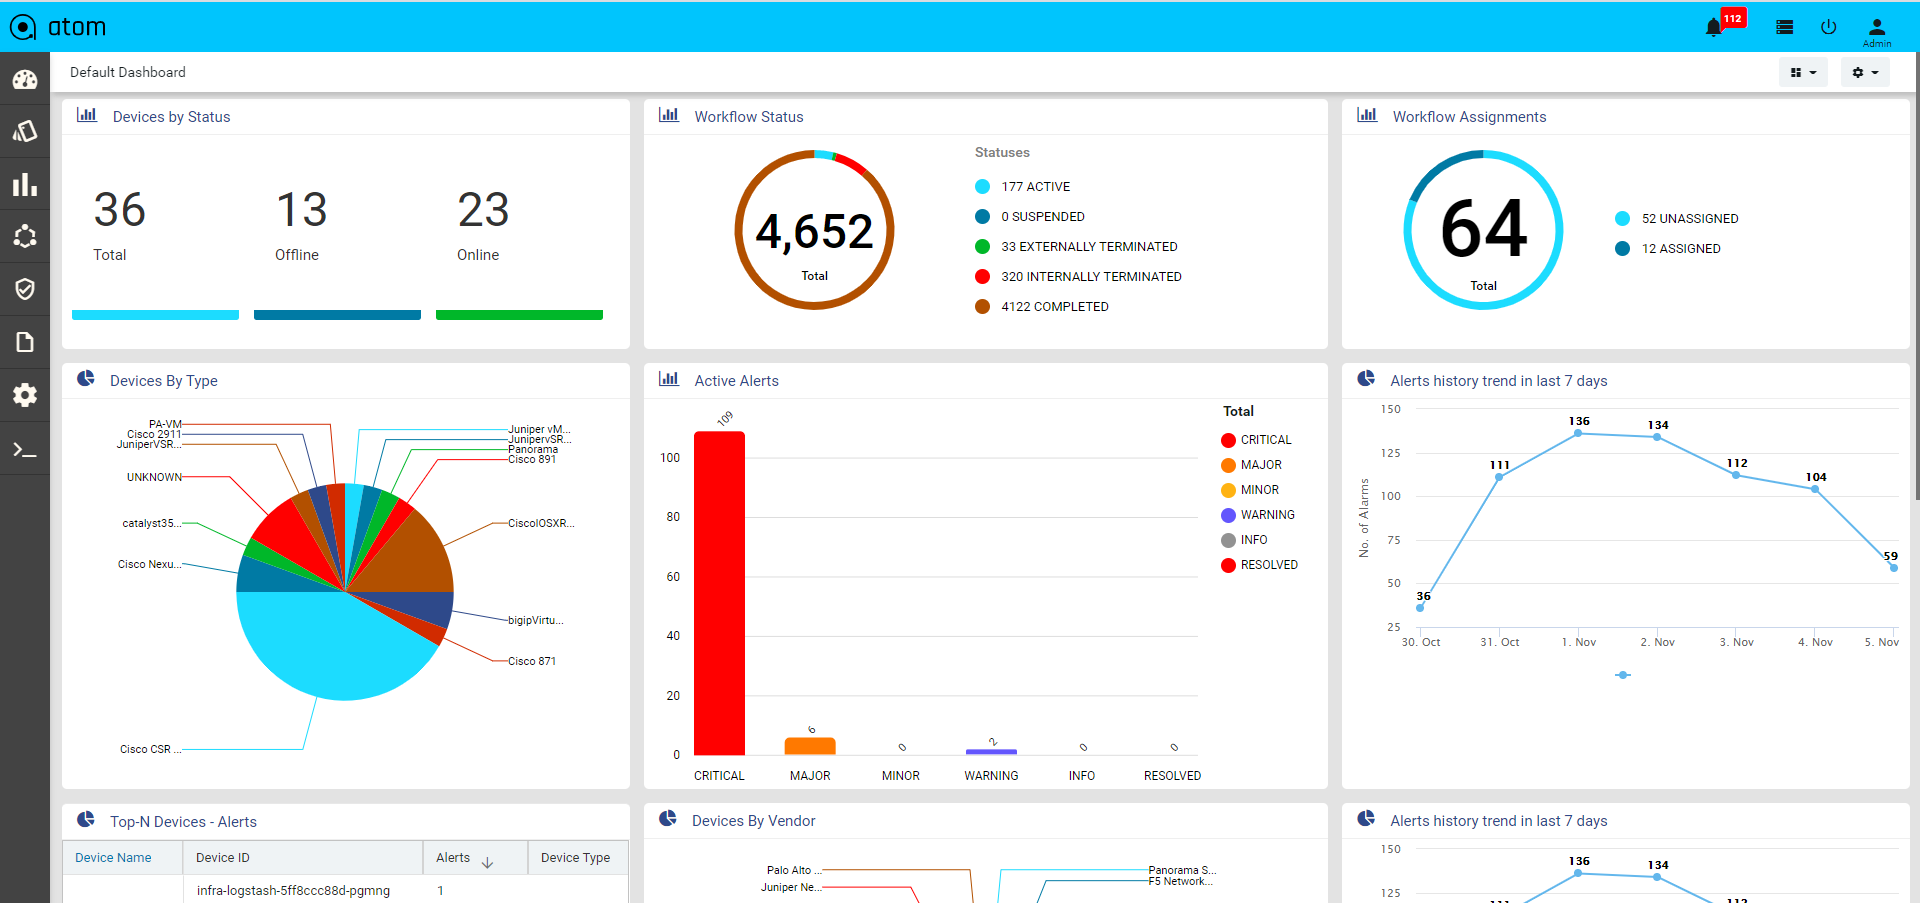
Each dashlet contains the summary or the overview of the feature or the functionality supported by ATOM.
For example, the dashlet “Device” displays the summary of devices managed by ATOM.
Some of the statistics that can be of the interest in this dashlet could be as follows:
- Total number of devices
- Number of online devices
- Number of offline devices
These statistics can be gathered by ATOM and displayed in the corresponding dashlet depending on the DSL query written for each of them. For information about writing DSL queries, refer the section, “Writing DSL Queries”
You can save the layout containing the dashlets of your choice and set in a particular order.
Writing DSL Queries
- For writing any new DSL query in the editor, browse to Administration > DSL > DSL Editor.
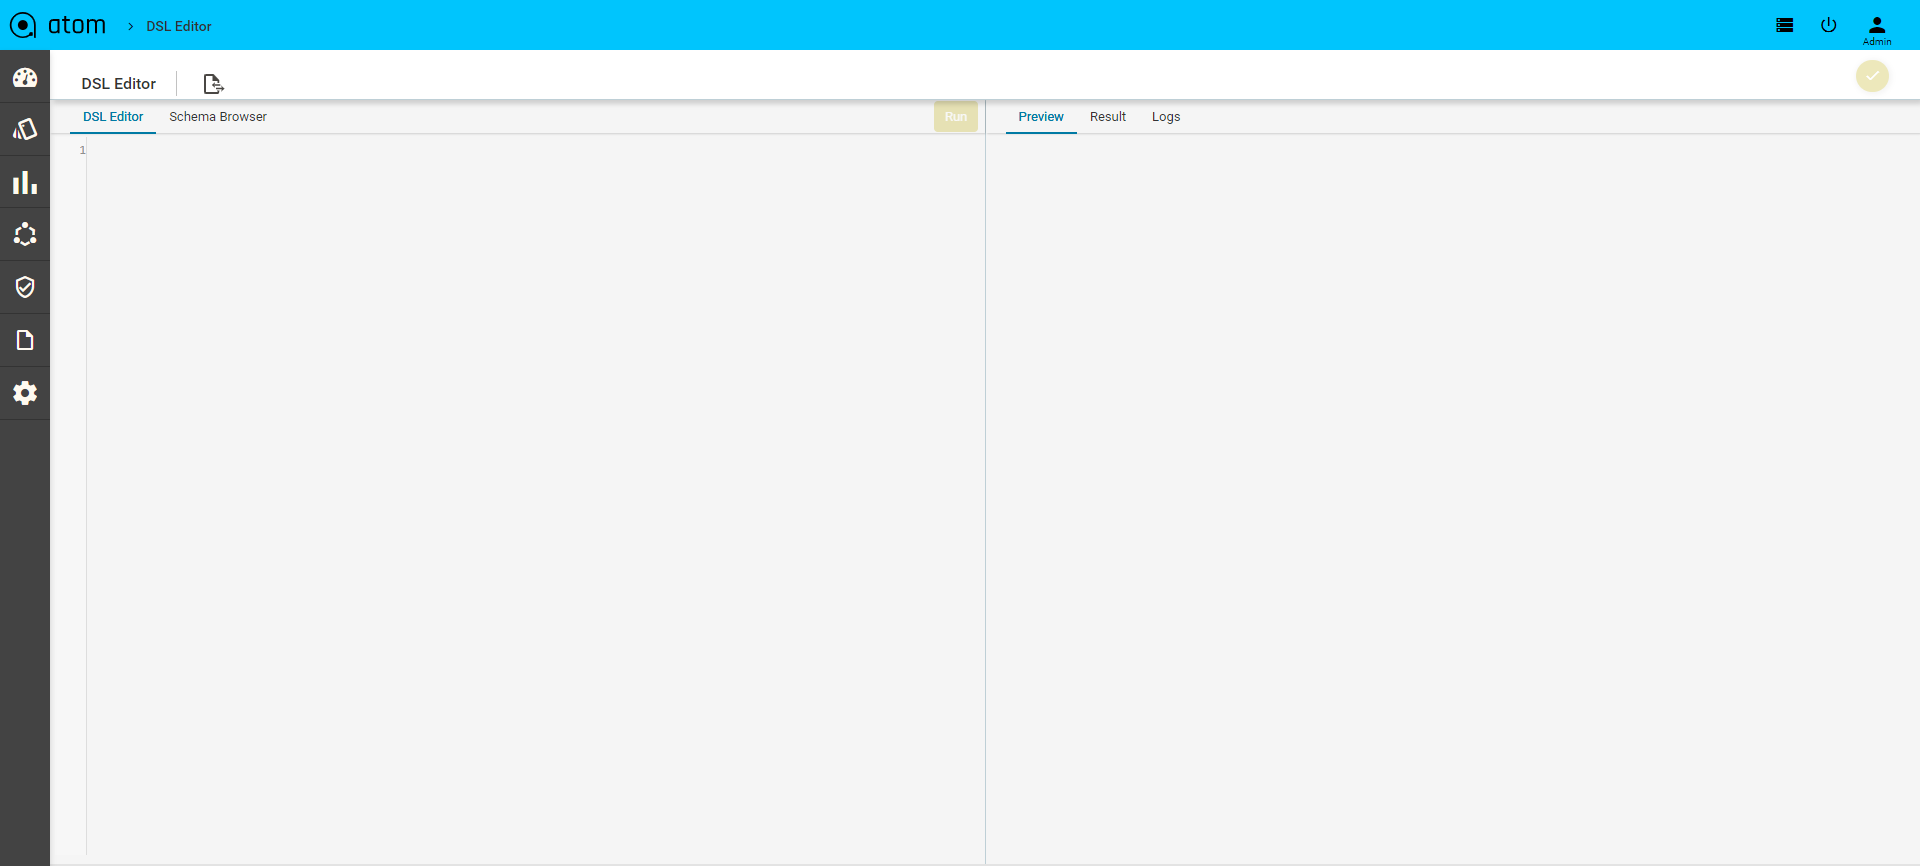
Sample DSL Query
Below is a sample DSL which will display Total/Offline/Online devices in ATOM as a card layout
| (n {:view “number-card”, :label “Device”, :id “device”, :icon “icon-Devices.svg”} “Each-Card” (n {:label “Total”} “Each-Card” [“count” (get-count-by-schema-path “/controller:devices/device”)]) (n {:label “Offline”, :icon “status-Critical.svg”} “Each-Card” [“count” (get-count-by-schema-path “/controller:devices/device/status” [“OFFLINE”])]) (n {:label “Online”, :icon “status-Minor.svg”} “Each-Card” [“count” (get-count-by-schema-path “/controller:devices/device/status” [“ONLINE”])]) ) |
- Click to Run button on the top of the editor to check if DSL is working as expected.
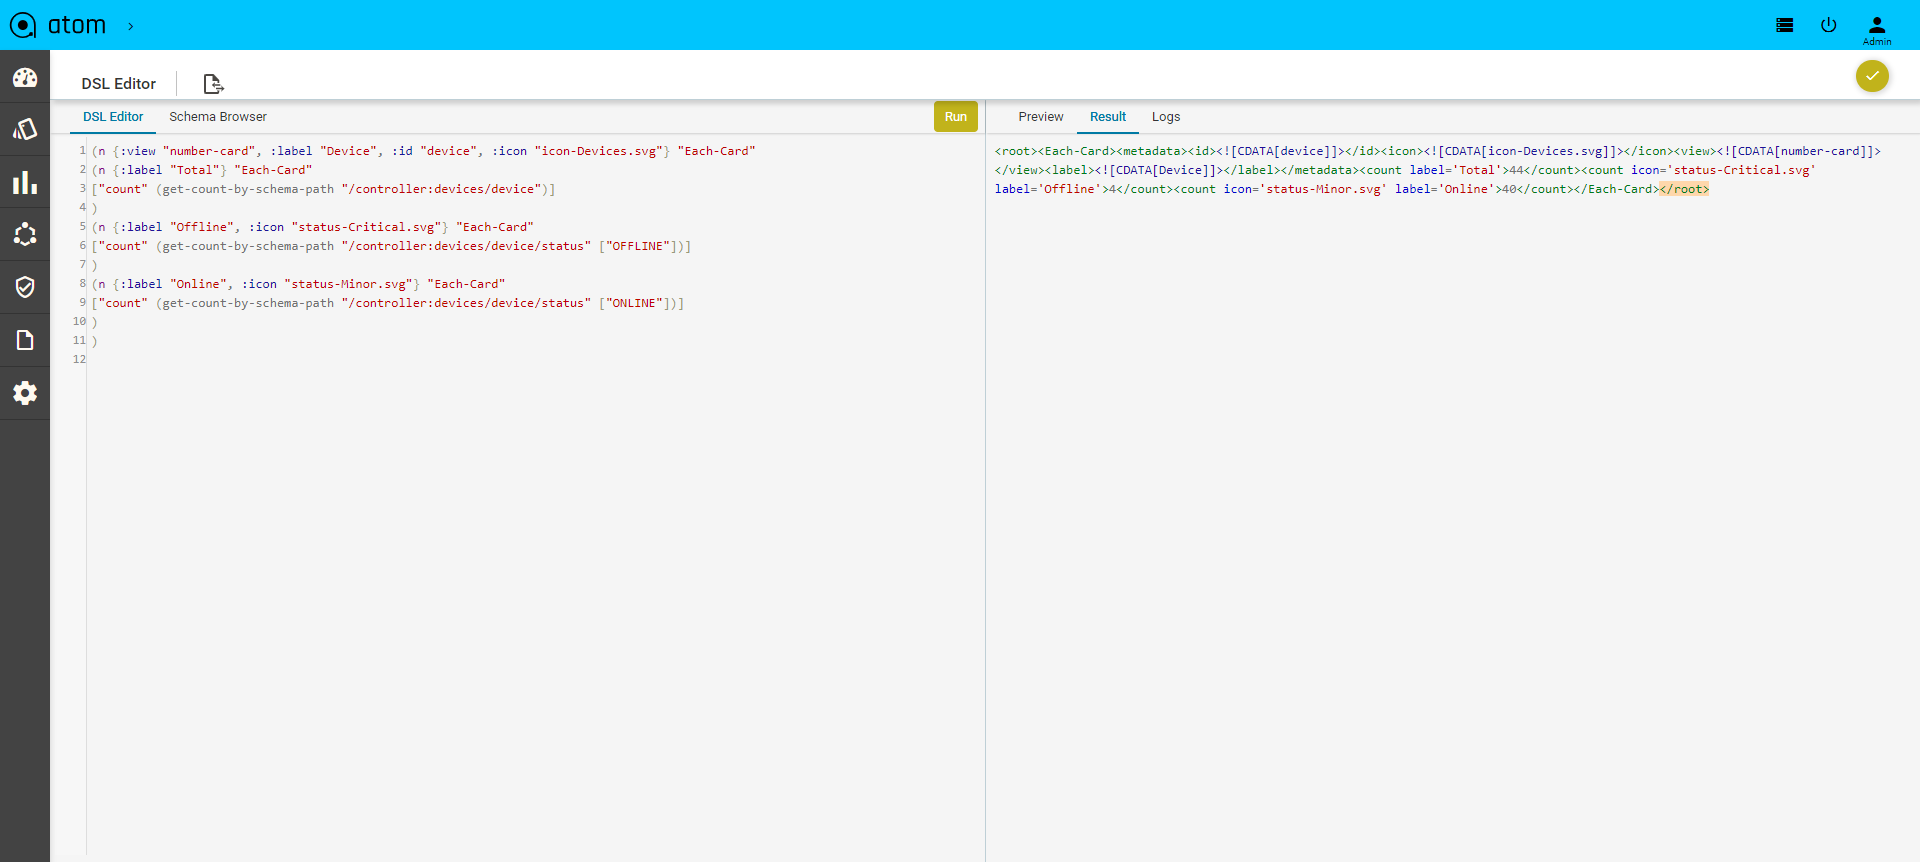
Go to the right pane to view the result.There are three tabs in the right side panel Preview, Result and Logs
- Check the Preview of layout (Card,Grid,Pie Grid,Pie Chart) for the DSL in Preview tab.
- XML output of the DSL will be shown in the Result tab
- All errors of the DSL will be listed in the Logs tab in case of any failures.
After the successful execution of a DSL query, you can save and use this as a new Report or incorporate it into Dashboard view. All DSL queries will be saved in Administration > DSL Queries.
Customizing the Dashboard
After the successful execution of DSL query, if you want to incorporate the DSL into Dashboard, browse to Administration > DSL < DSL Queries to view all the queries as shown below:
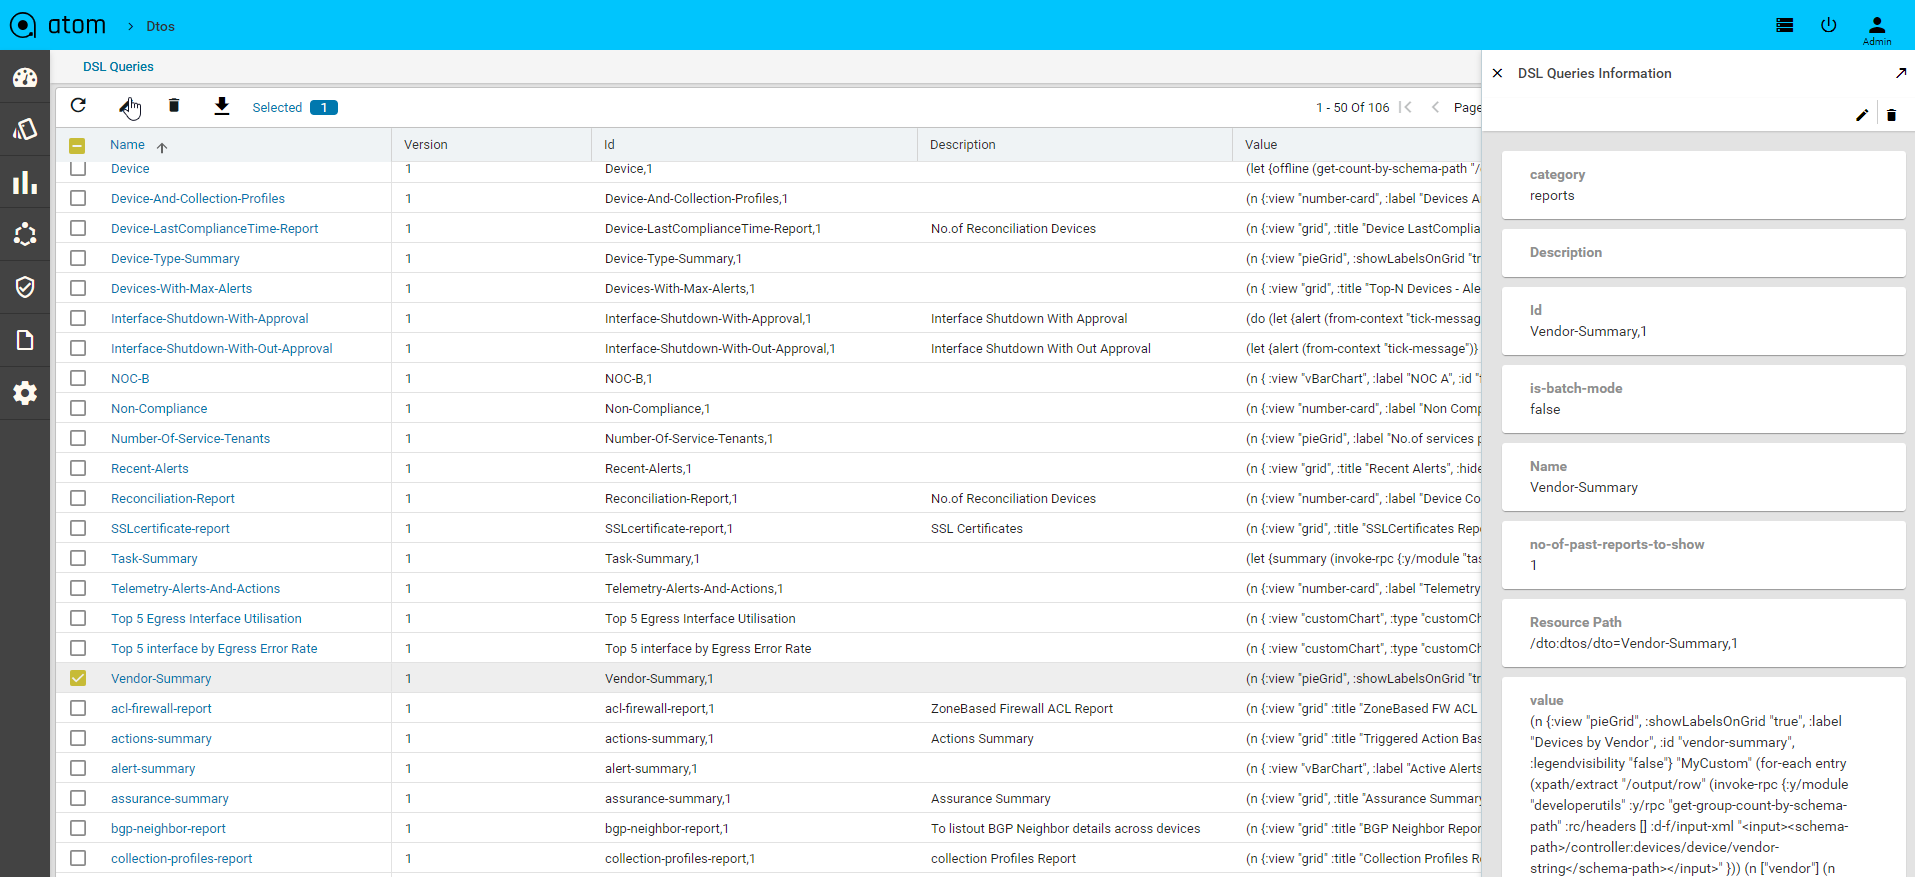
Click on view/download option in dsl query, it can be shown as xml/json/csv/form template.
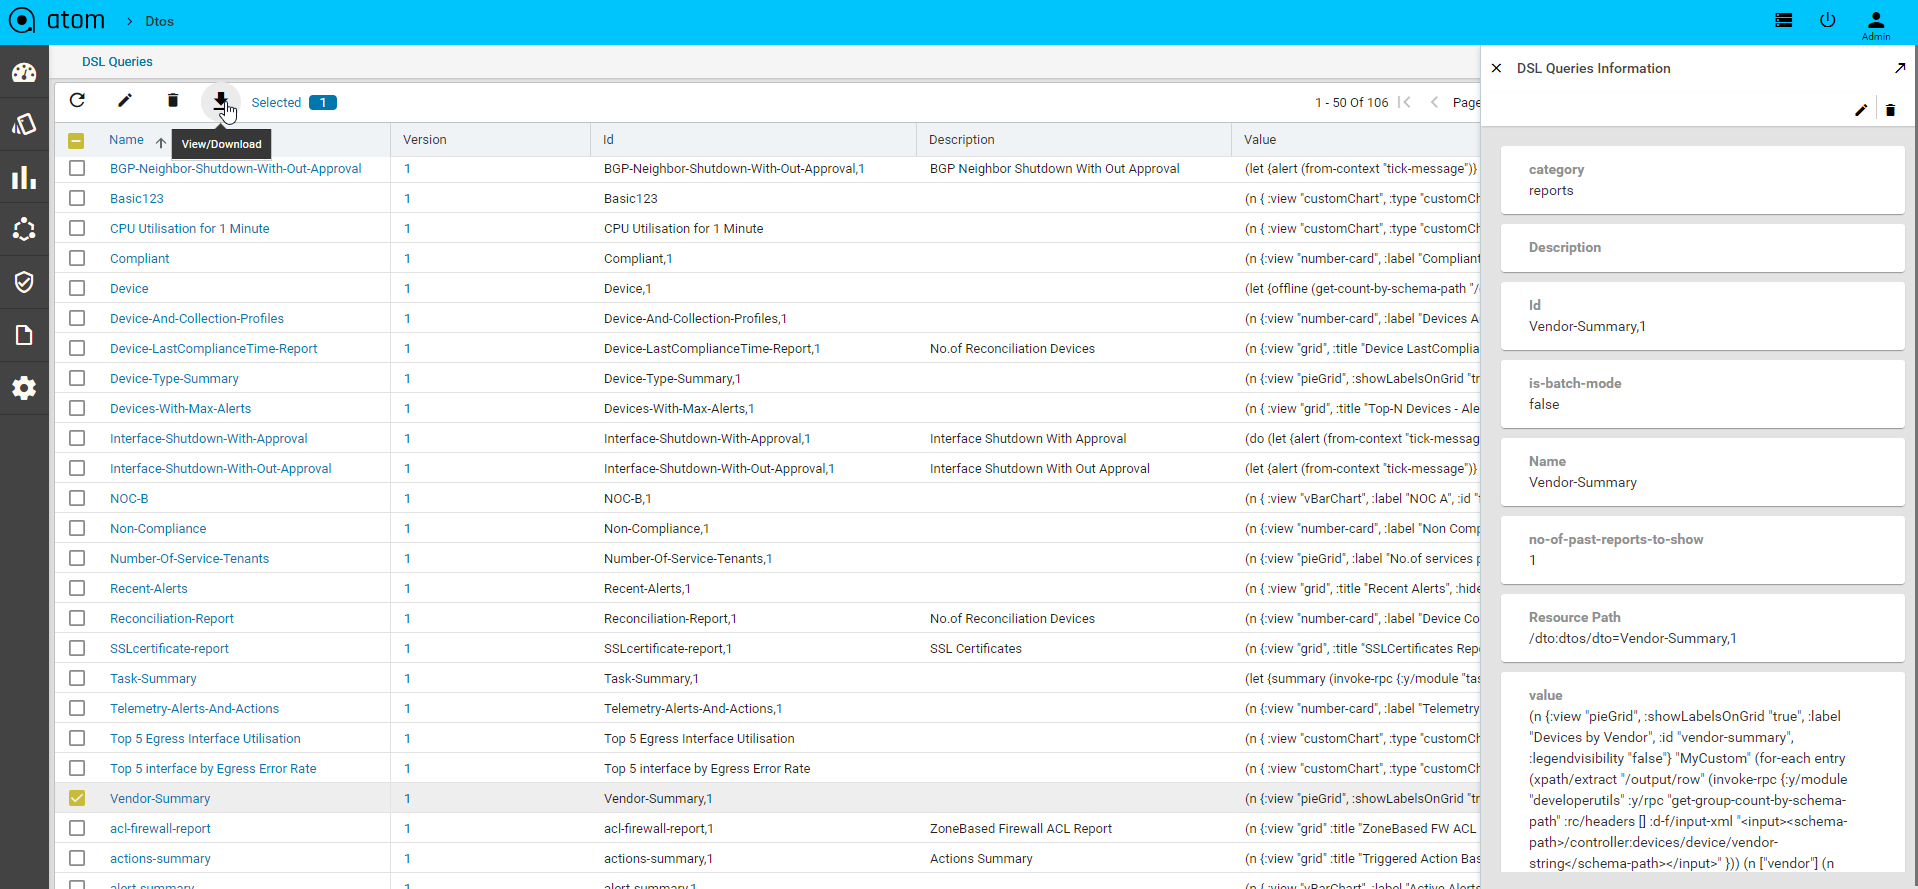
Include your new DSL and click the Save button on the right side panel of the Editor.

Now you can browse to Dashboard to view the report that has been included (due to the new DSL query that was added) in the Dashboard DSL.
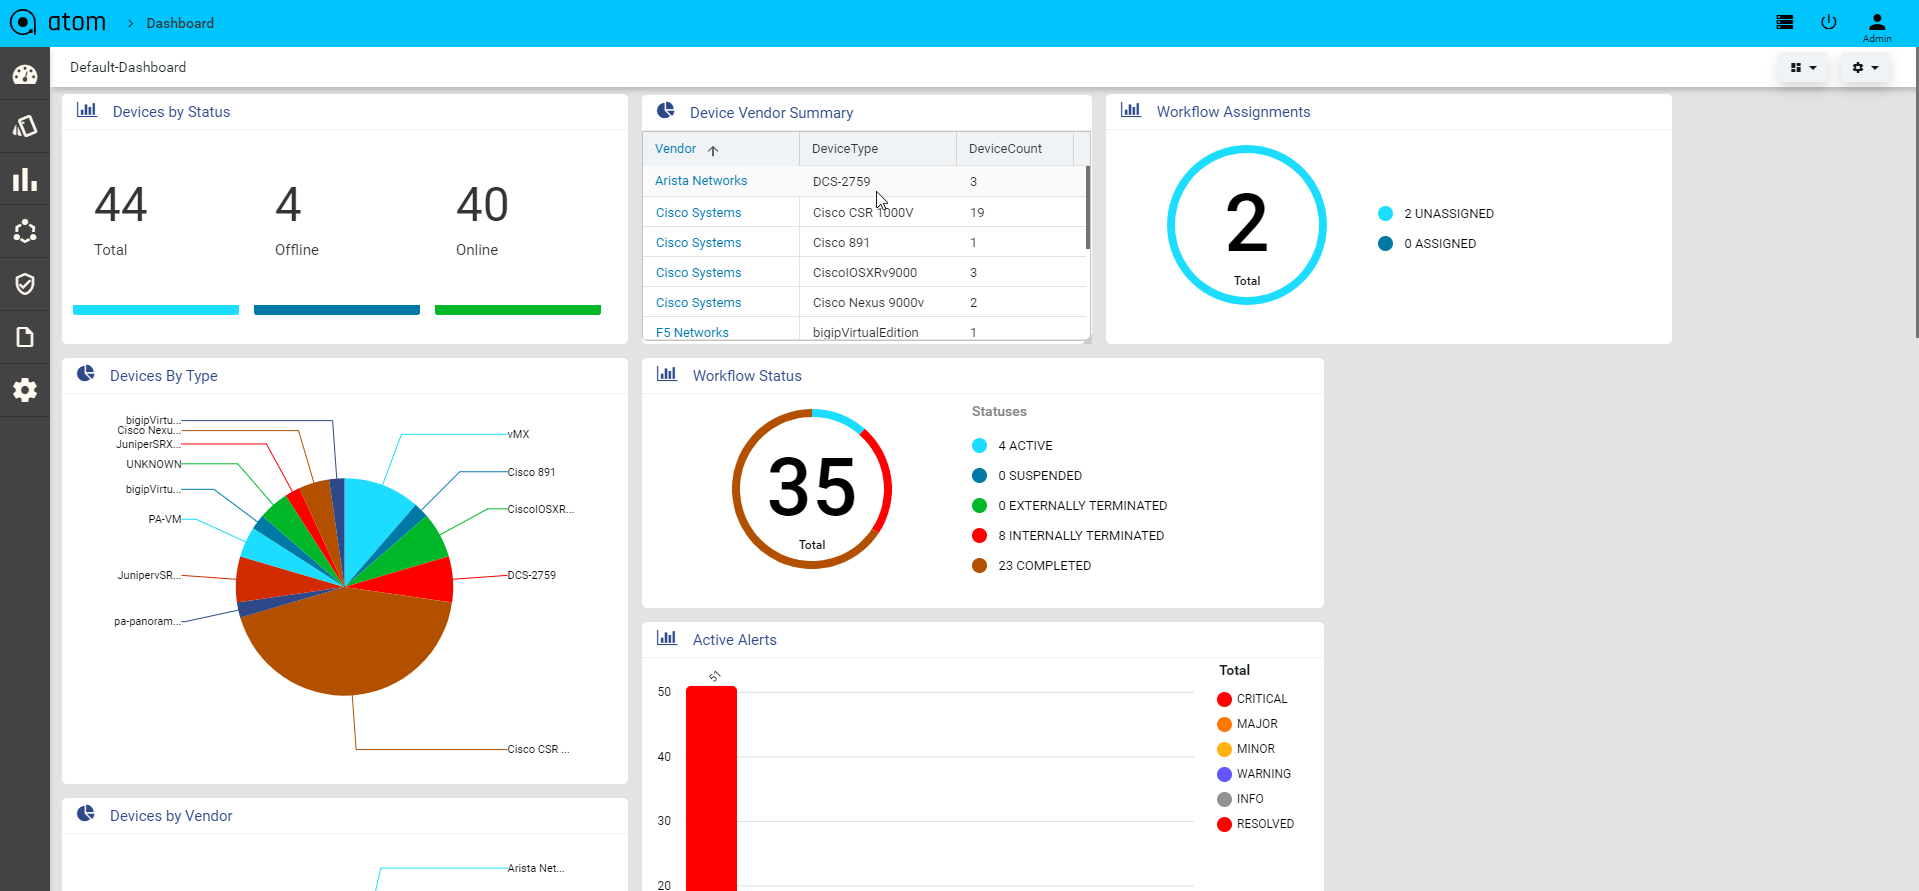
DSL Assignment
The define the dsl assignment is associated with the group and dto is a transfer of the object(to get the navigation menu items after login user).
Navigate > Administration > DSL > DSL Assignment > Add
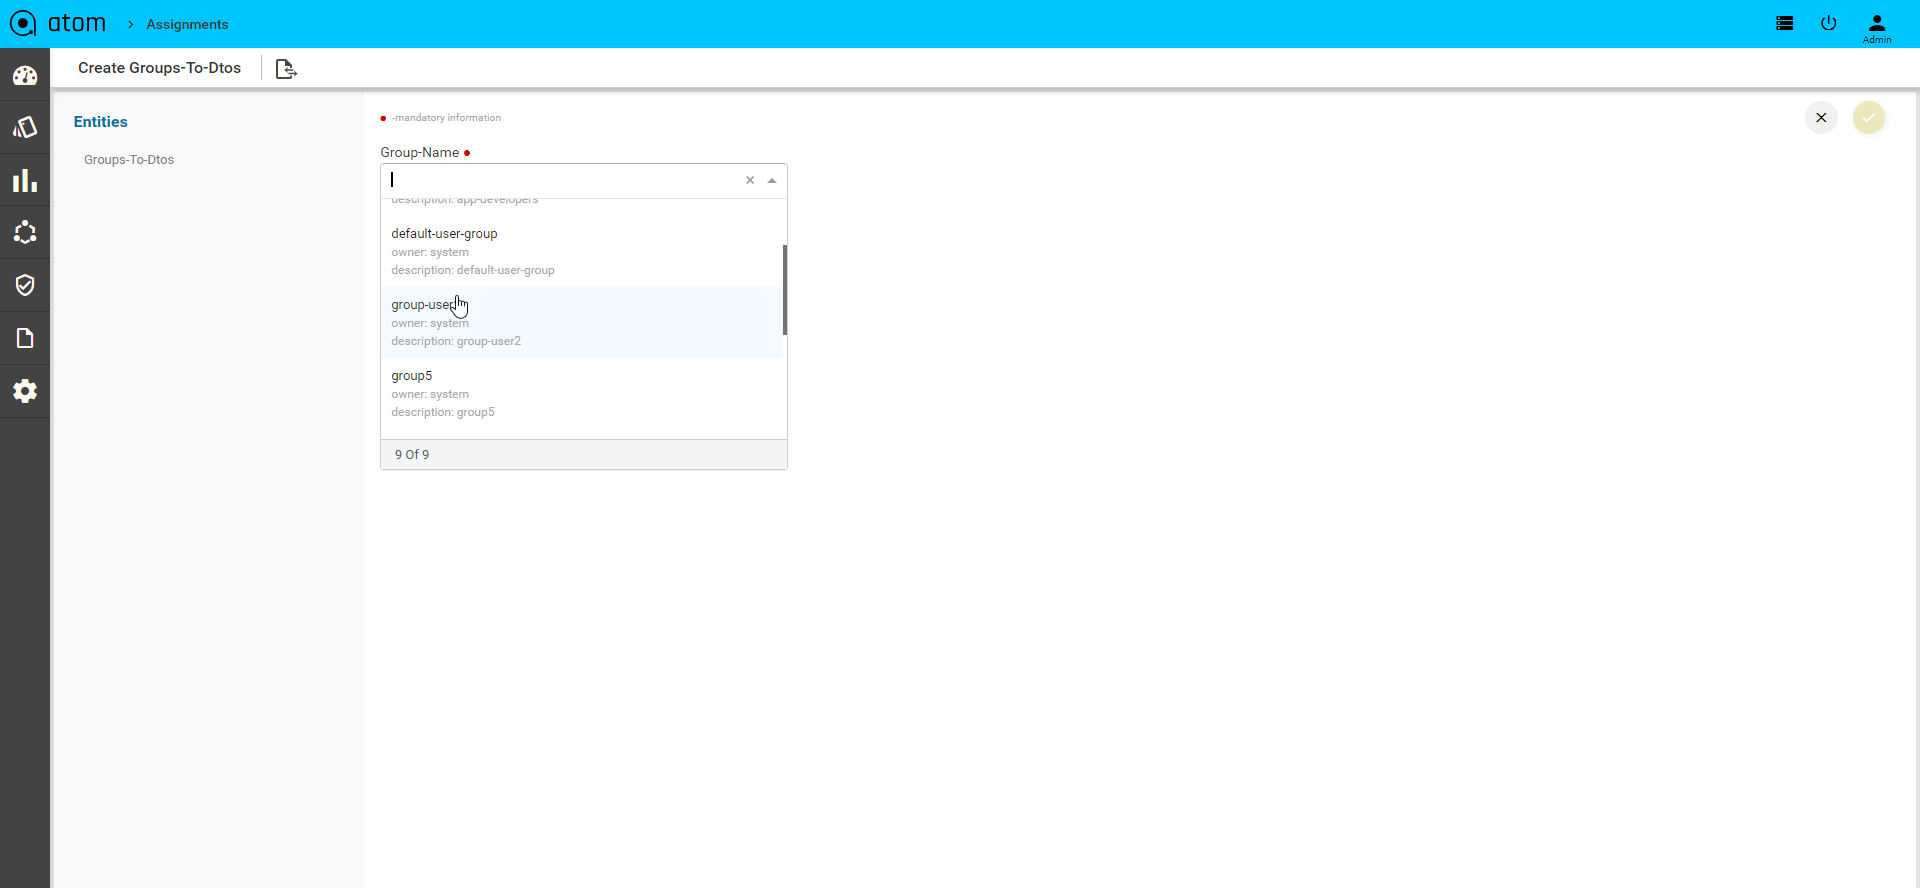
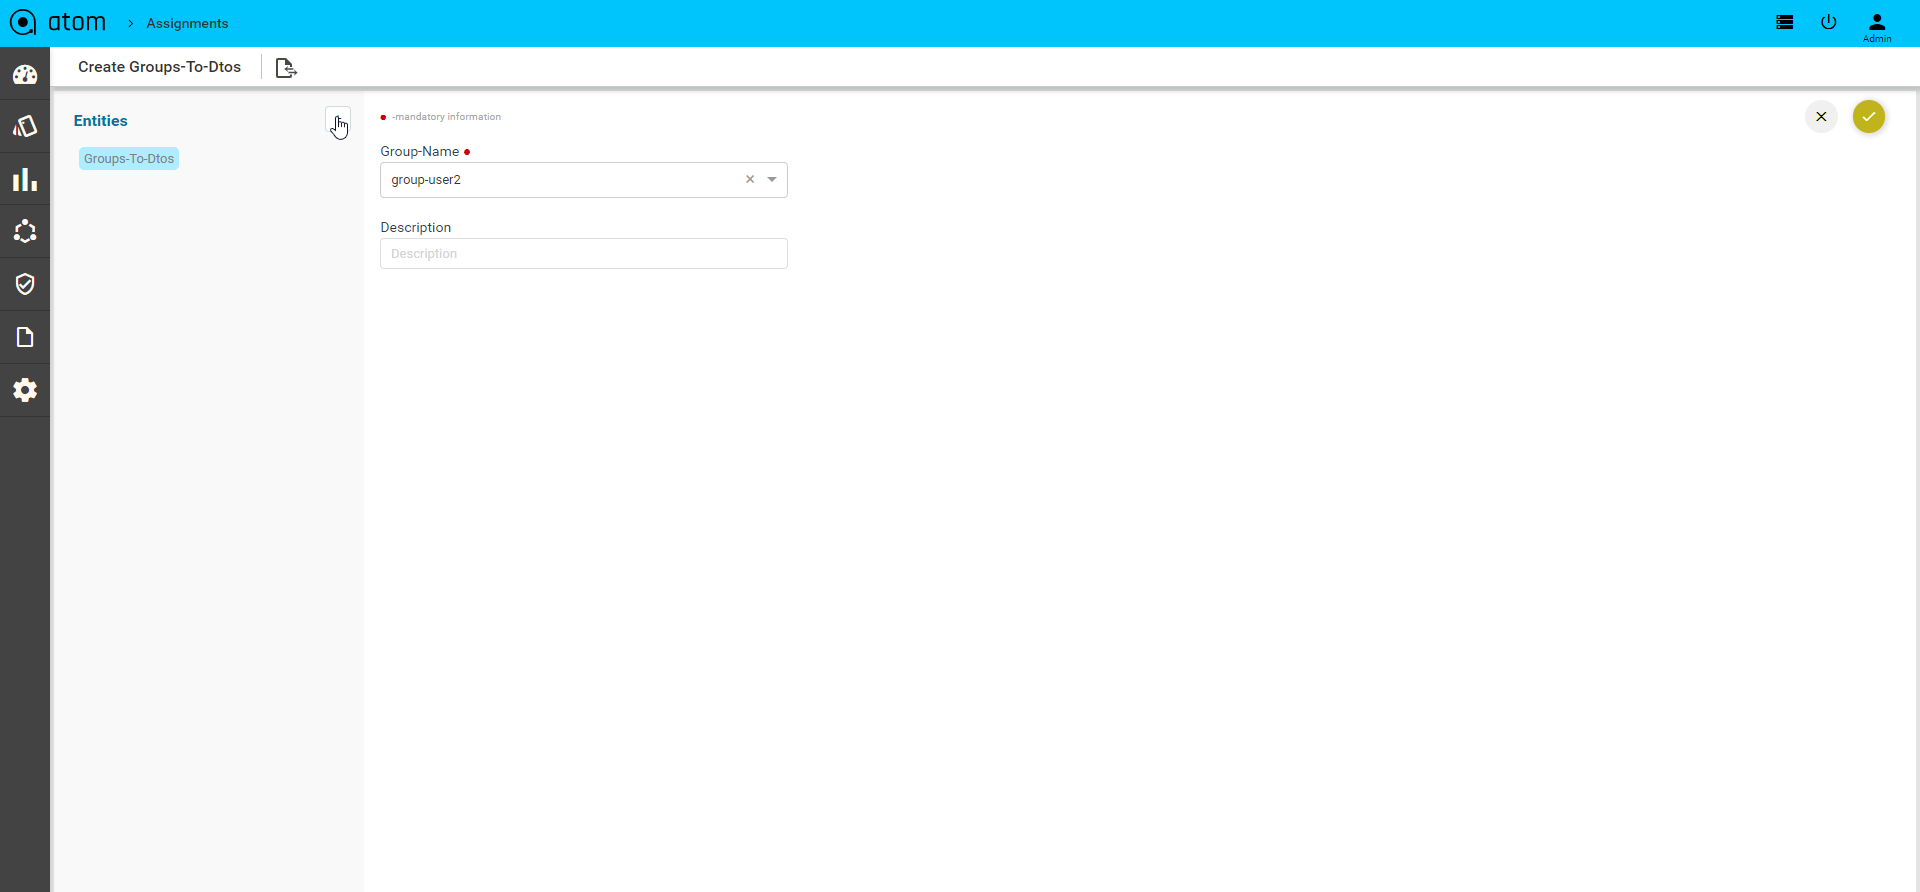
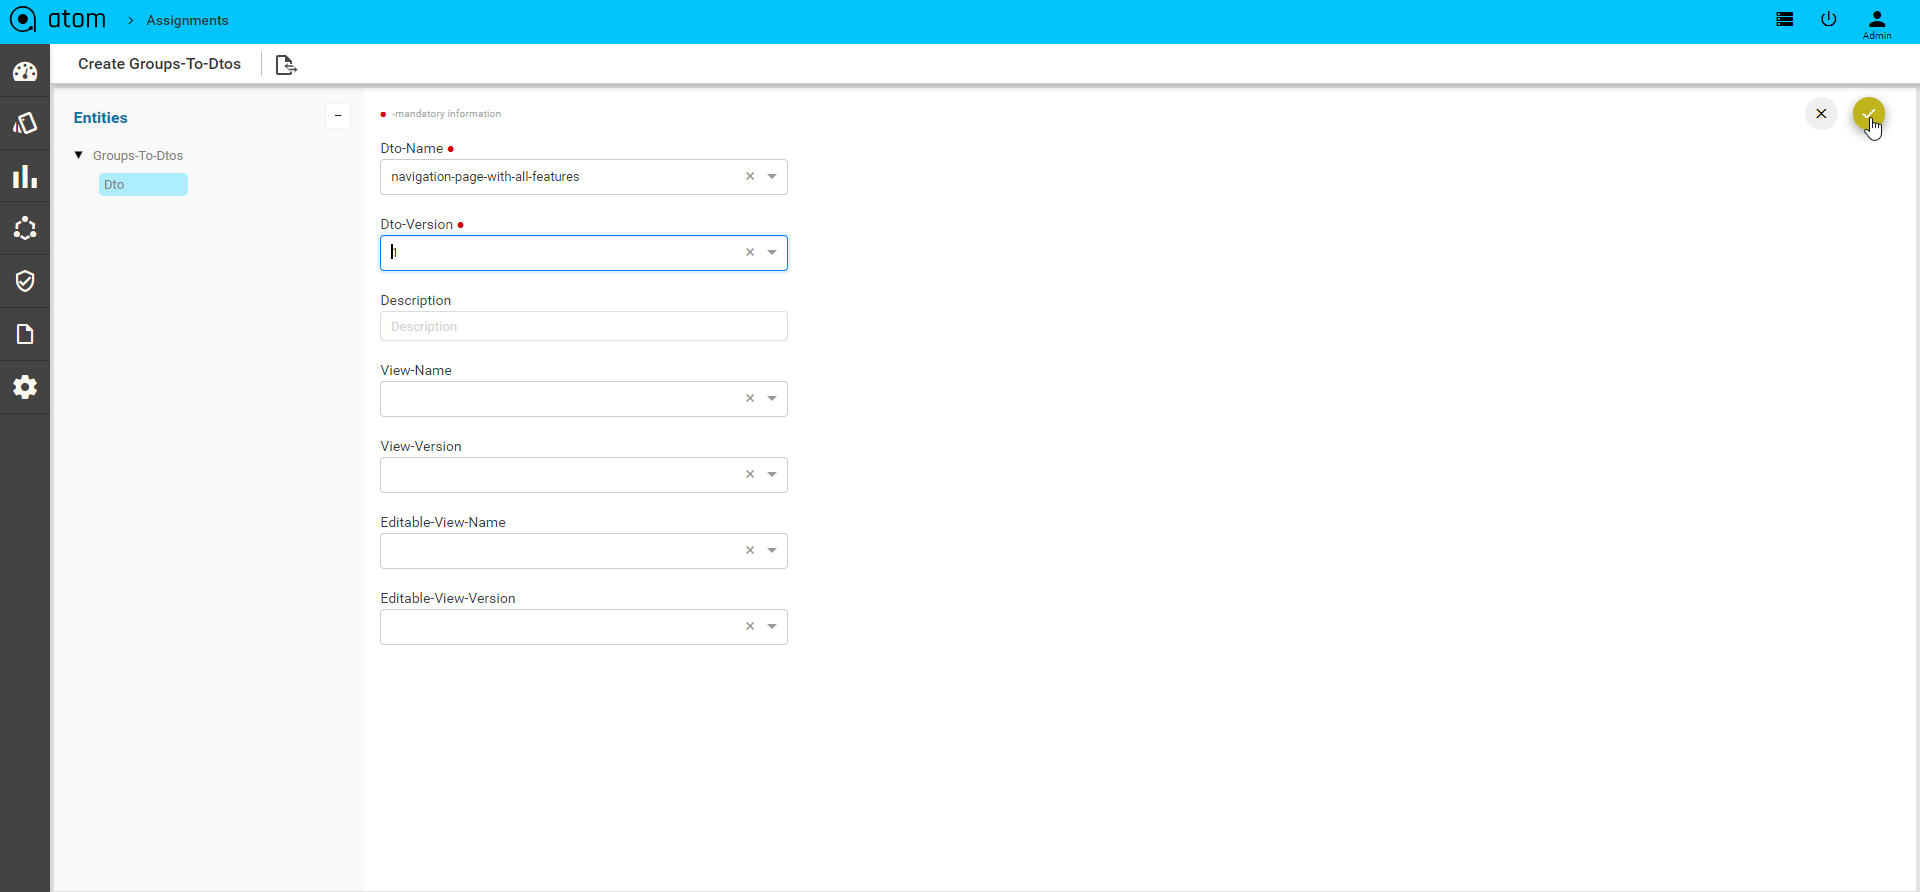
Tag Management
By creating the tags in global, it should show in create alert rule definition
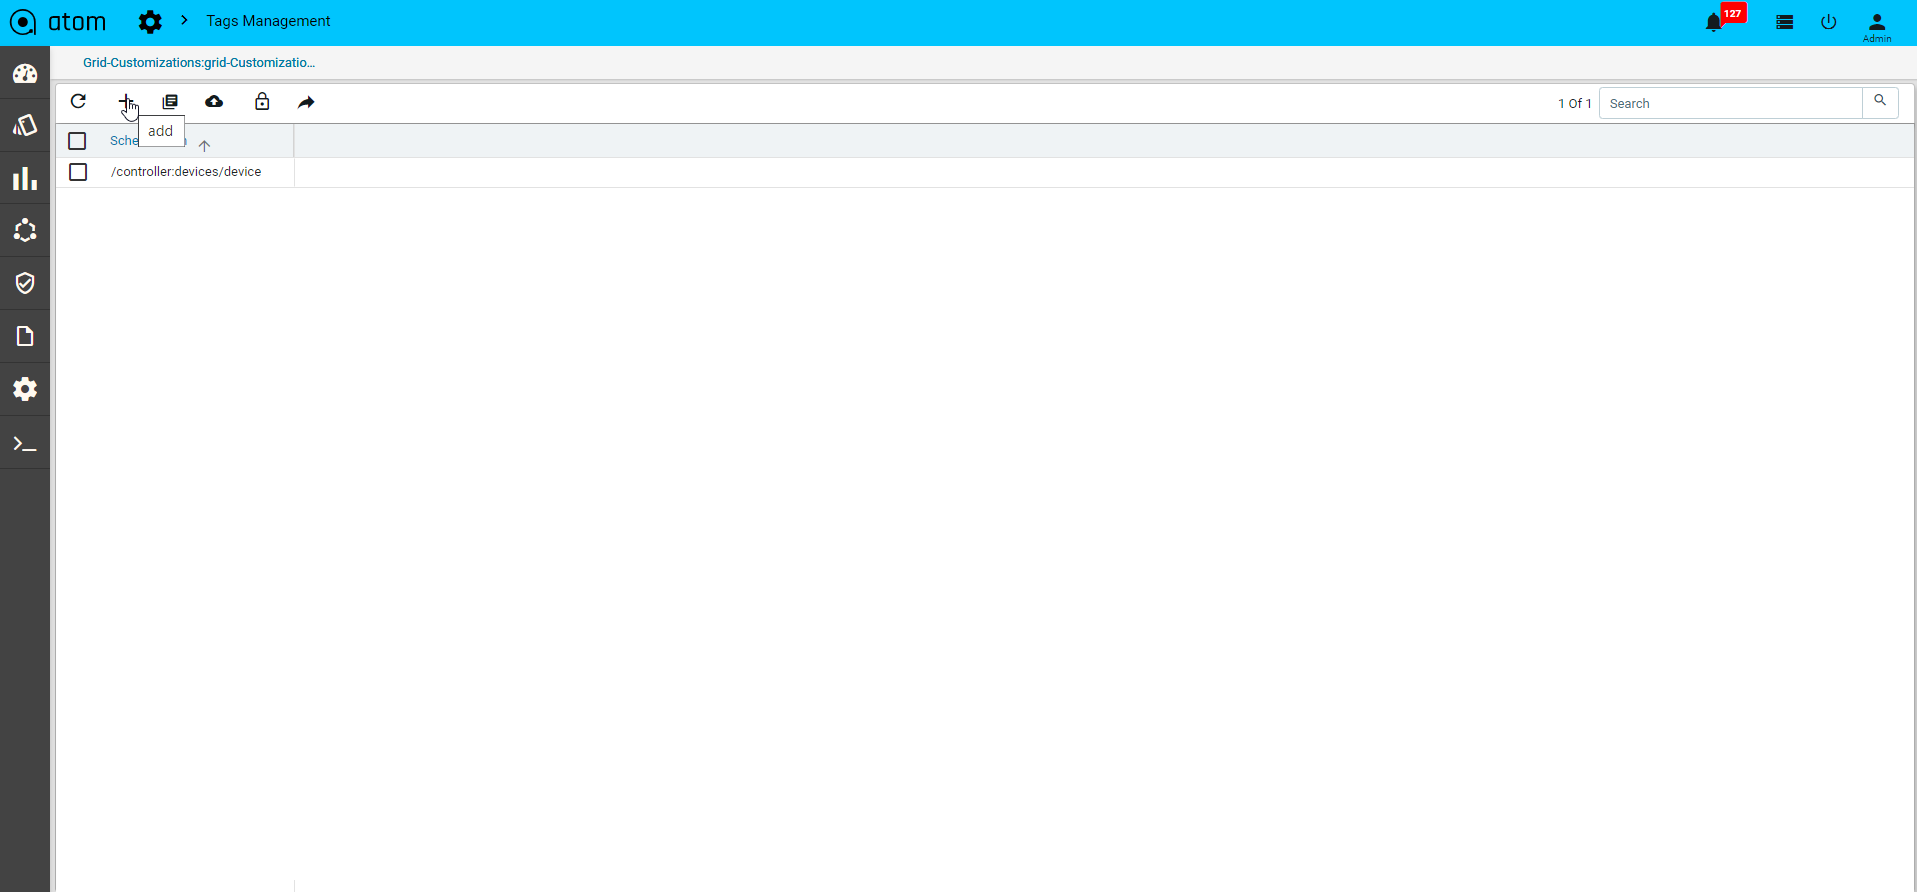
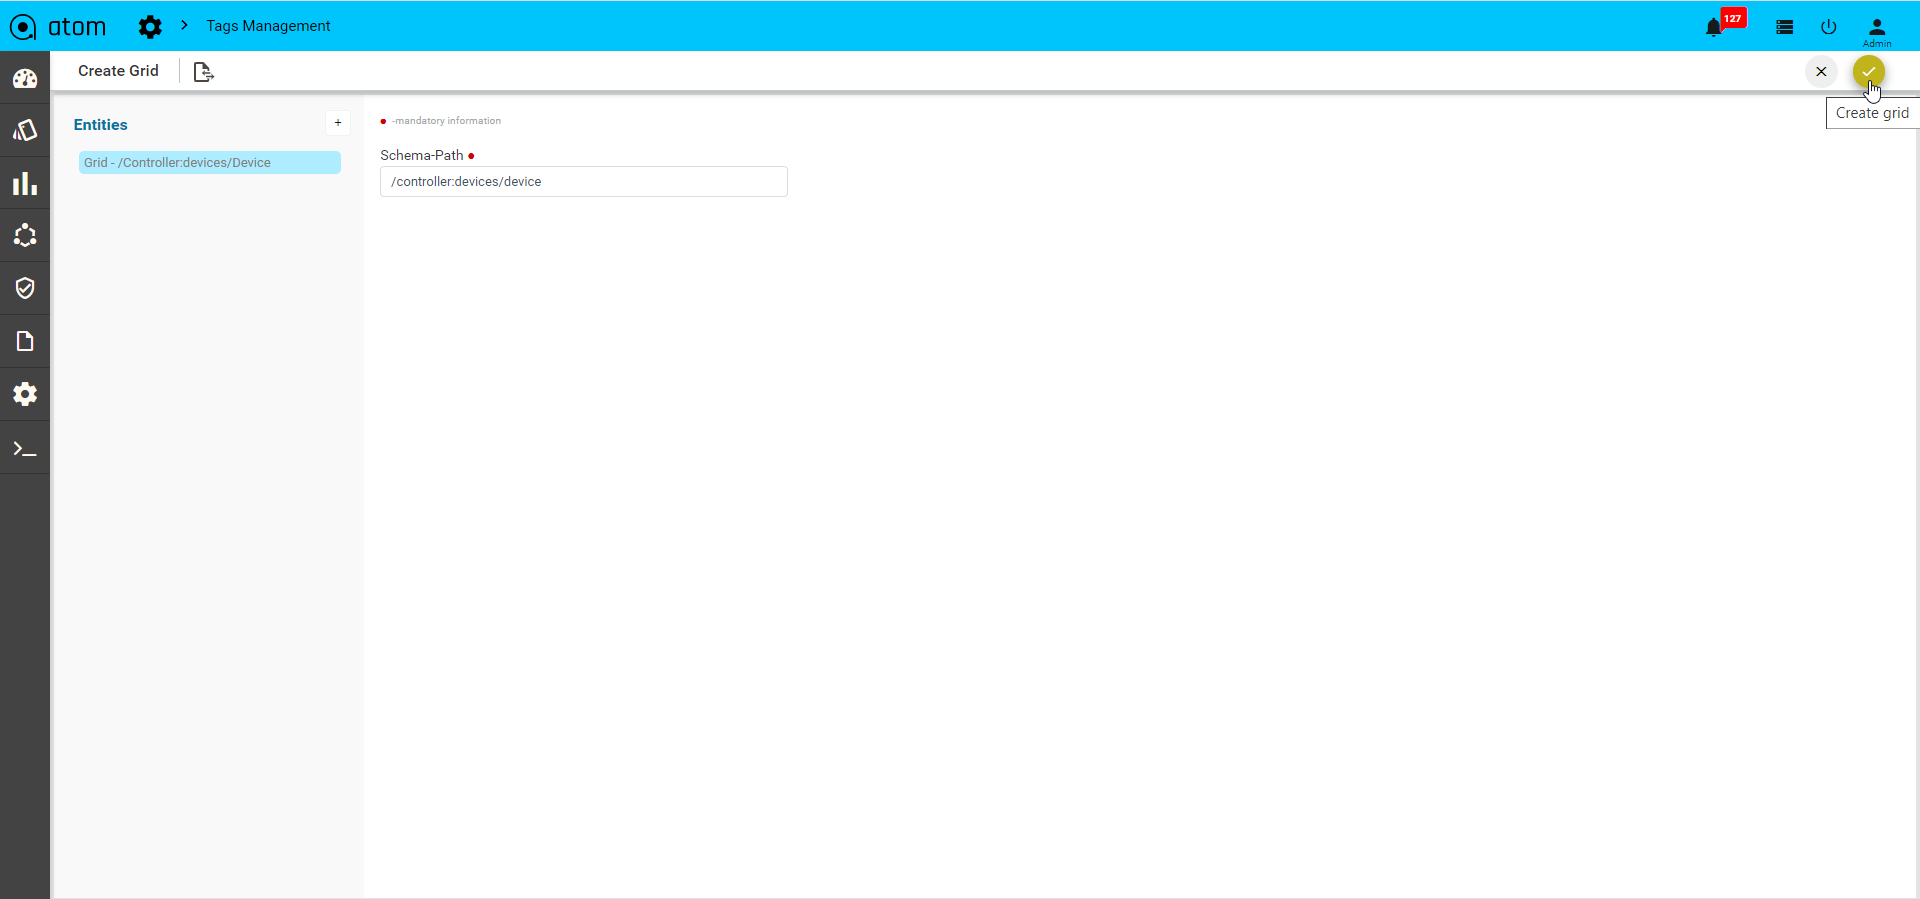
UI Customizations
Customization give control to the user.Customization may involve moving items around an interface to reflect the users’ priorities
1.Grid column: Grid columns allows us to select which grid columns can be shown for each entity.Current by default we have one for devices now in grid column.
Navigate > Administration > UI customization > Grid column >Add
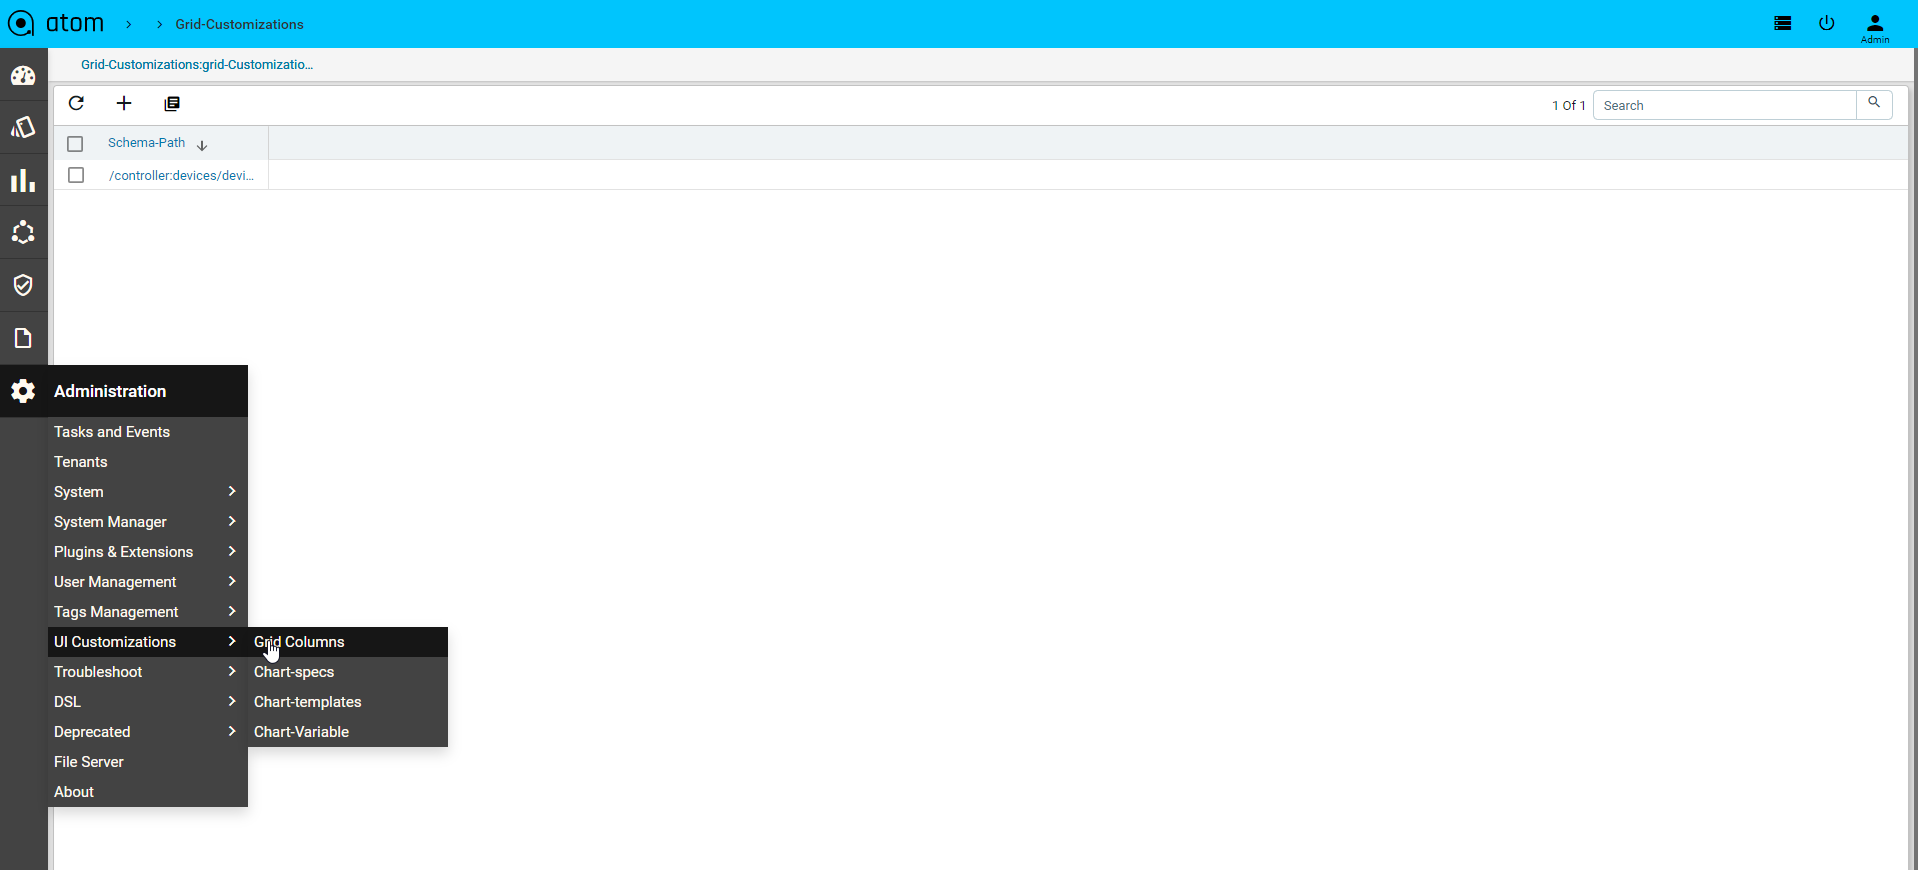
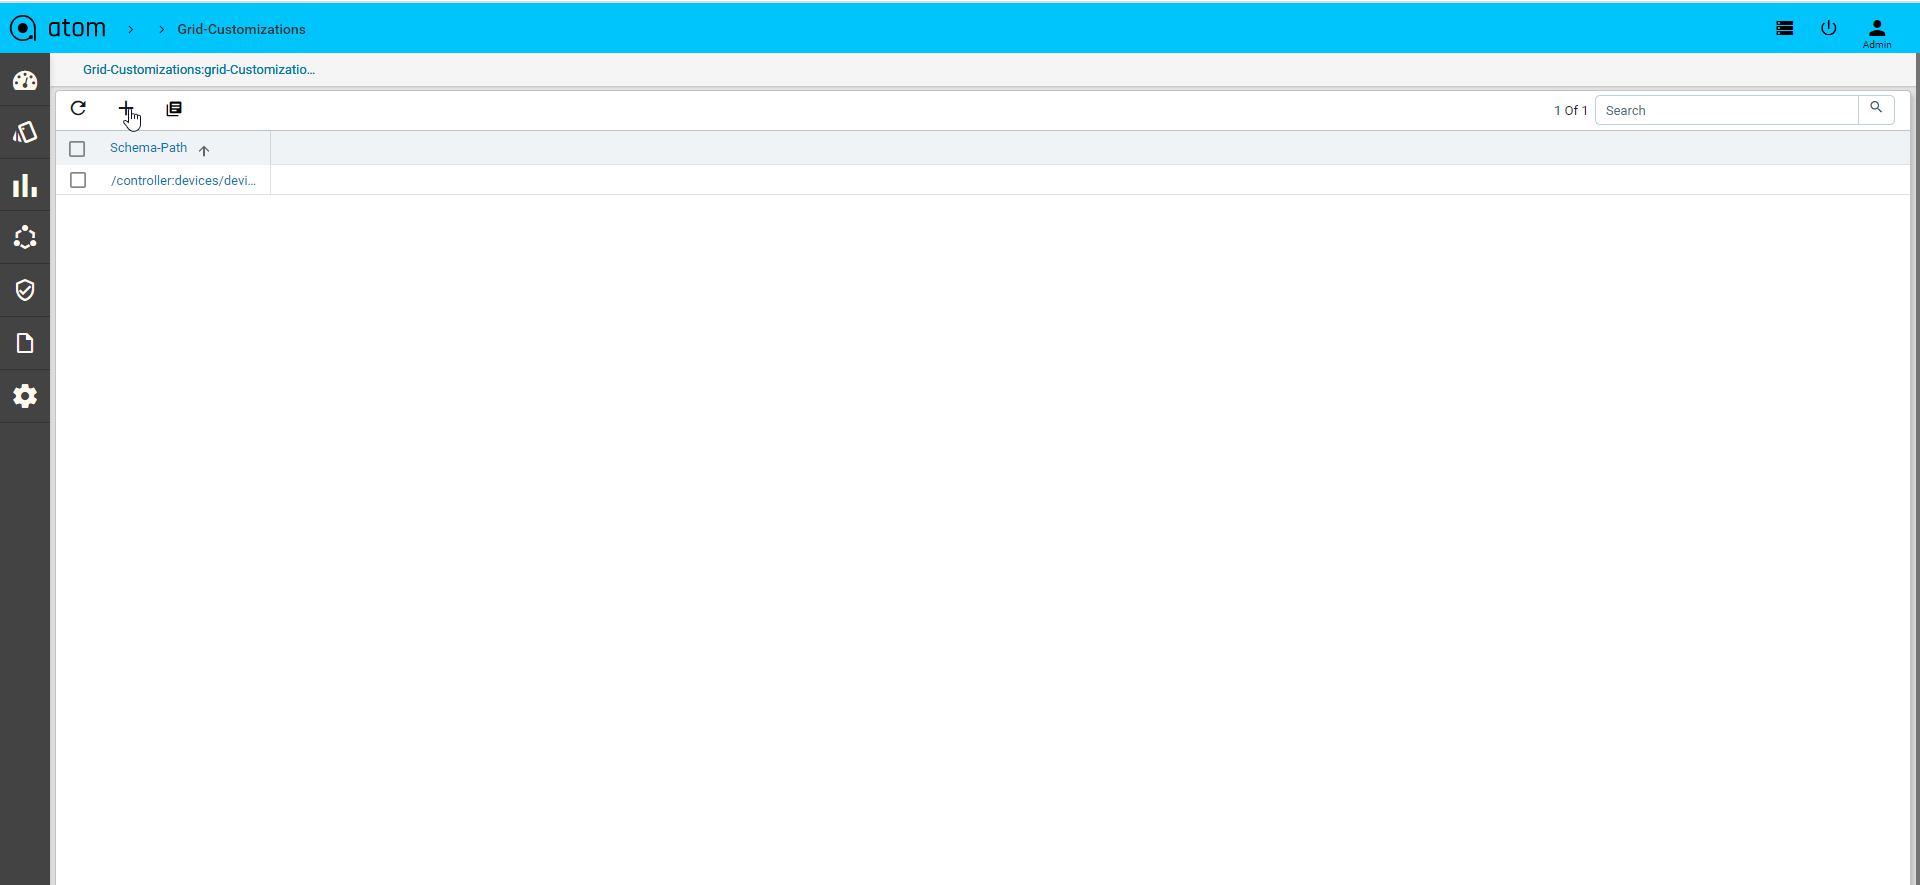
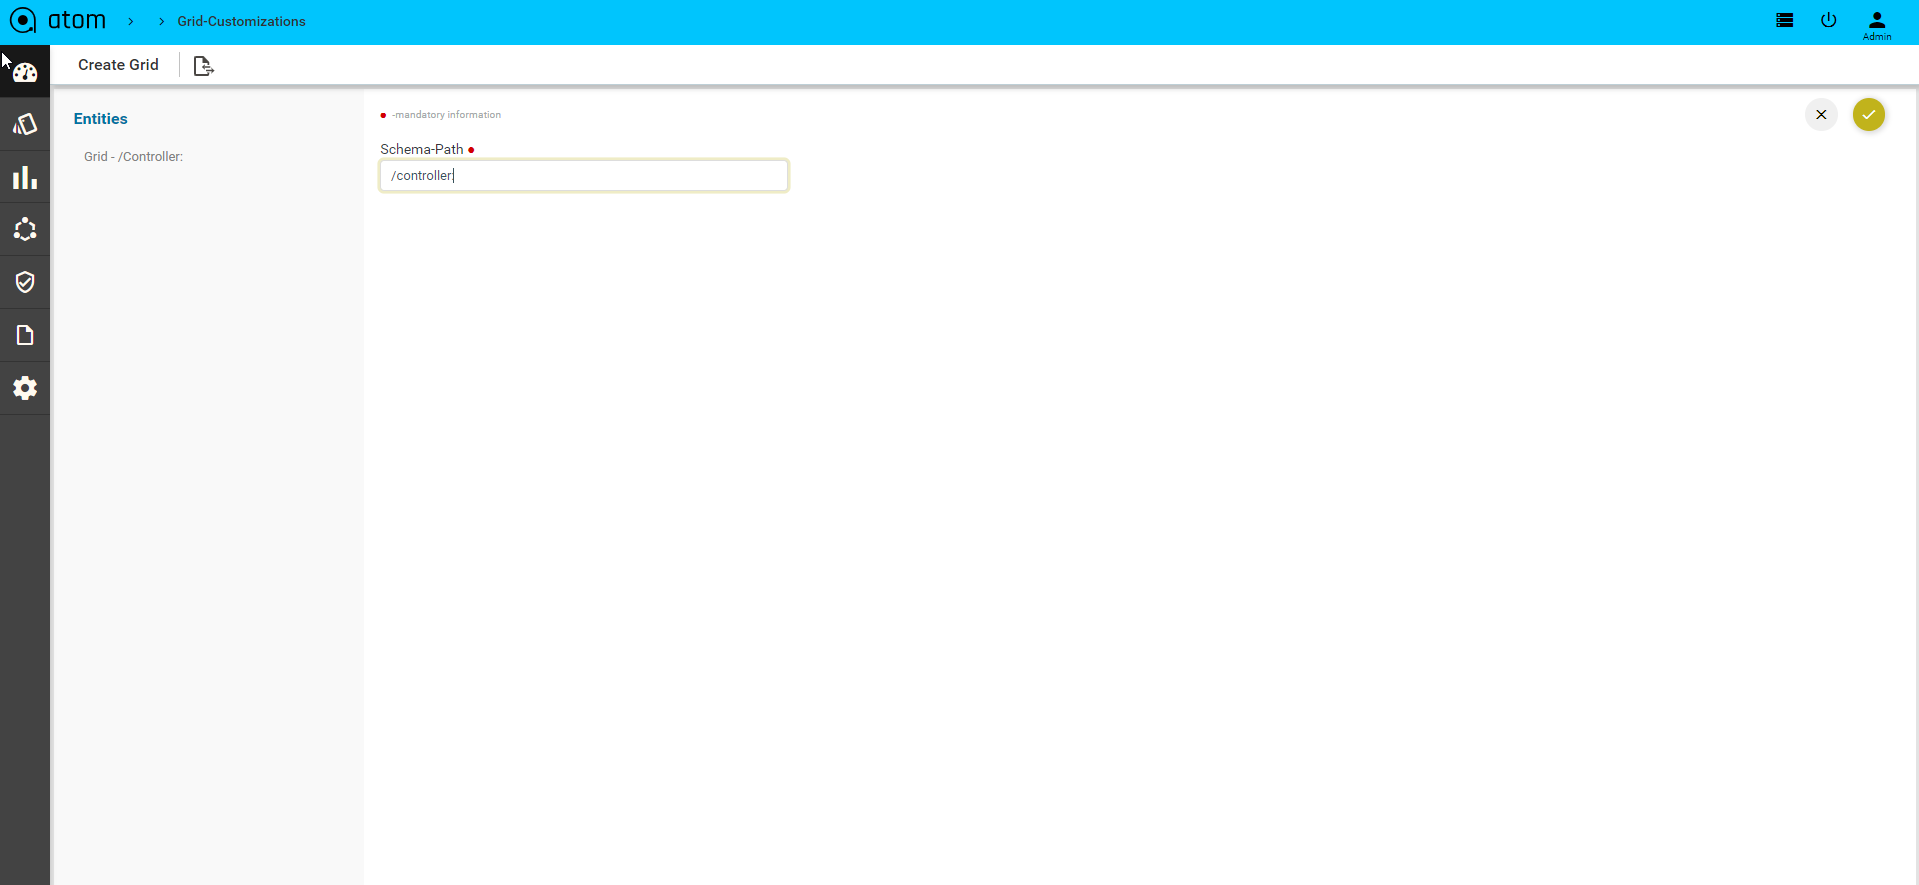
2.Chart-specs:
A Chart Spec defines the query to be used, variables used in the query and the intended graph type.For example, a chart spec can be written for a TopNUtilizedInterfaces report.The query would use variables for device and the N.
An admin may decide to create two invocations of this chart spec and make them available readily; one for top 5 and one for top 10.Admin can do so by creating 2 chart-invocation payloads and give 25 and 50 for the N value.An end user can run these two different charts out of the box.In addition, end user can tweak the parameter values and explore the graphs.
If a user decides to save the changed chart invocations it is a simple matter of changing the corresponding chart invocation objects.
Navigate > Administration > UI customization > chart -specs >Add
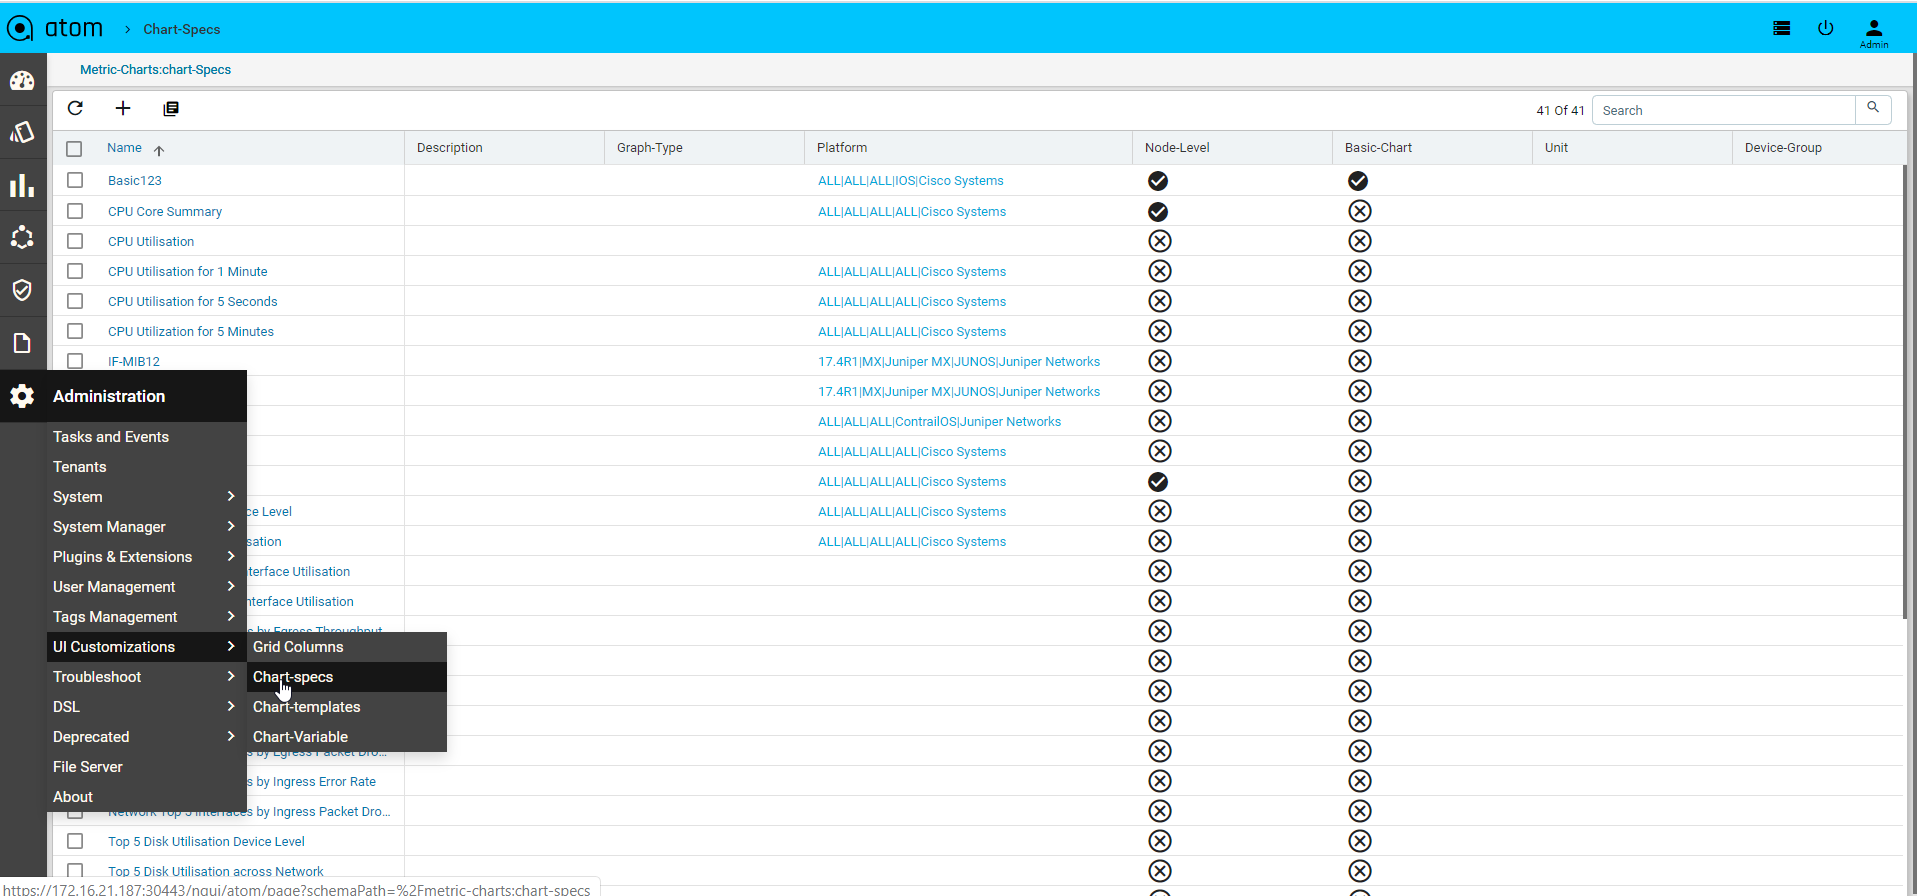
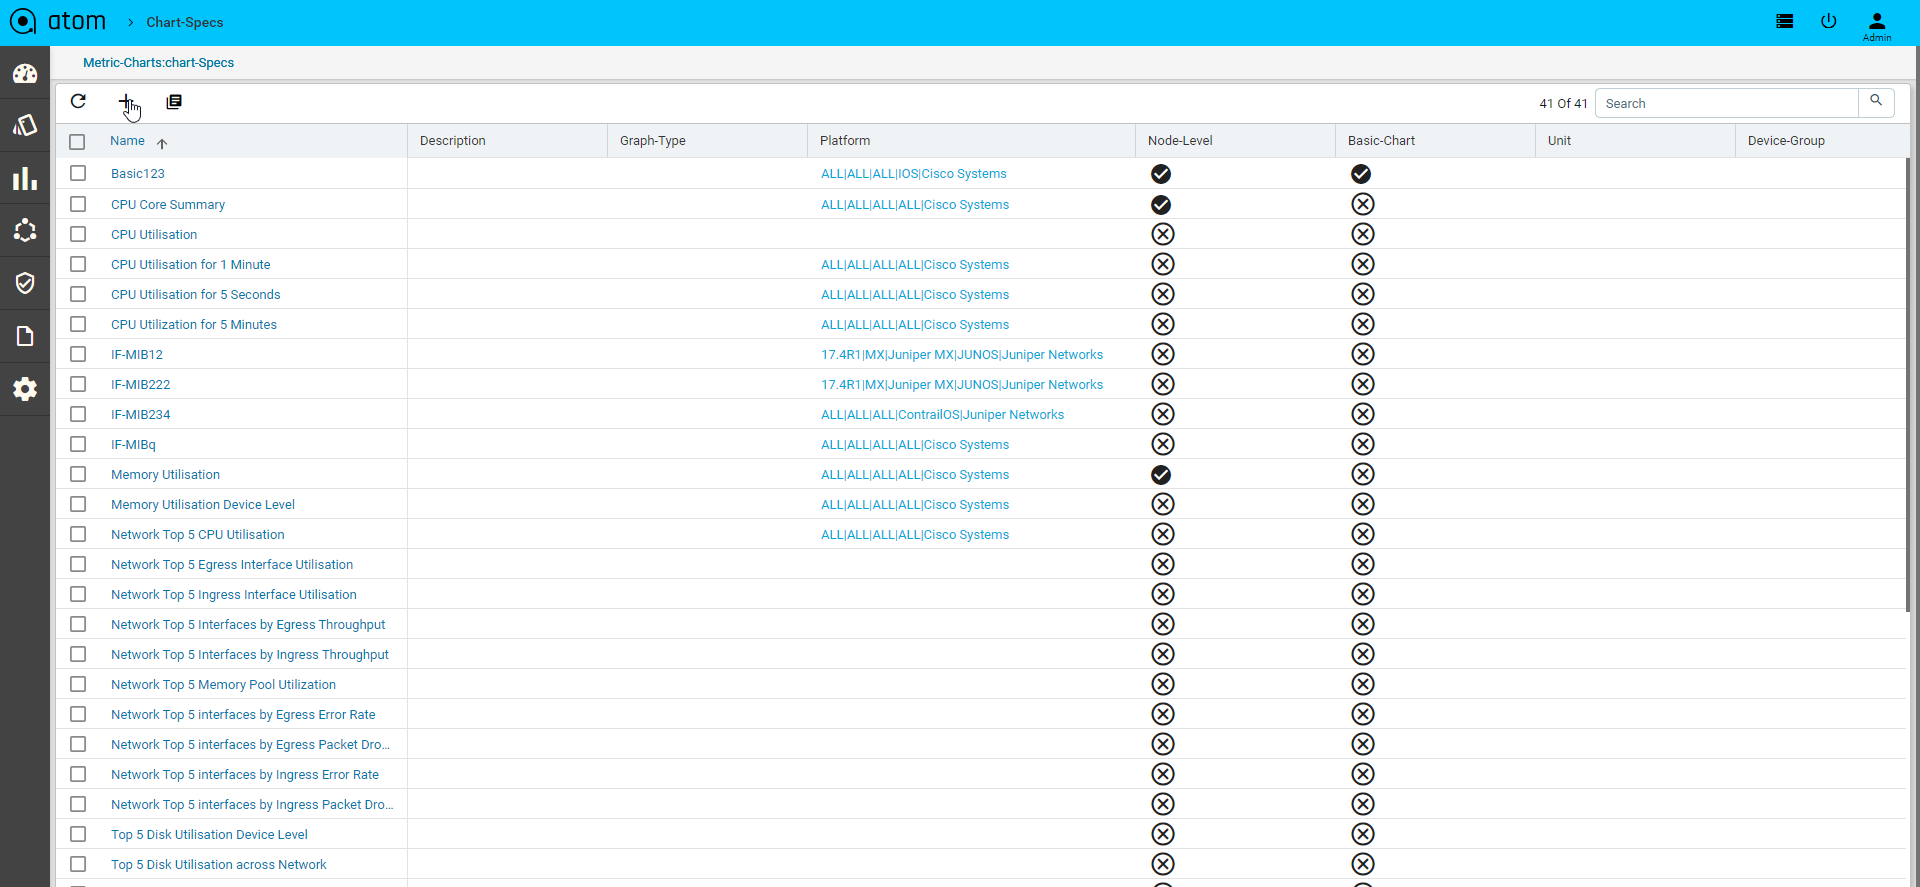
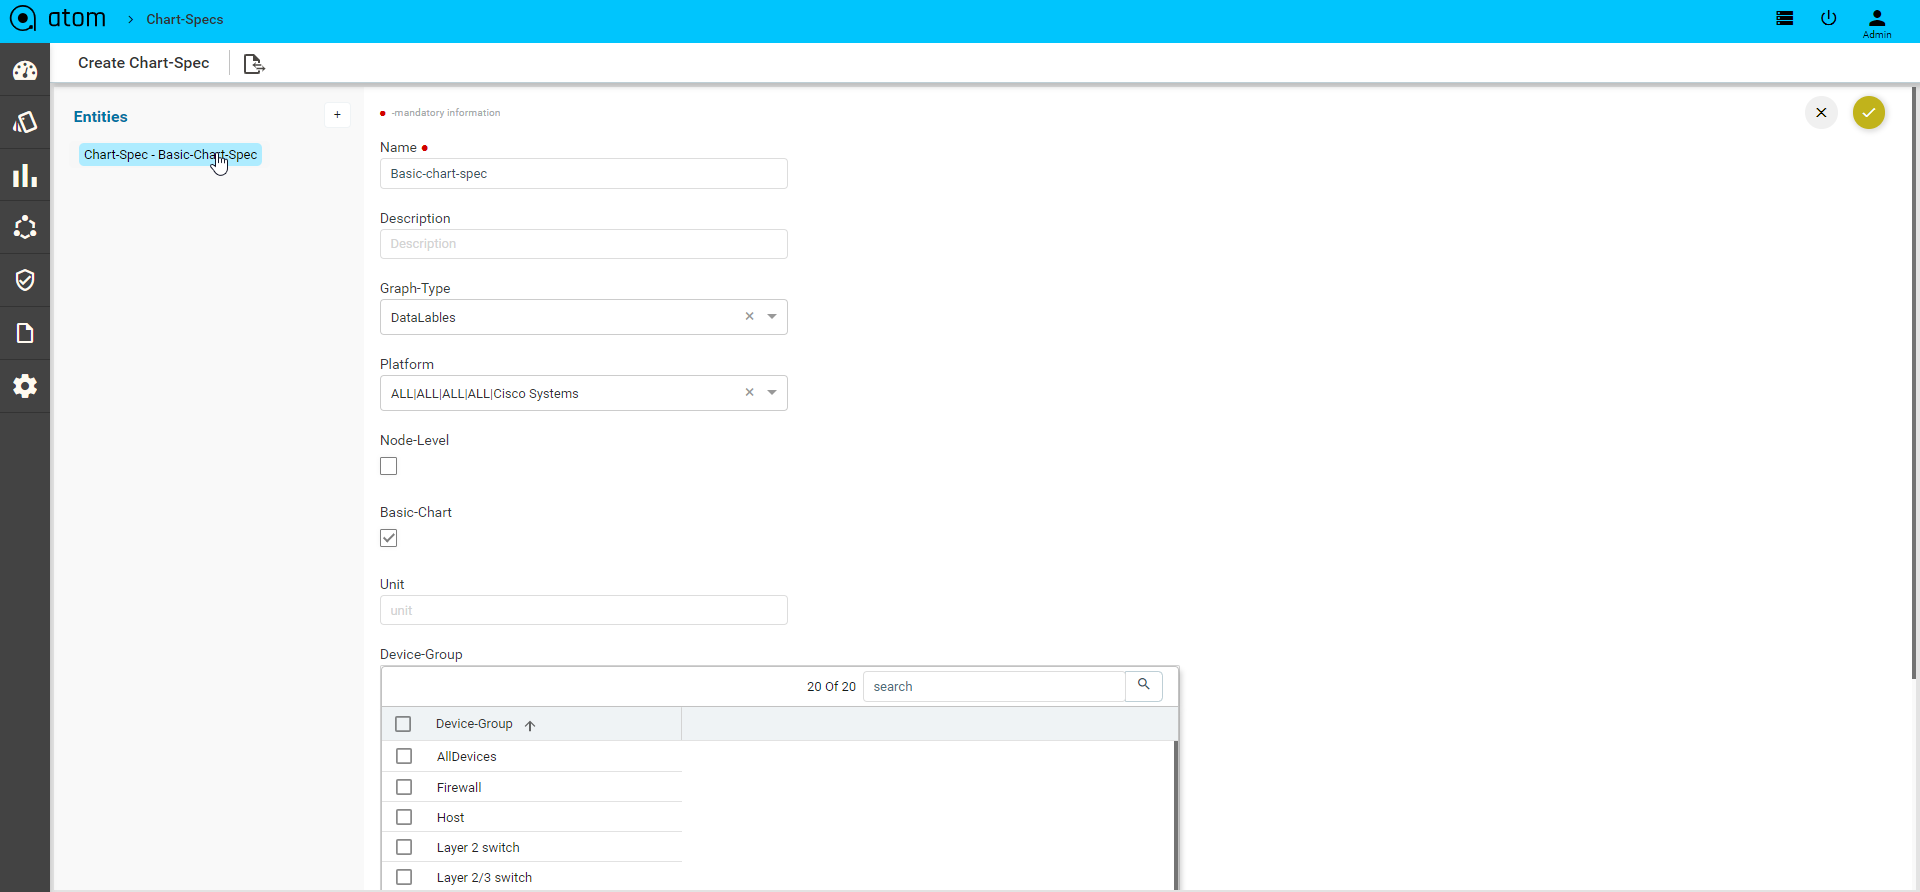
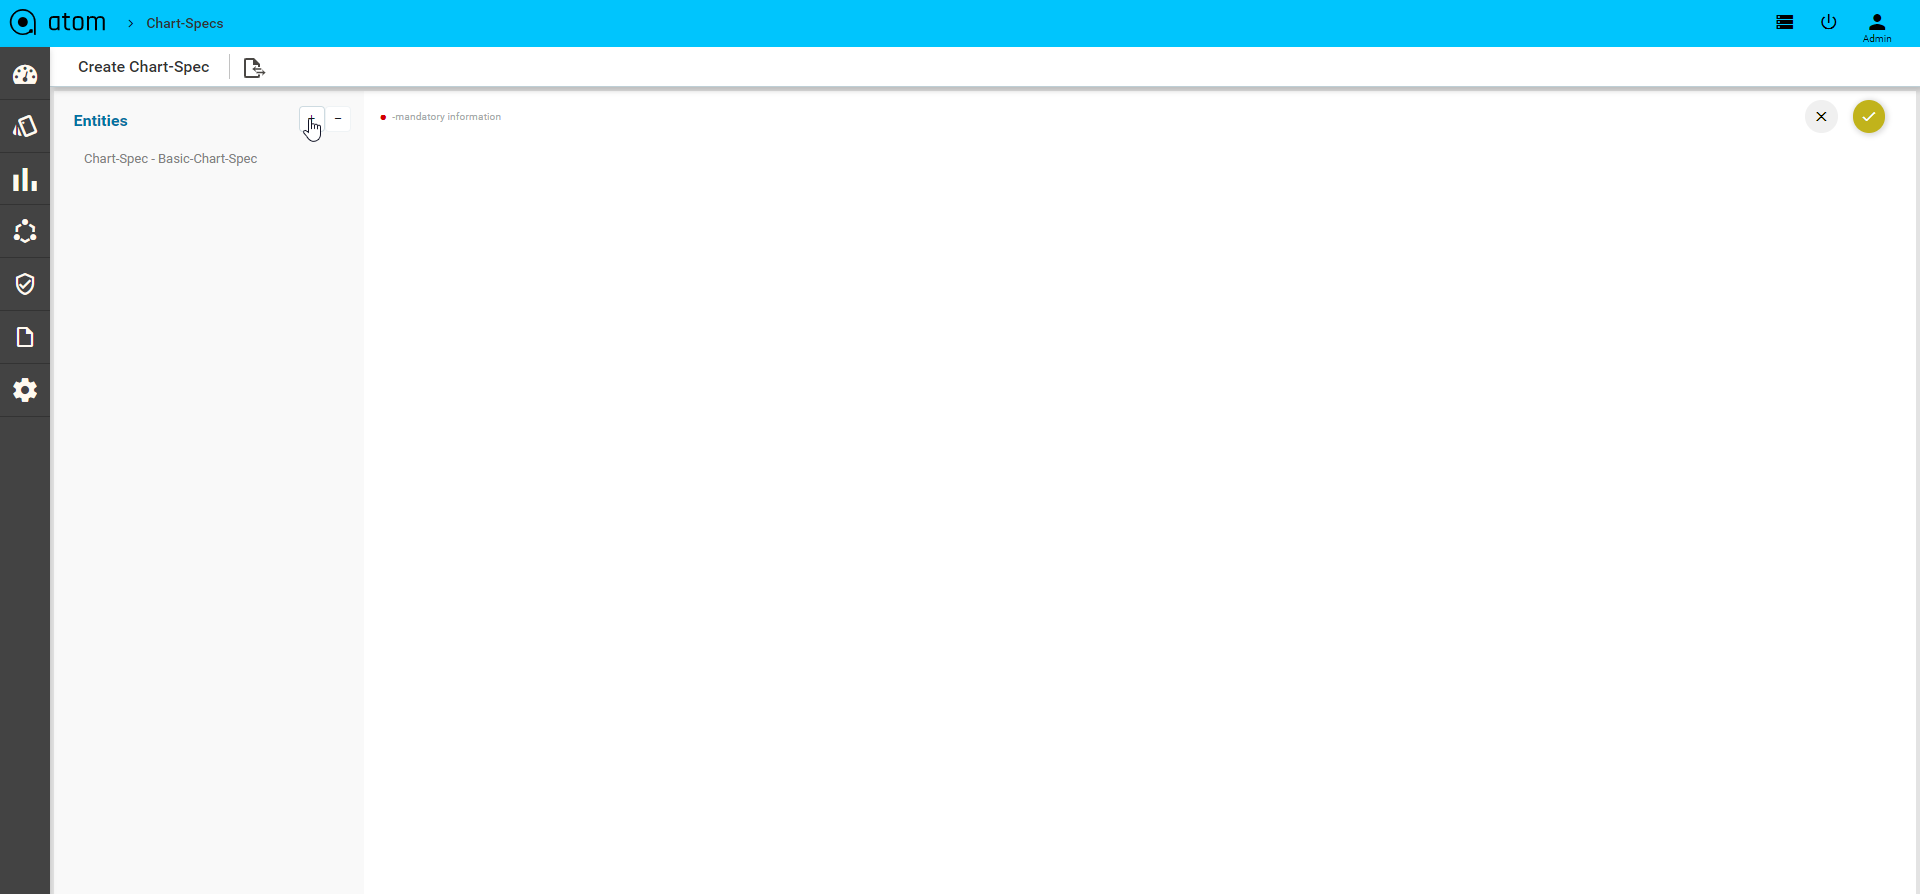
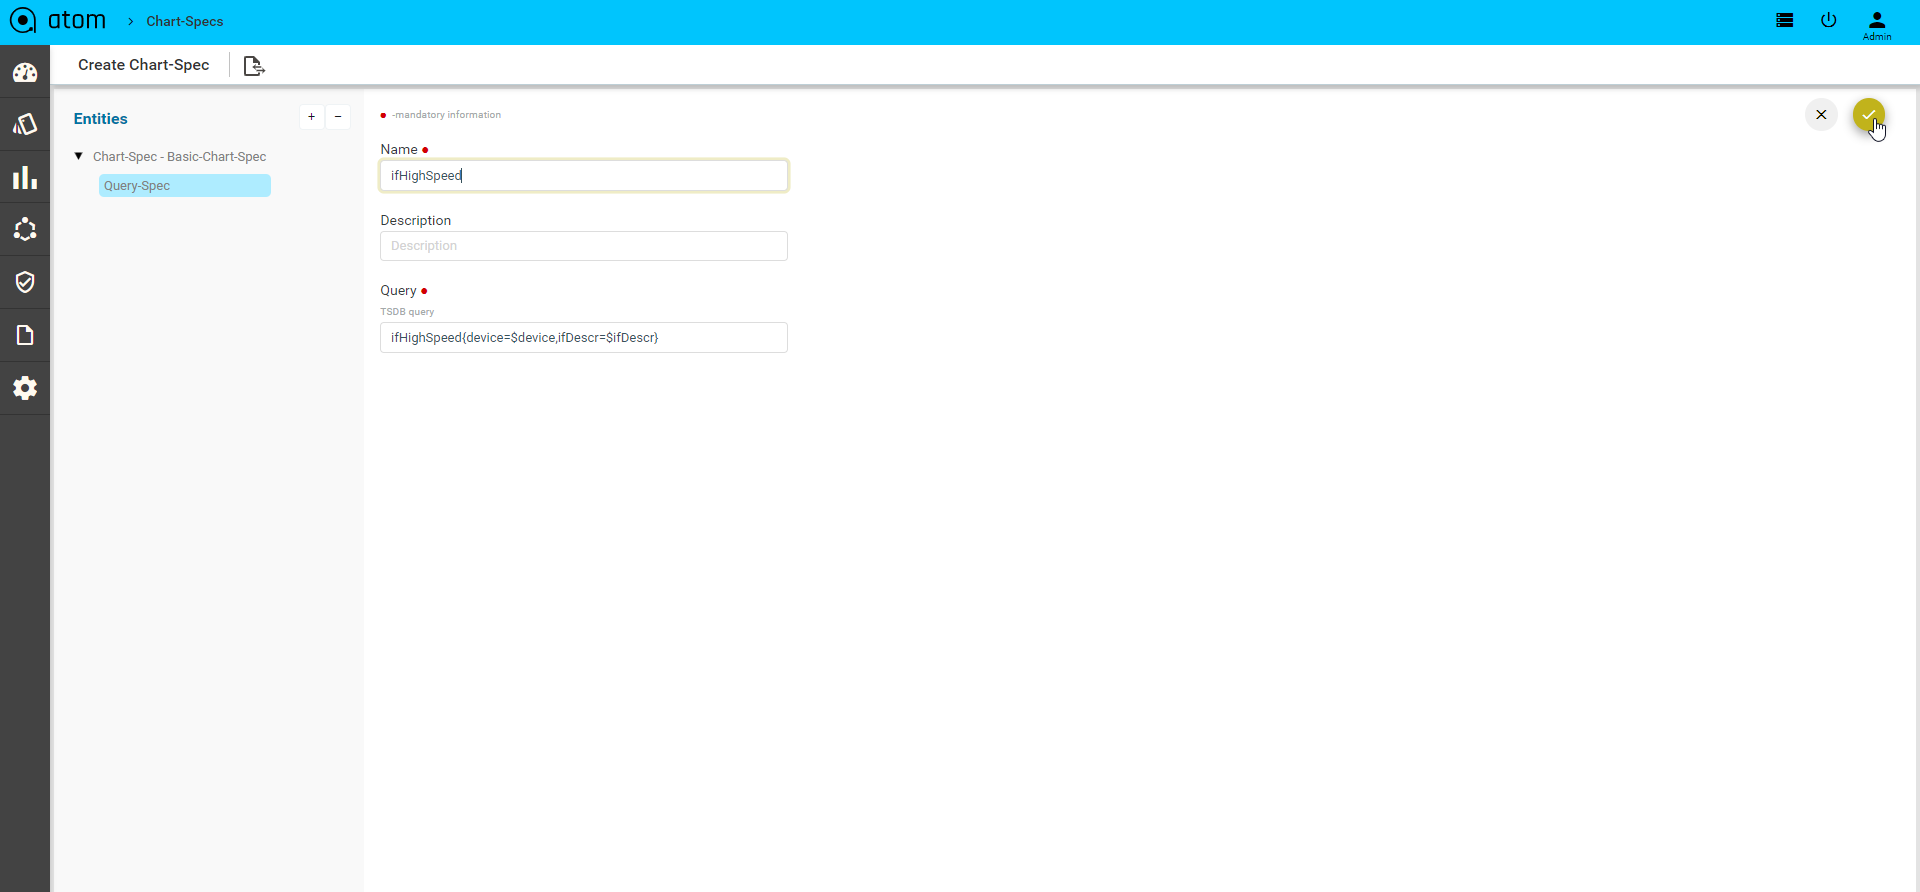
3.Chart-Template:
To define the template is a collection of custom charts.create the multiple basic and advanced custom charts can be grouped into one template.it should show the chart graph in monitoring
Navigate > Administration > UI customization > chart -template >Add
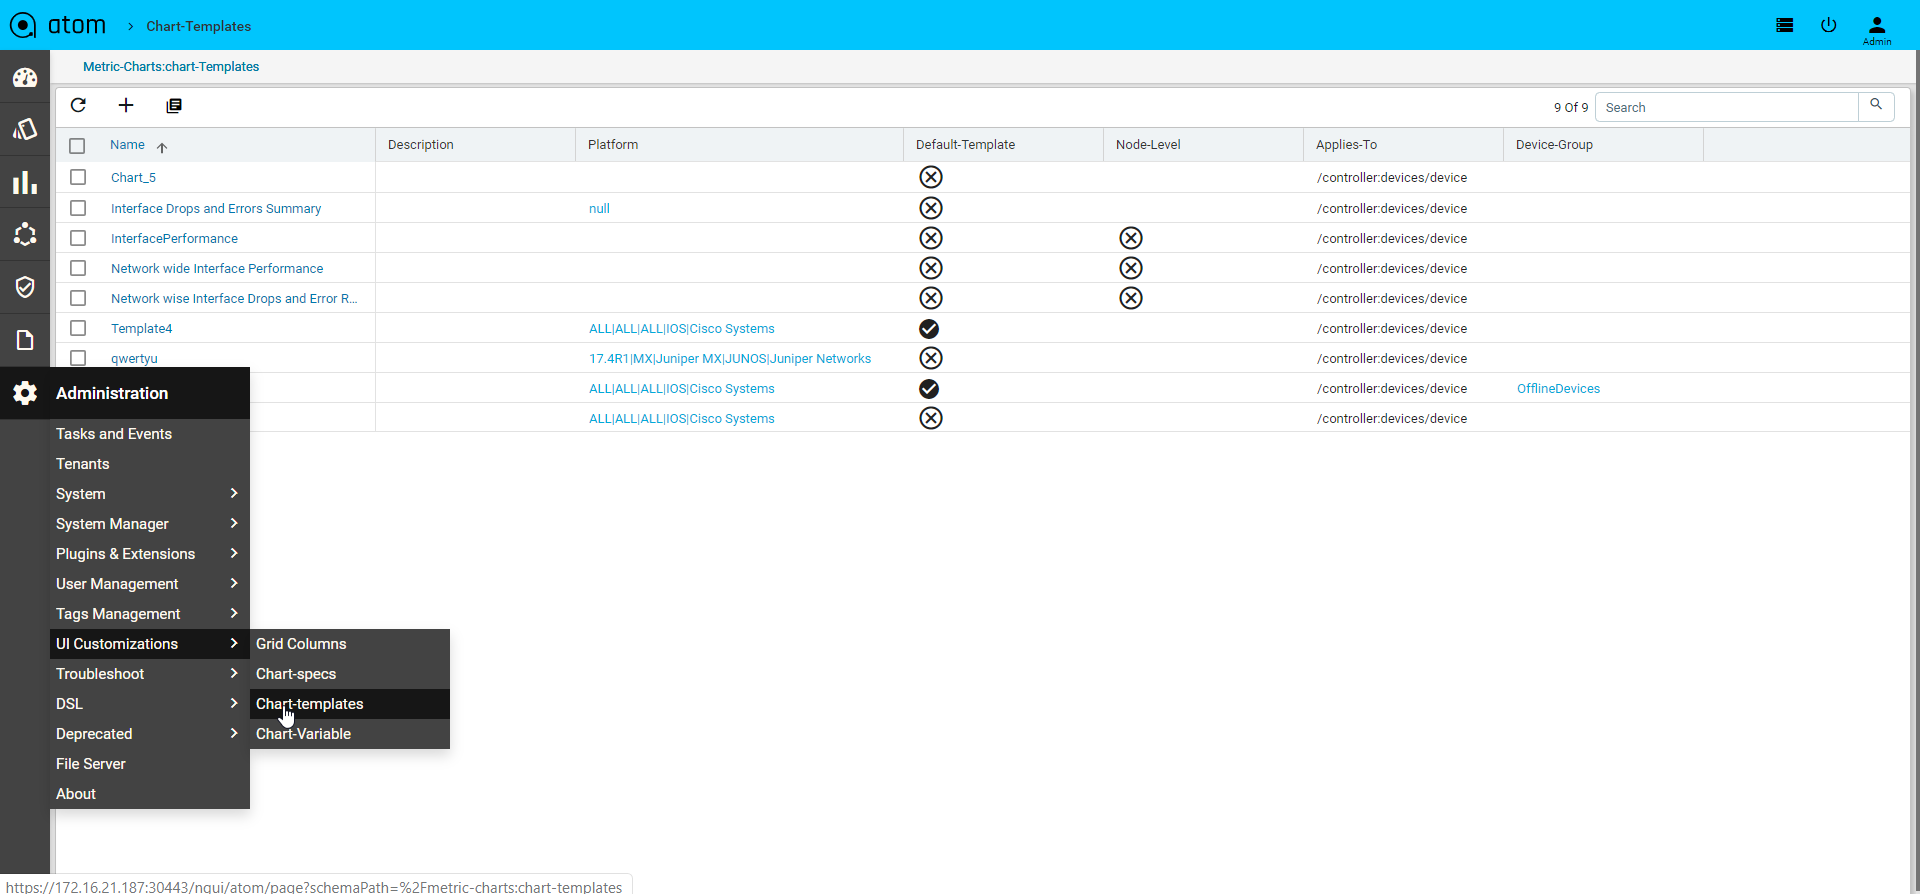
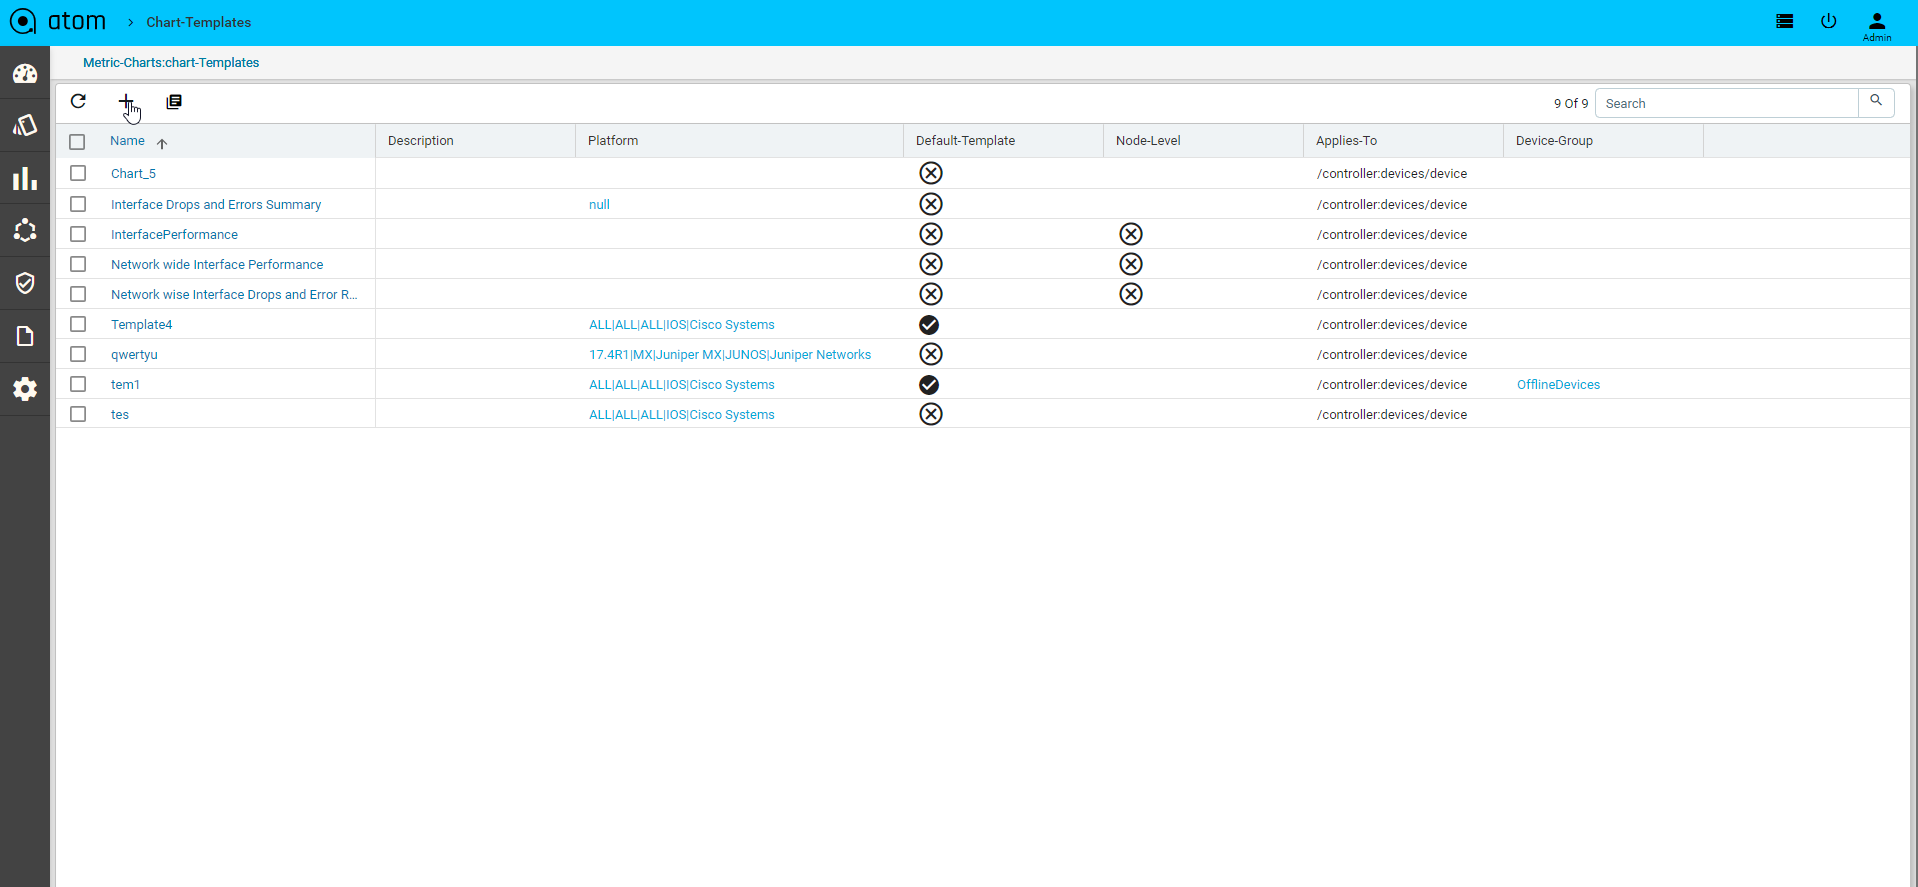
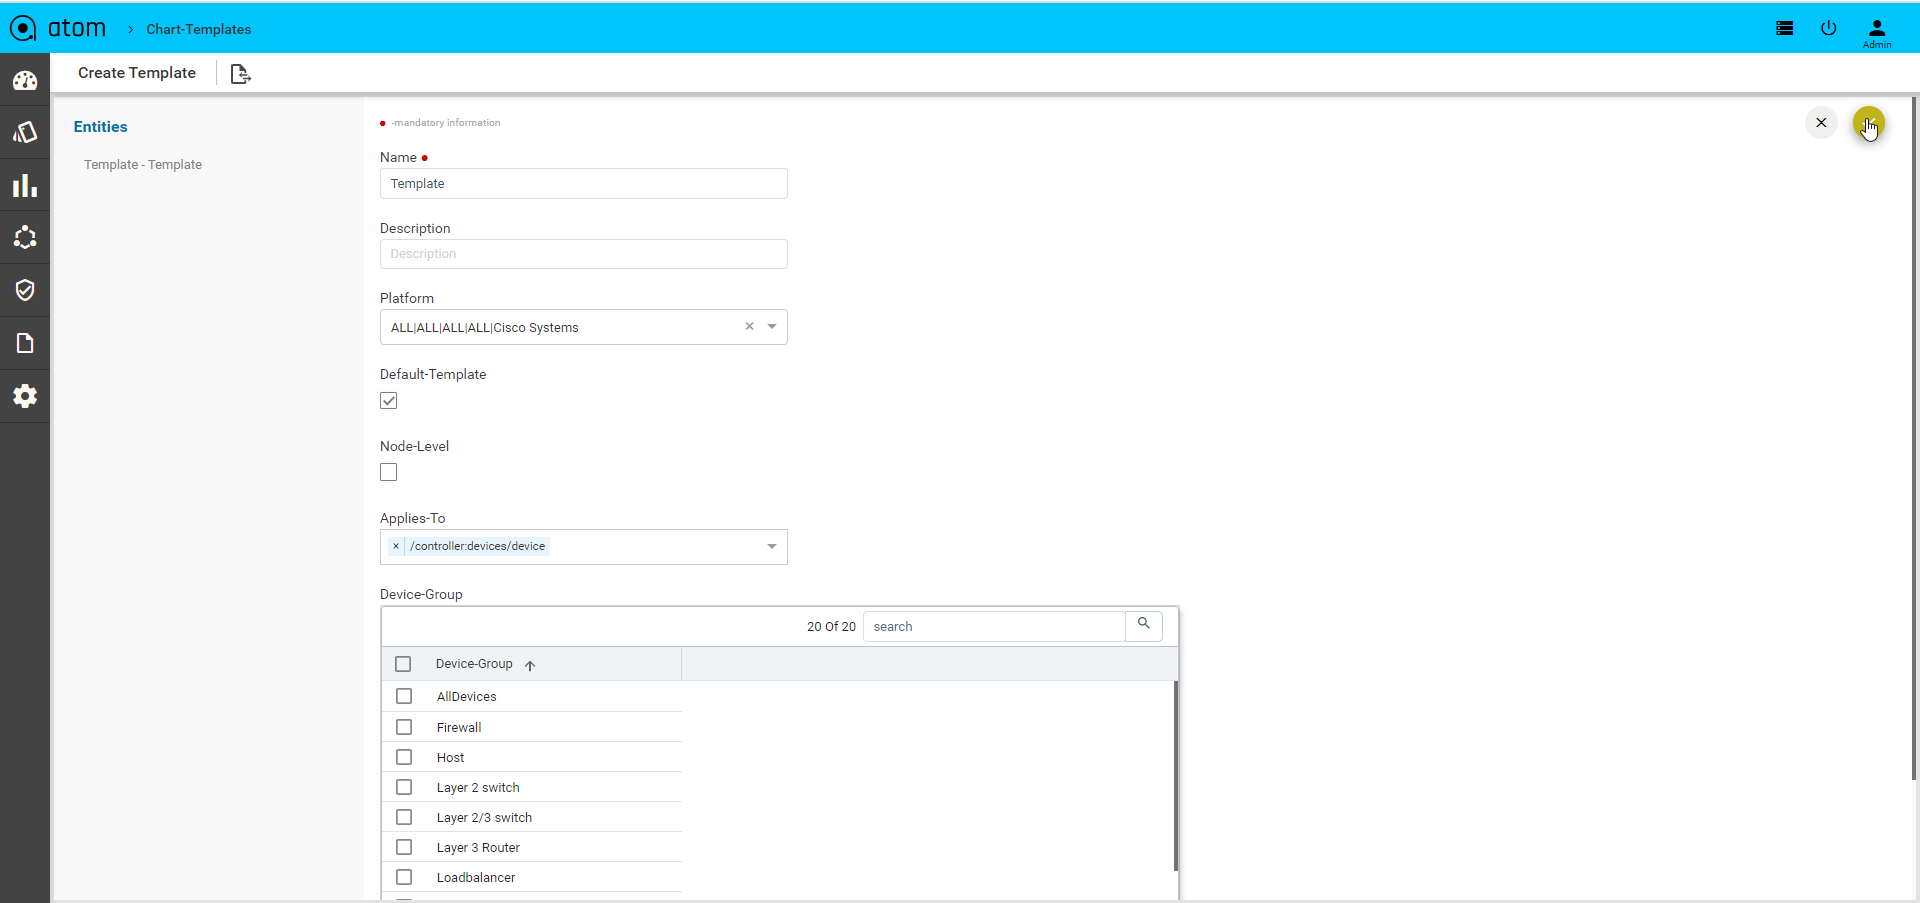
4.Chart-variables: To define a Variables are useful when the user is writing the queries to build a custom chart.Global variable which can be reusable across multiple charts
Here Two types of variables are Constant and Query,Query type is useful to fetch a list of entities like devices, interfaces etc.and constant is for any static values like bucket interval etc.
Navigate > Administration > UI customization > chart -variables >Add
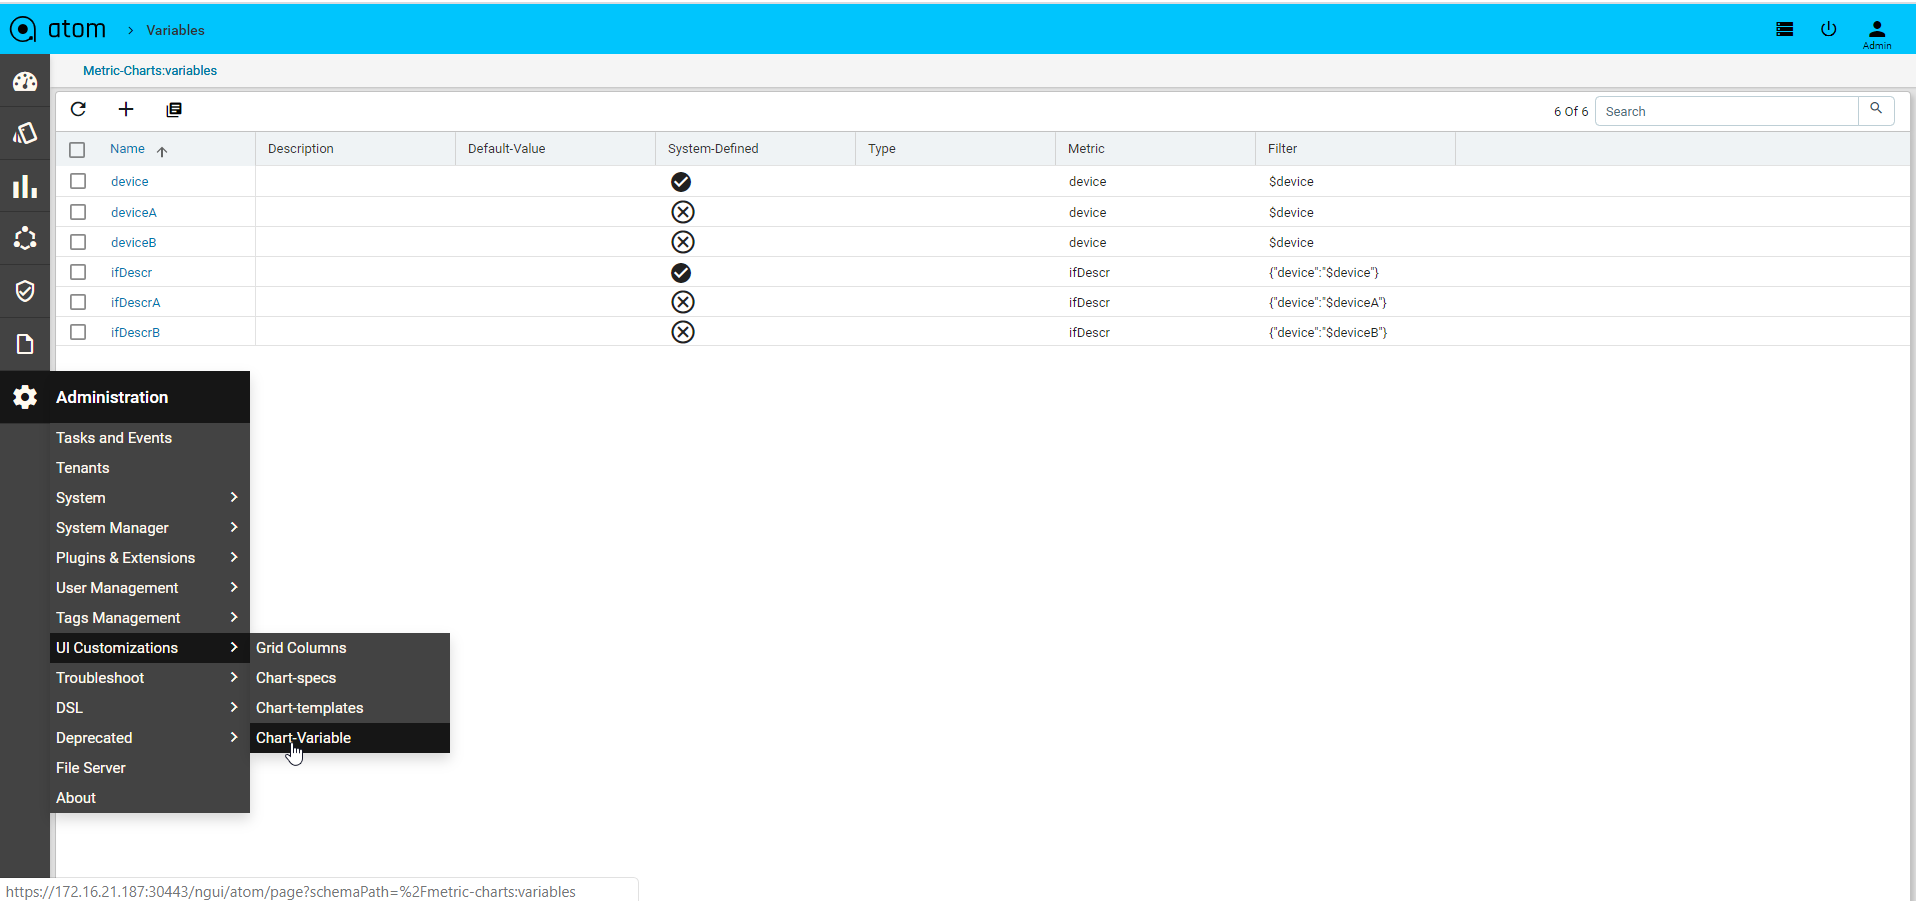
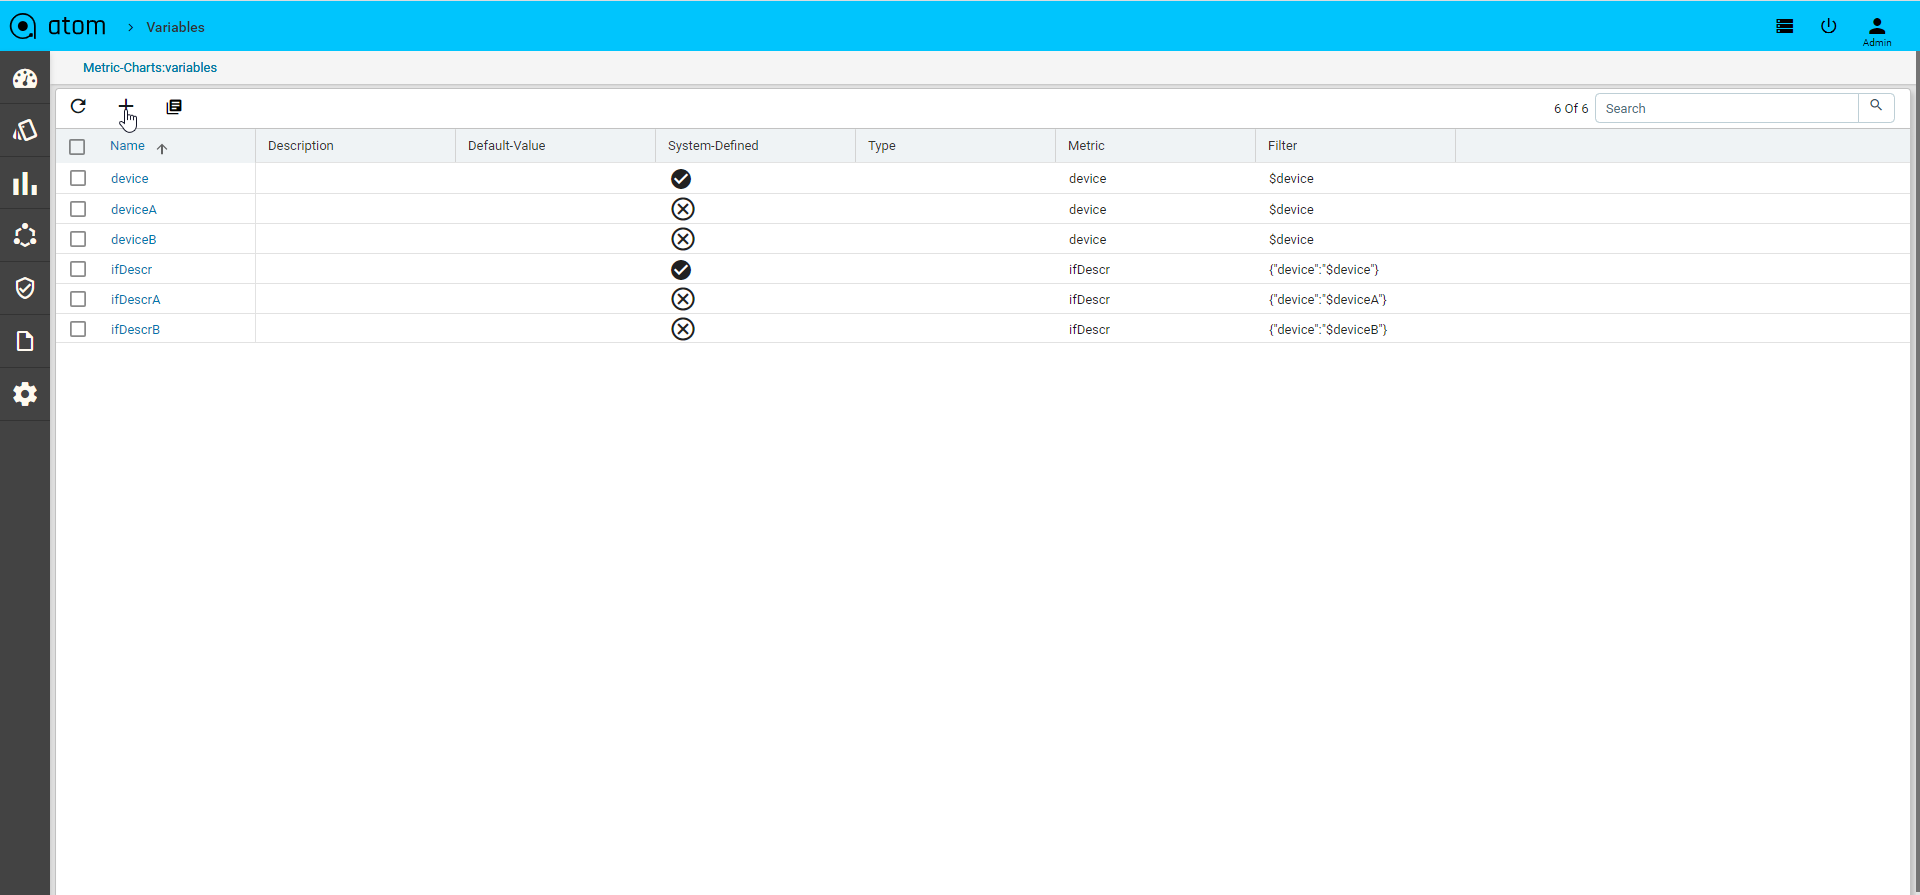
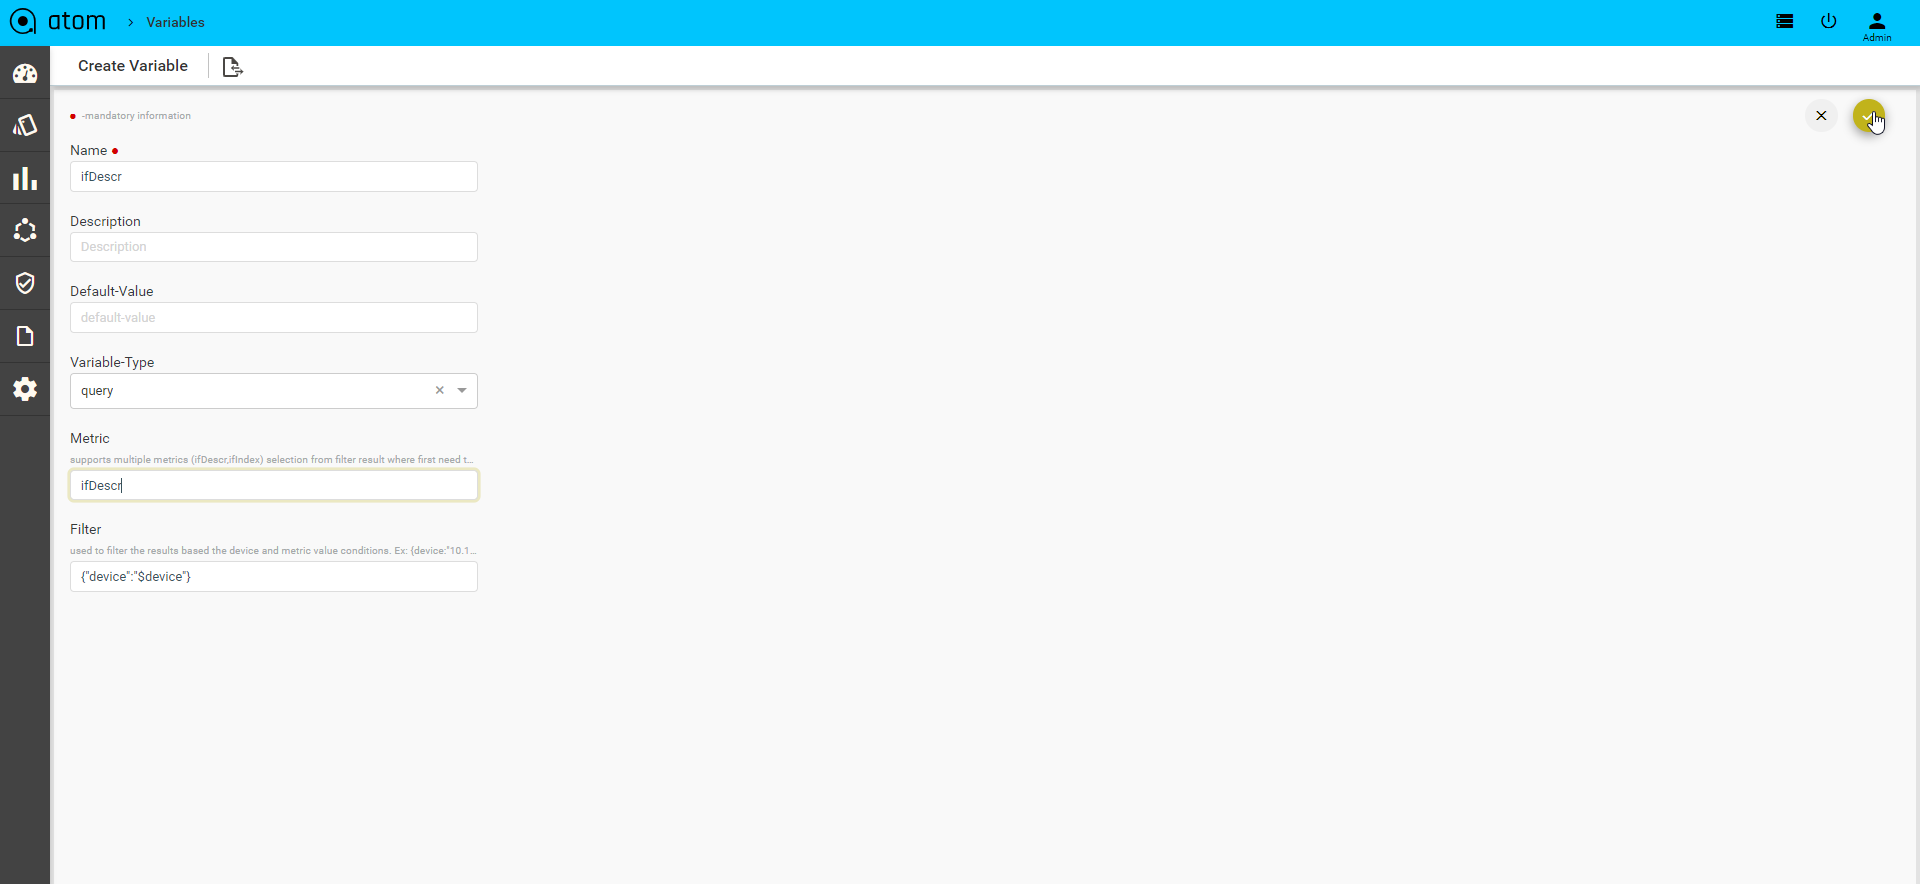
Troubleshoot
From the Troubleshoot tab, the system administrator can perform the following tasks:
Services & Metrics
The administrator can view a summary of the health of the server and the associated agents. All the services running on the ATOM server are also displayed here.
- Go to Administration > Troubleshoot > Services and Metrics
- In the left pane, click Servers > Components to view the different categories of the servers running in ATOM.
- Click Servers > System Health in the right pane to view the health of the components of the server.
The health of the associated services is also displayed in the lower pane.
- Click the Servers icon to view the Services in the right pane.
- Select a service that is running and view the Statistics and Events associated with the service in the bottom panel.
Queue Statistics
ATOM uses a bus to communicate various events between the different ATOM modules or components, thereby providing a view of the activity of the Naas Bus.
- Broker Statistics
- Naas Bus Monitor Statistics
Each row represents a particular event that ATOM components publish or subscribe to, thereby help in monitoring the Bus.
Device Comm and Inv
Ping
As an administrator, you can check the reachability of a device from ATOM using Ping Test.
- Navigate to Administration > Troubleshoot > Device Comm & In > Ping Test
- To create a Ping Test, fill the fields described below:
- IP Address: Enter the IP address of a device that needs to be verified for its reachability.
- Packet Count: Enter the number of ICMP Echo request messages to be sent.
- Time Out (sec): Specify a value for the time for which the ping command should wait for each reply.
SNMP
SNMP Tests You can test if SNMP devices are responding correctly to SNMP queries. By default, SNMP v2c is supported.
- Navigate to Administration > Troubleshoot > Device Comm & In > SNMP
- To create an SNMP test, fill the following fields:
- Device Name: Enter the name of the device
- SNMP Operation: Choose an appropriate SNMP operation from the drop‐ down menu:
- GET
- GET NEXT
- GET BULK
- WALK
- SNMP OID: Enter the OID of the SNMP device
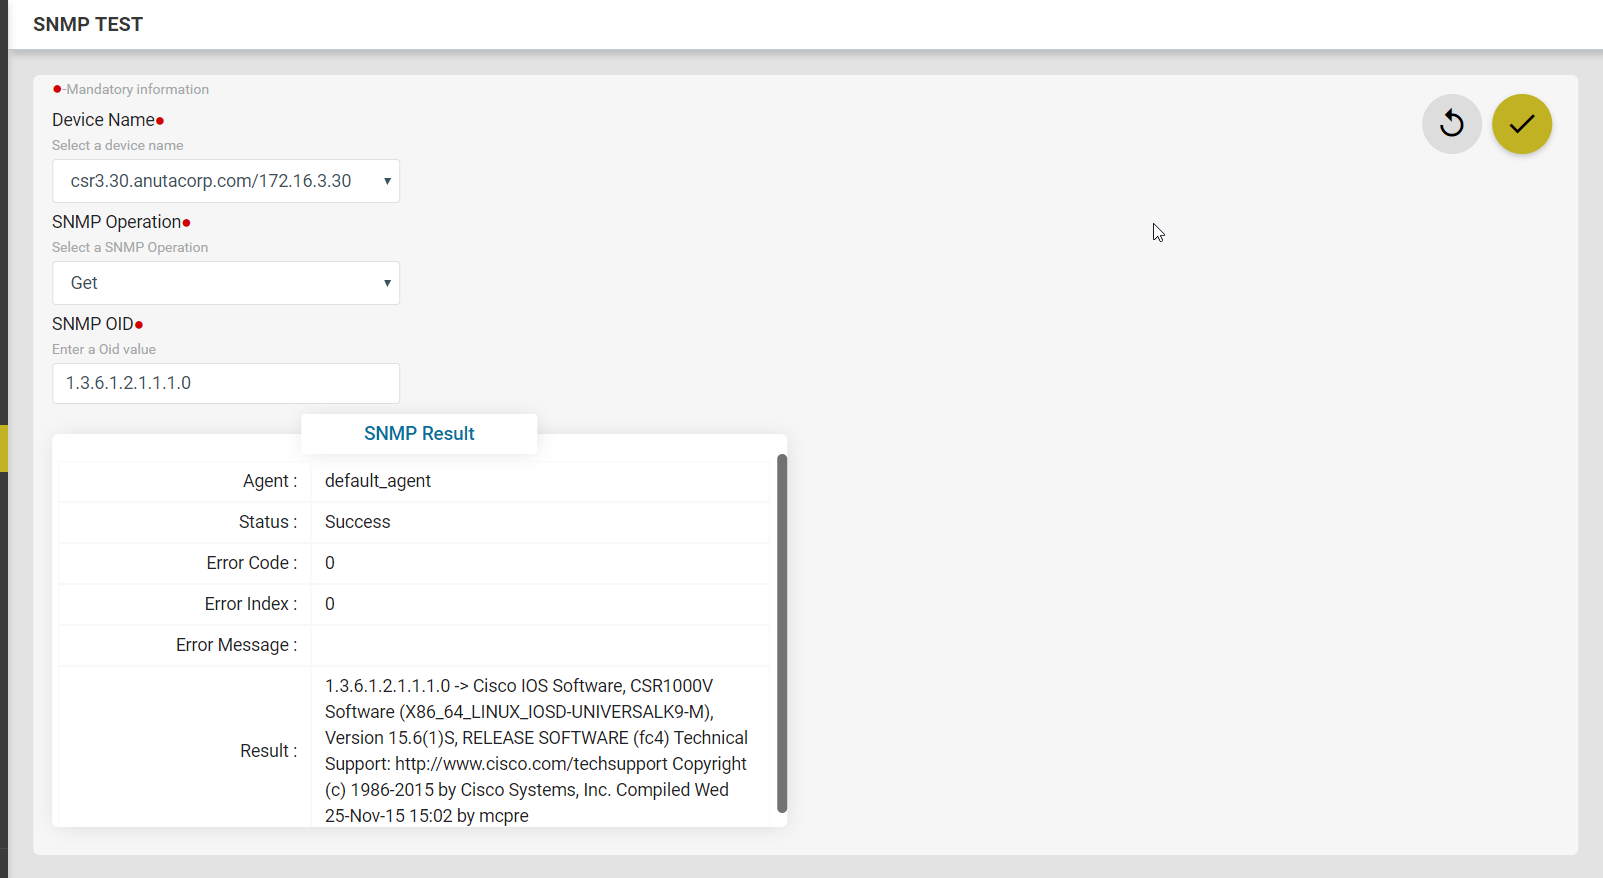
Config Parser
This utility helps you check the parsed output of any running configuration of any device. By doing so, you can verify the extent to which ATOM supports the config parsing for a given running configuration. All the parsed configuration can also be visualized in the supported data models in ATOM.
- Navigate to Administration > Troubleshoot > Device Comm & Inv > Config Parse
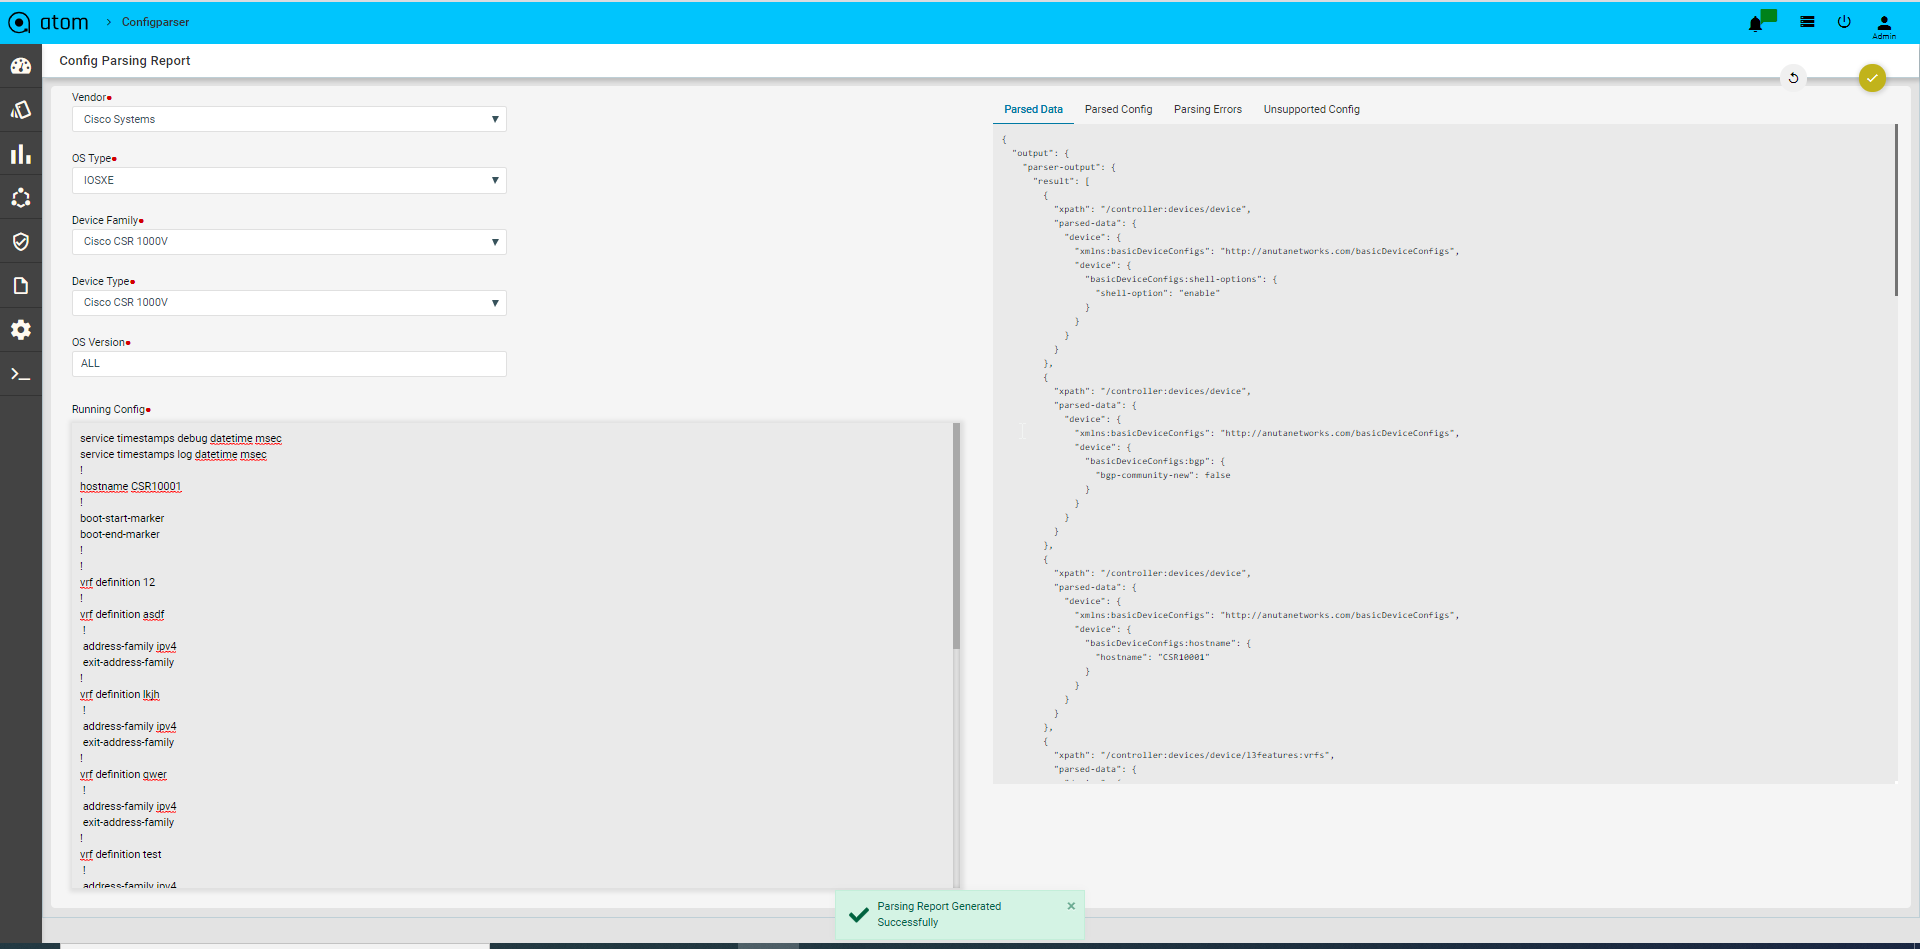
- Select the device family details for which the config parsing support needs to be verified in ATOM:
- Vendor: Select the vendor from the supported vendor list in ATOM
- OS Type: Select the OS type for the device vendor for which the config parsing needs to be checked
- Device Family: Select the device family that the device belongs to
- Device Type: Select the type of the device belonging to the selected device family
- OS Version: Select the version of the OS
- In the Running Config pane, paste the running configuration of the device for which config parsing needs to be verified
- Click Submit to generate the Config Parsing Report
The results of the Report can be viewed in the right pane as
- Parsed Data: The configuration, which is parsed in ATOM, for which the data model is available can be viewed in this tab.
- Parsed Configurations: The running configuration that is parsed into blocks by ATOM can be viewed in this tab.
- Parsing Errors: The parsed configuration derived in ATOM but with errors can be viewed in this tab.
- UnSupported Configurations: The running configuration for which there is no parsing support available in ATOM can be viewed in this tab
File Server
File server helps users to upload and can also down the packages related to the services or any workflow if any user wants to save a package in the repository.Navigate to Administration > File Server and click on the add button. Name: Enter a name of the package Choose File: Upload a package or a file which needs to be saved.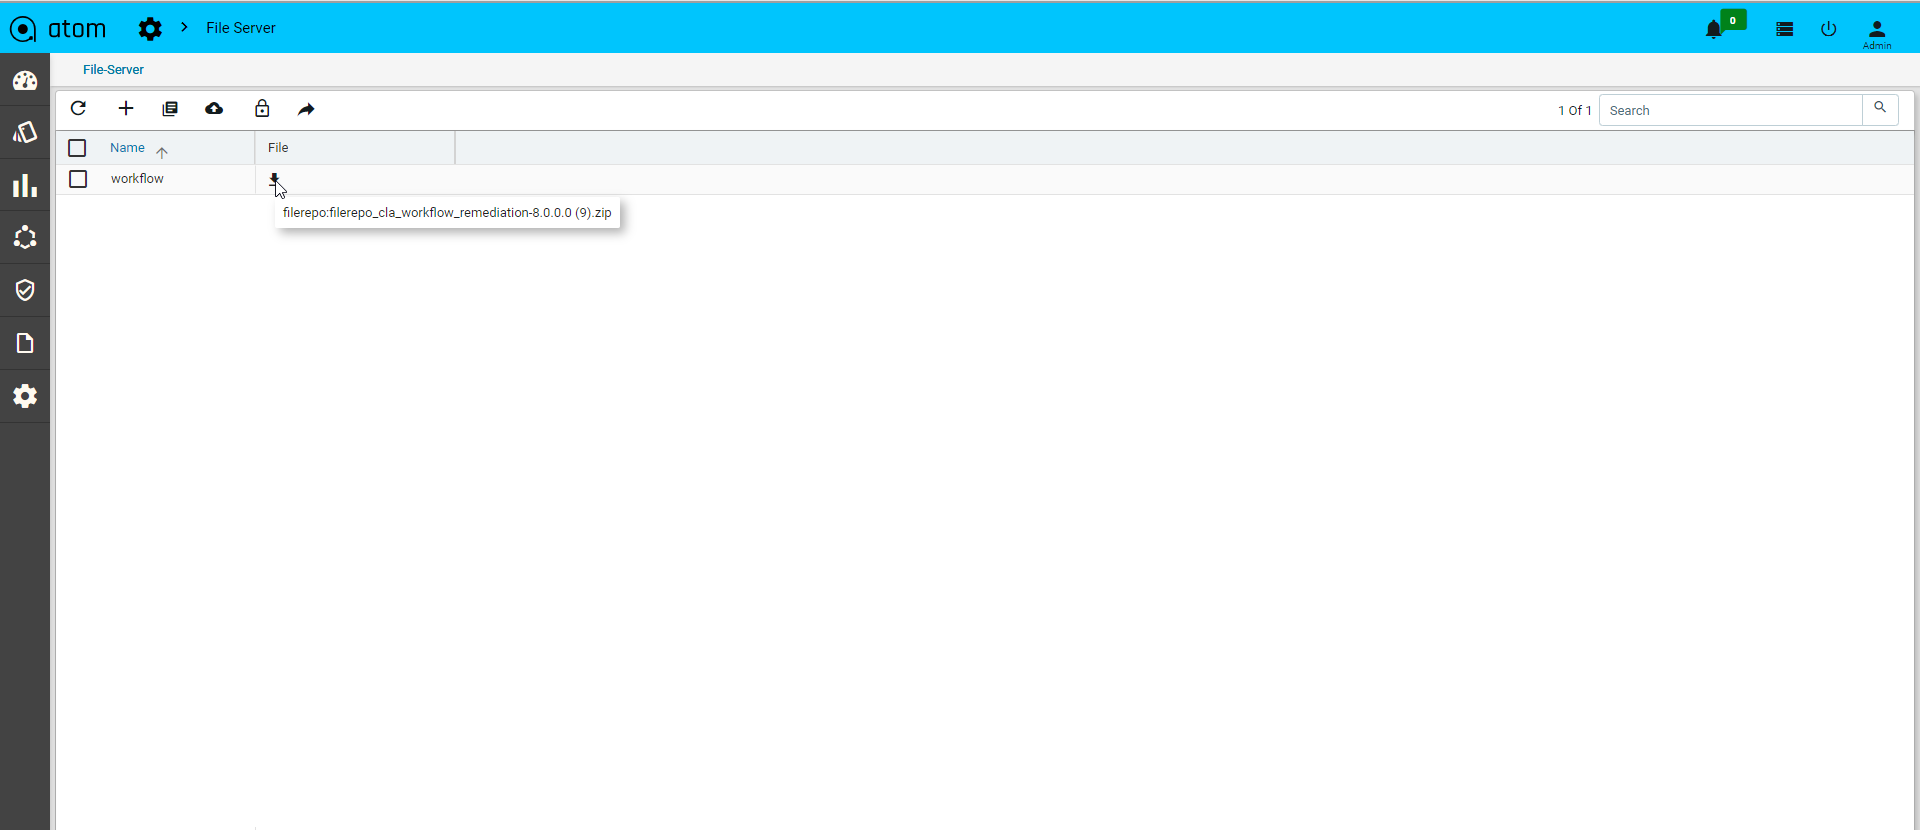
About
Navigate > Administration > About