Skip to content

Organizations are clamoring for digital transformation. Emerging tech trends such as 5G, Internet of Things, and SD-WAN will also heavily tax today’s networking infrastructure. Given the subsequent deluge of data and demand for ubiquitous uptime and availability, how will network operators cope?
Improved visibility will certainly help given it’s the single biggest challenge for networking professionals as discovered in a recent 451 Group survey. However, building proactive and smart networks with in-depth Network Analytics is the most optimal path to satisfying the connectivity needs of any organization.
A mixed bag of tools
Any given network speaks different languages and relies on multiple data sources such as SNMP, Streaming Telemetry, SNMP traps, Syslog, and NetFlow for network visibility. This cacophony creates extreme complexity, and as a result, today’s monitoring strategies fail to ingest the variety of information that a network provides. Consequently, organizations are forced to rely on multiple monitoring solutions to derive end-to-end visibility as well as different tools to satisfy diverse requirements such as event handling and performance requirements.
There are many other drawbacks in scenarios whereby NetOps teams look beyond a single tool in a quest for more efficient network monitoring & management:
- Lack of a single collector for multiple datasets
- Resulting data isolation
- Lack of performance & availability monitoring capabilities
- Lack of event correlation & centralized view of the entire network
- Lack of reporting capabilities
- Manual verification of issues
- Manual ticketing & Change Request
- Lack of auto-remediation
- Inability to scale the breadth of the network
Additionally, the use of multiple tools tends to create islands of information resulting in both a loss of intelligence and security risks, not to mention the time spent managing everything. Often, organizations don’t realize the opportunity cost associated with this non-value-added activity.
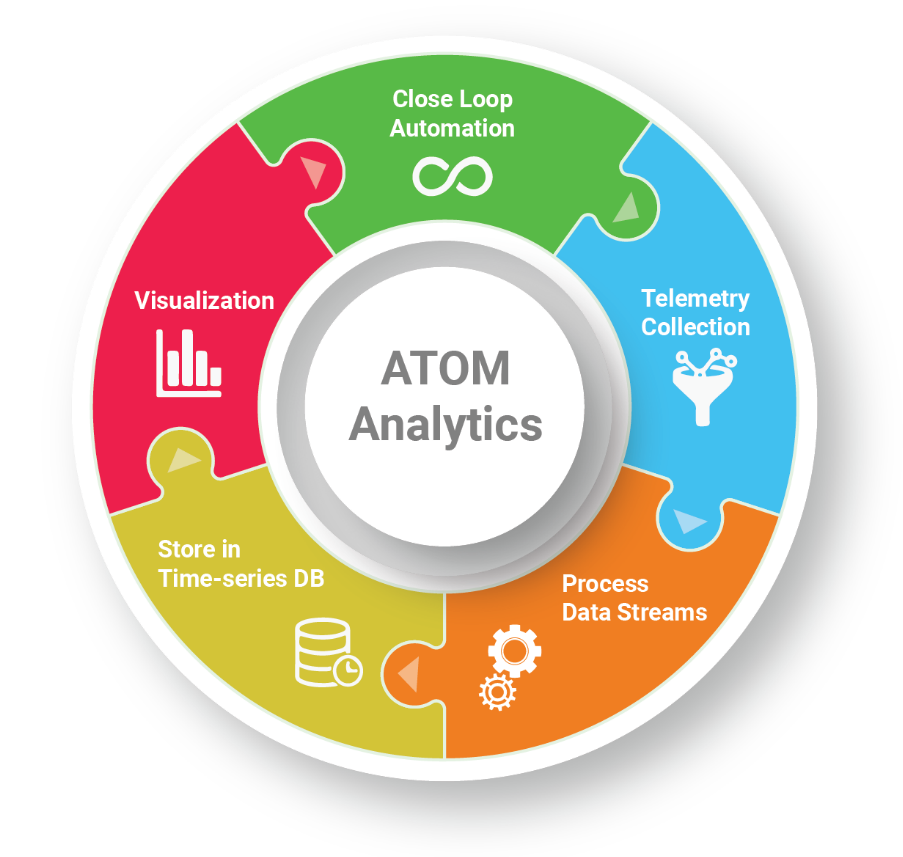
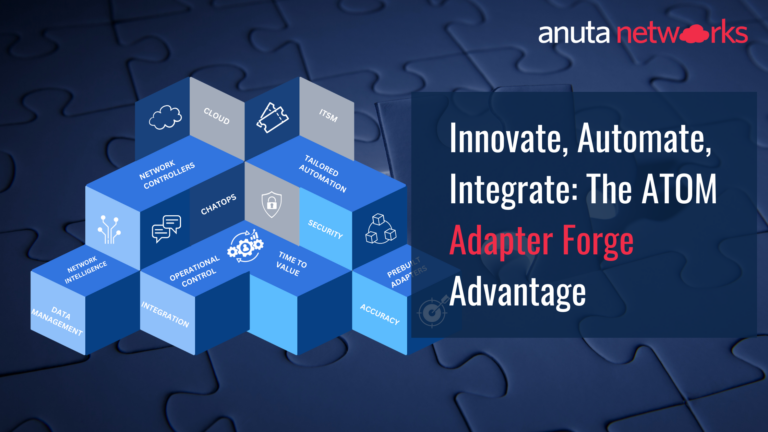
ATOM Analytics & Telemetry
Anuta Networks ATOM delivers a unified monitoring solution
Anuta Networks ATOM’s Analytics & Telemetry capabilities move beyond traditional monitoring and explore network feedback, correlate the information at different times against a baseline, and intelligently deliver data-driven insights taking the guesswork out of network management.
ATOM’s monitoring capabilities include the collection of operational and performance data from multiple data sources such as SNMP, Streaming telemetry, SNMP traps, and Syslog across any multi-vendor network infrastructure, thus serving as a single-source-of-truth. ATOM also delivers the following capabilities to help customers achieve a unified network monitoring experience:
- Distributed streaming platform – Apache Kafka forms the basis of real-time analytics offered by ATOM. The ingested operational and performance data is readily available for immediate consumption through ATOM or other external tools.
- Highly scalable time-series database – Millions of metrics from disparate sources are stored in a scalable time-series database to facilitate ATOM’s capability to deliver high precision reporting. ATOM also supports roll-up & downsampling of data to optimize usage of the database.
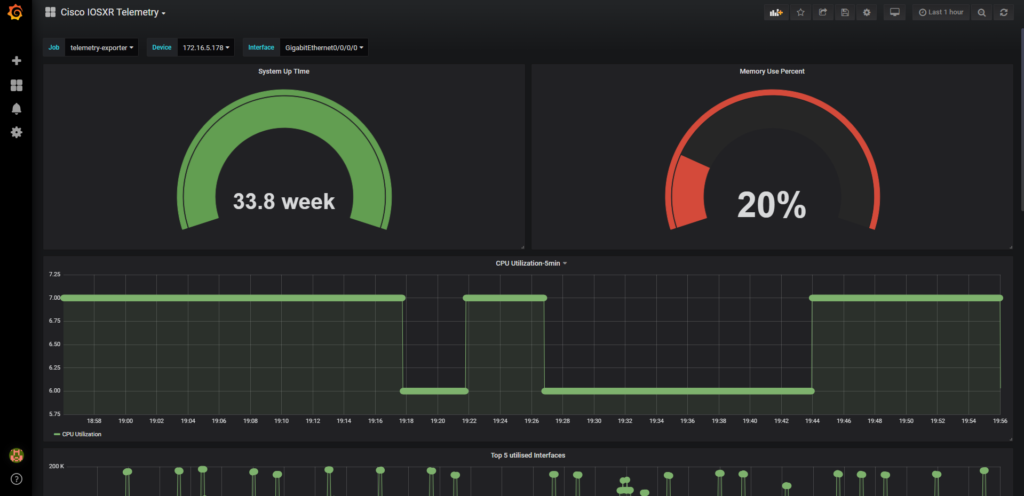
- Performance monitoring – ATOM offers in-depth key-performance indicators in the form of heat maps and tables. The granular level statistics delivered by ATOM includes platform level statistics, routing protocol metrics, device health statistics, detailed interface-level statistics, and much more helping NetOps professionals to remain network aware and responsive to users.
- Event Handling & Correlation – In addition to the operational and performance data, ATOM also retrieves configuration data and performs service provisioning of any network infrastructure. This capability helps to correlate any issues in the network to the device and service configuration level and take appropriate action through the ATOM network compliance
- Availability monitoring – ATOM can define availability & latency thresholds to ensure device reachability through ping & traceroute.
- Geo-distributed architecture – Latency is a key focus in organizations running business-critical applications. Given its modern, web-scale microservices architecture, ATOM is ready to serve a distributed network infrastructure and cater to low-latency requirements.
- Multi-Vendor Infrastructure – Given its highly flexible platform, ATOM has developed support for 45+ vendors and 150+ platforms for unparalleled support. More importantly, ATOM collects a variety of information from the network to deliver a truly unified and single-pane-of-glass management experience.
ATOM as a Single-Pane-Of-Glass
Robust alerting & reporting
Collection of operational and performance data alone does not serve the needs of the NetOps teams. The greater the visibility into the network, the faster it helps to ascertain the availability, performance, and user experience to troubleshoot and fix problems as they arise. Alerting & reporting plays an equally important role in NetOps to speed remediation. ATOM delivers actionable insights & intelligence through its real-time analytics and reporting framework given the following capabilities:
- Highly customizable dashboards – ATOM natively supports customizable dashboards & through its integration with Grafana can facilitate NetOps team monitoring that’s relevant to a given organization. ATOM also supports model-driven user interfaces including RBAC, Multi-tenancy & Geospatial views.
- Topology Visualization – ATOM can overlay real-time operational & performance data to topology maps.
- Policy Definitions – ATOM can mix & match conditions as well as set threshold values to trigger alerts suitable for the network.
- Open Platform – ATOM supports integration into external collectors such as Splunk and event enrichment databases to provide a better monitoring experience.
- Auto-ticketing – ATOM can fully integrate into ITSM tools such as ServiceNow and Jira to automatically trigger tickets, change requests, and on-demand approvals based on the analytics & telemetry data available.
- Automated Alerting & Alert Routing – ATOM supports flexible alerting through email, Slack, alarms, and webhooks to offer an array of options.
- Trigger advanced Workflows – Automate & trigger known troubleshooting techniques through ATOM’s workflow automation.
- Comprehensive Reporting – Derive performance & compliance reports with custom filters at the platform, device, interface, and regional level using the ATOM’s robust reporting infrastructure. ATOM also supports live & historical reporting that can be easily emailed or downloaded as PDF, XLS or CSV formats.
- Auto-remediation – Trigger ATOM’s closed-loop automation to perform auto-remediation of known issues in the network. ATOM delivers the complete solution.
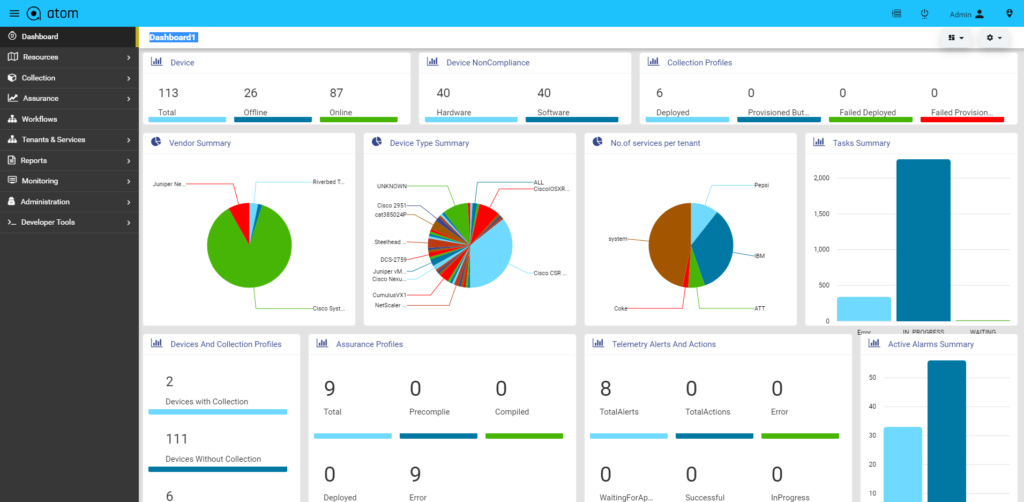
ATOM’s customizable dashboard
The network is the center stage of any organizational development strategy. It has to adapt to meet the ever-changing needs of users across an entire business large to small. Organizations can’t rely on siloed monitoring solutions, and rather they require a solution that is unified and supports a multi-vendor infrastructure. A comprehensive monitoring solution such as ATOM ensures that all relevant information is captured and analyzed to not only unlock business insights but also empower digital transformation.
Learn how Anuta Network’s ATOM helped a large financial services provider consolidate their network monitoring requirements and deliver a single-pane-of-glass for improved management and NetOps agility.